


![Request for Information – Potential [Placeholder for Prize]](https://assets.science.nasa.gov/dynamicimage/assets/science/psd/solar/2023/09/s/solarsystem_0.jpg?w=1024)


(Update #2) Satellite View of Post Tropical Cyclone Jose Fading
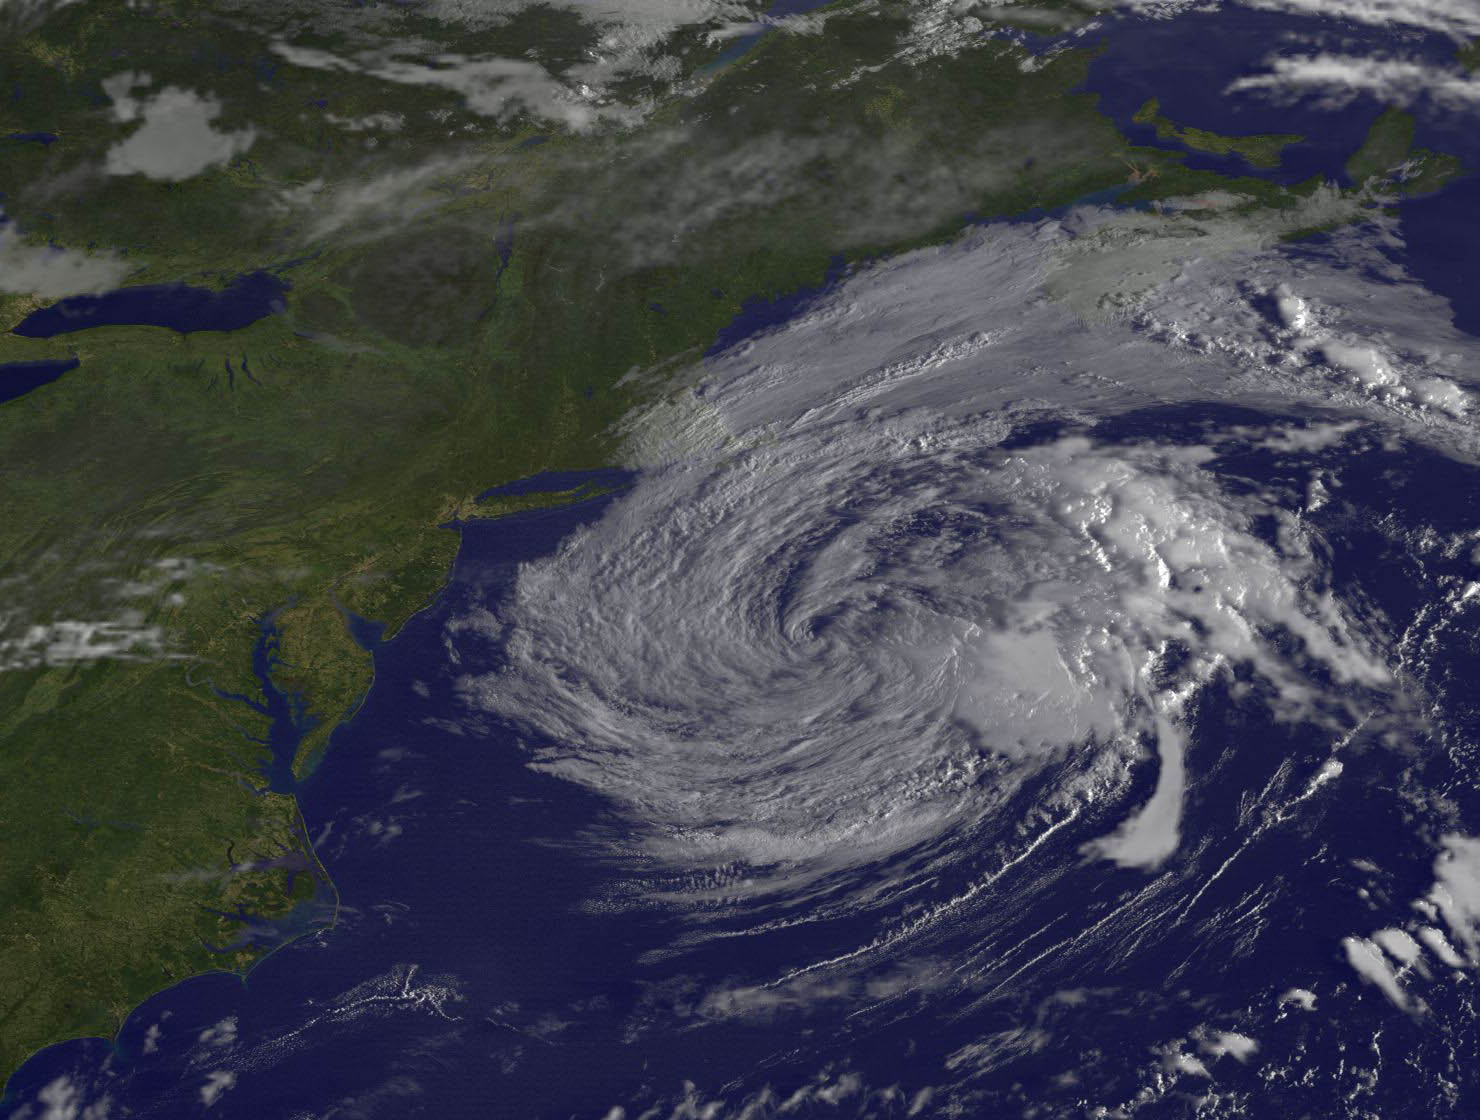
The National Hurricane Center issued their final advisory on Post-Tropical Cyclone Jose on Sept. 22 at 5 p.m. EDT. NOAA’s GOES East satellite saw the circulation of Jose on Sept. 23 off the New England coast as it continued to weaken. All Tropical Storm Warnings have been discontinued.
At 5 p.m. EDT (2100 UTC) on Sept. 22 in the National Hurricane Center’s final advisory, the center of Post-Tropical Cyclone Jose was located near 39.3 degrees north latitude and 69.1 degrees west longitude. That’s about 140 miles south-southeast of Nantucket, Massachusetts. The post-tropical cyclone was moving toward the southeast near 3 mph (6 kph) and a slow southeastward drift is forecast for the next day or two.
Maximum sustained winds are near 45 mph (75 kph) with higher gusts. The estimated minimum central pressure is 996 millibars.
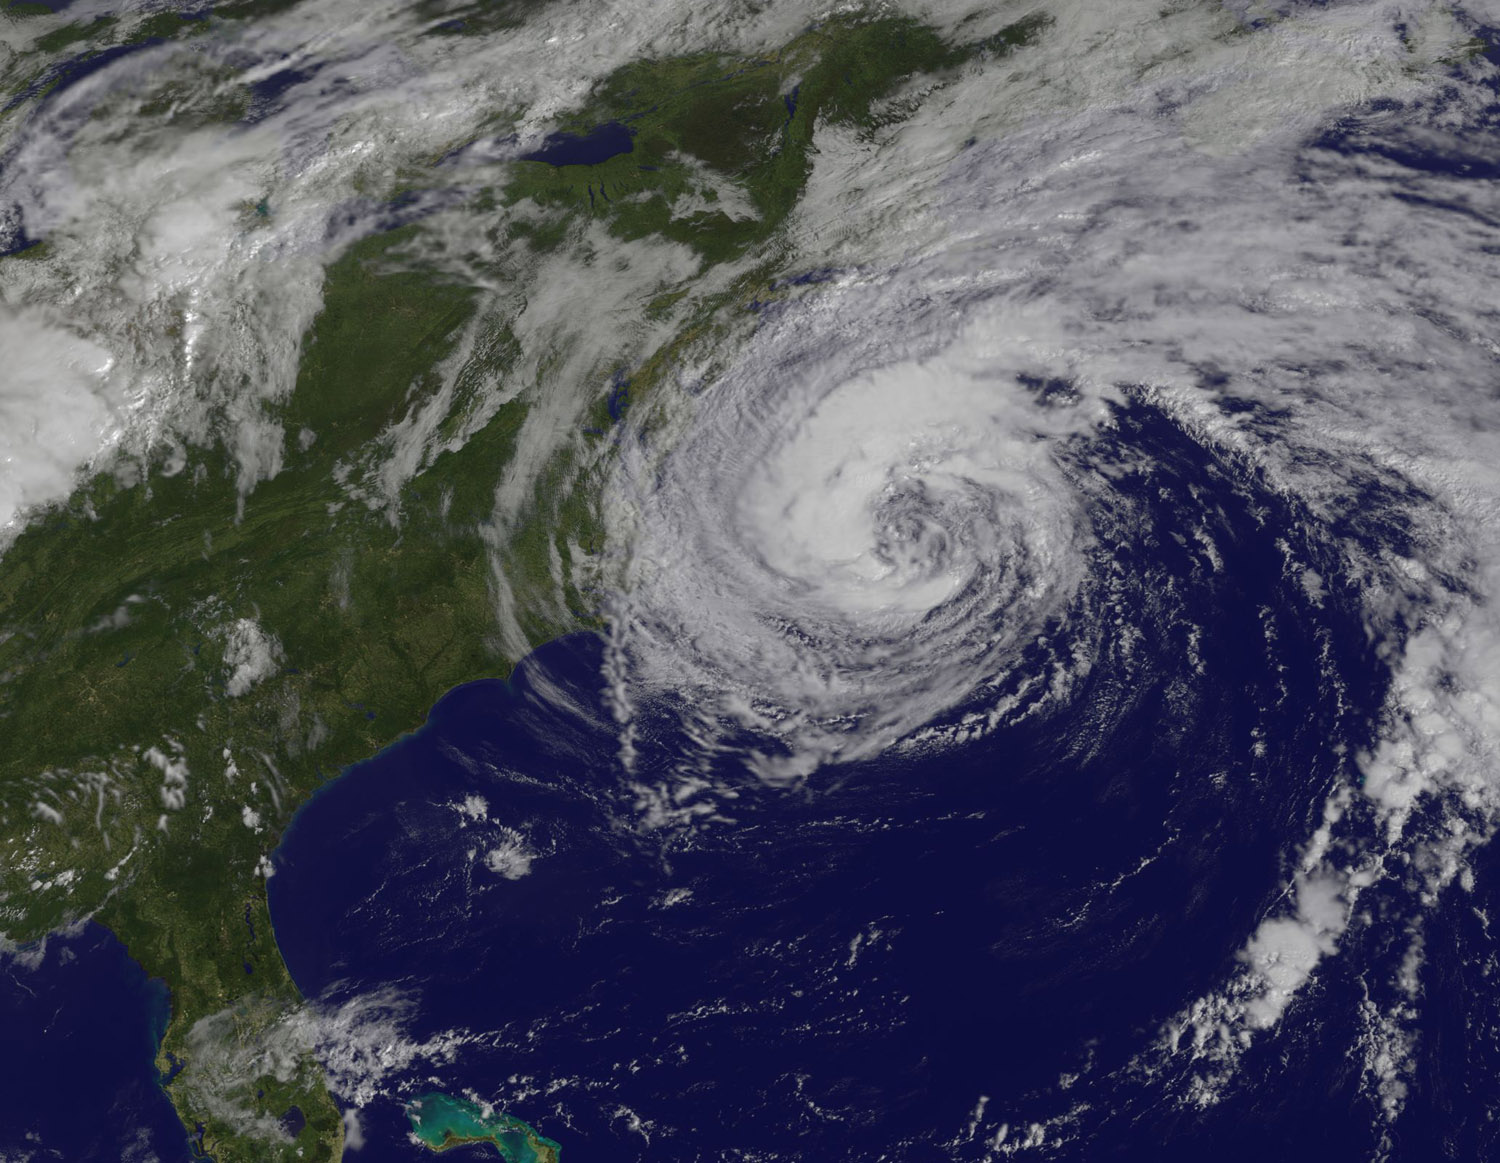
NOAA’s GOES East satellite provided this visible view of post-tropical cyclone Jose on Saturday, Sept. 23 at 8:15 a.m. EDT. The storm continued weakening and generated light rain. The northwestern quadrant was still over Cape Cod, Massachusetts.
Swells generated by Jose are affecting Bermuda and much of the U.S. east coast and will likely cause dangerous surf and rip current conditions during the next couple of days. Cape Cod, Nantucket and Martha’s Vineyard maintained a high surf advisory on Sept. 23.
Rob Gutro
NASA’s Goddard Space Flight Center
Sep. 23, 2017 – (Update #1) Satellite Animation Shows Hurricane Maria and Post-Tropical Storm Jose
Credits: NASA-NOAA GOES Project
Sep. 22, 2017 – (Update #2) NASA’s Terra Satellite Sees a Very Stubborn Post-Tropical Cyclone Jose
Jose continues to bring tropical storm conditions to southern New England although the storm has become post-tropical. NASA’s Terra satellite caught a view of the storm sitting almost stationary about 100 miles from Nantucket Island, Massachusetts.
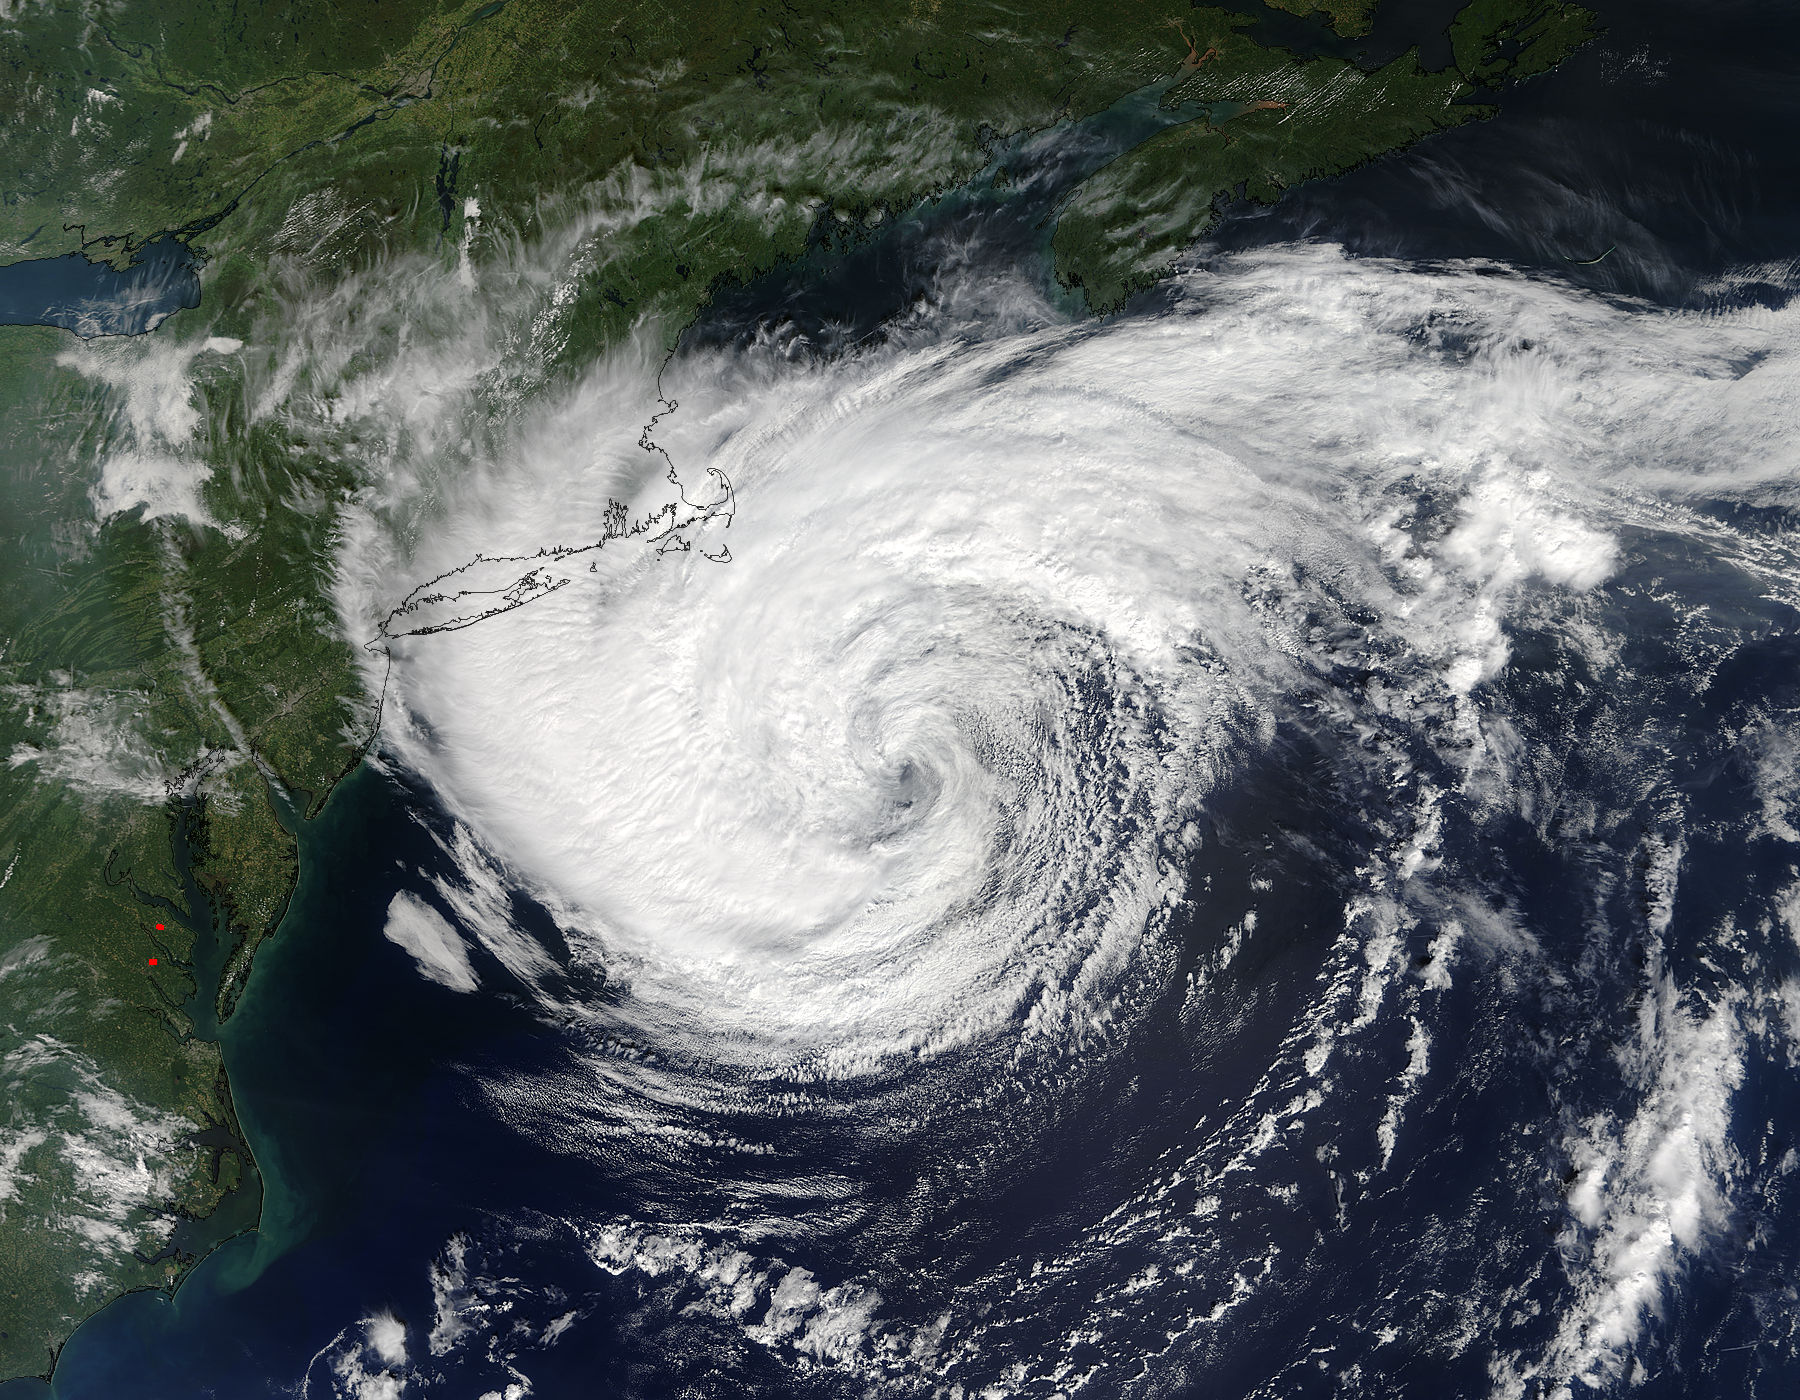
On Sept. 21 at 11:25 a.m. EDT (1525 UTC), the MODIS instrument or Moderate Resolution Imaging Spectroradiometer aboard NASA’s Terra satellite took a visible picture of Jose. The image showed Jose’s clouds in the northwestern quadrant continued sweep over southern New England, southeastern New York, and northeastern New Jersey. Jose is a large storm and the clouds in its northeastern quadrant are just south of Nova Scotia, Canada. Tropical-storm-force winds extend outward up to 220 miles (350 km) from the center.
Jose formed on Sept. 2 and has been around 20 days. The National Hurricane Center issued their 68th advisory on Jose on Sept. 22.
A Tropical Storm Warning is in effect for Woods Hole to Sagamore Beach, including Cape Cod, Massachusetts, Block Island, Martha’s Vineyard and Nantucket Island.
At 5 a.m. EDT, National Hurricane Center (NHC) forecaster Zelinsky noted “Since the last advisory, a small burst of deep convection has been observed near the center of Jose. The cyclone is still embedded within a dry environment and located over cold sea surface temperatures, so it will be a little surprising if the convection is maintained for an extended period of time this morning.”
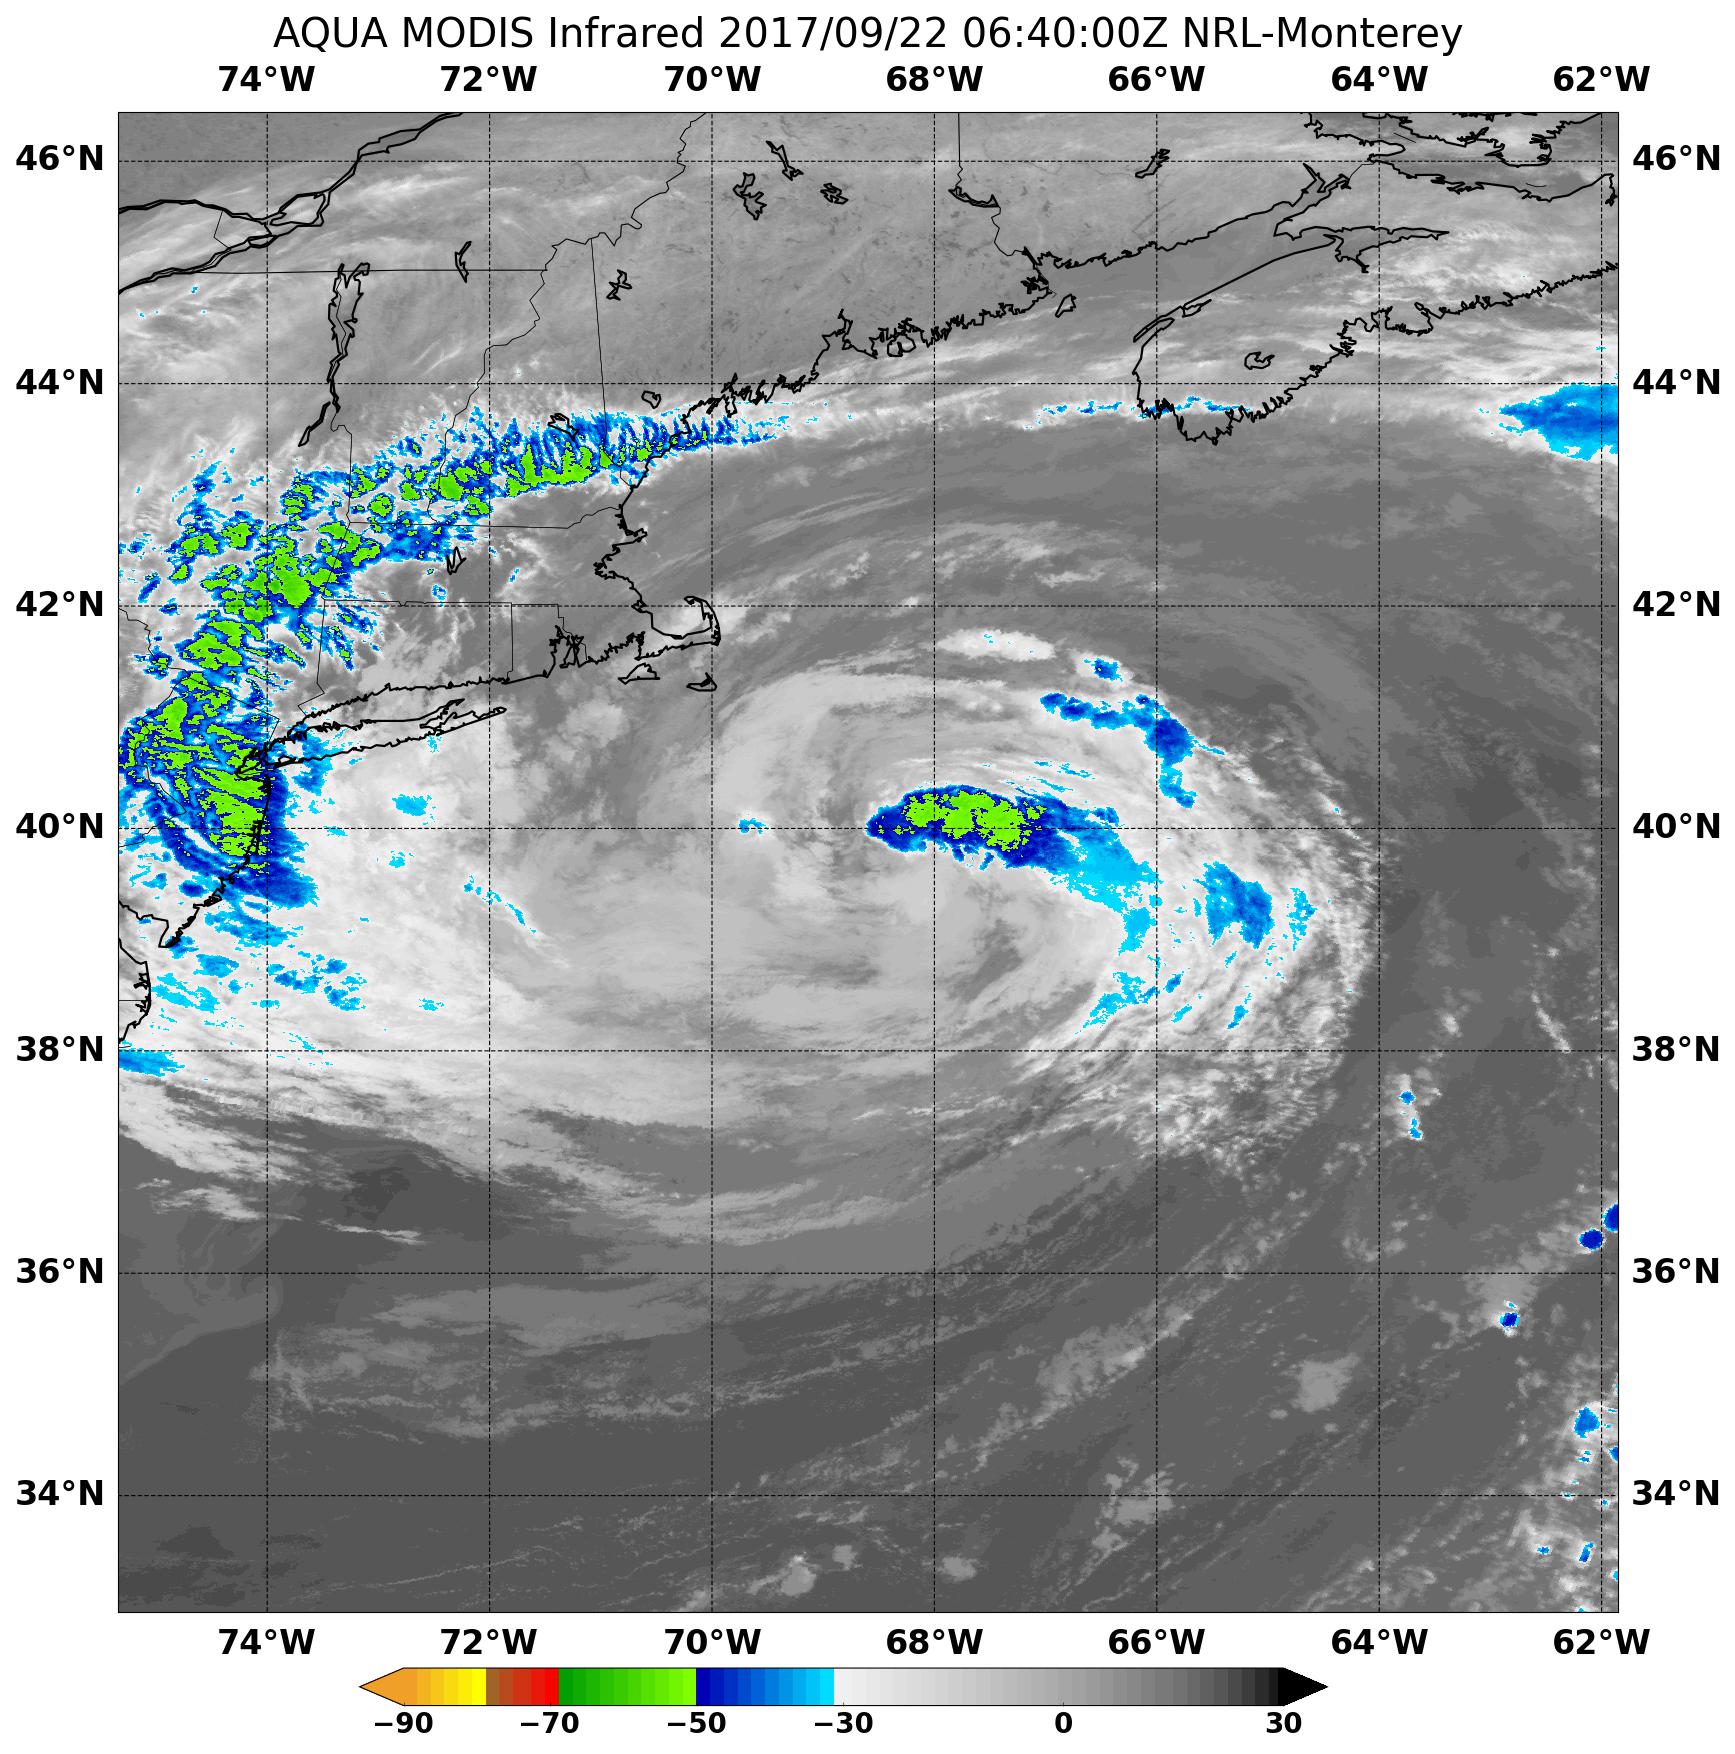
NASA’s Aqua satellite observed Jose in infrared light on Sept. 22 at 2:40 a.m. EDT (6:40 UTC) that provided temperatures. The coldest clouds were the strongest storms. The Moderate Resolution Imaging Spectroradiometer or MODIS instrument aboard NASA’s Aqua satellite found two areas where cloud top temperatures were coldest and as cold as minus 50 degrees Fahrenheit (minus 45.5 degrees Celsius).
Those areas of coldest cloud tops and strongest storms were located in Jose’s northeastern quadrant around the center of circulation and in a fragmented band of thunderstorms that stretched from New Jersey to western Massachusetts and northeast to southeastern Maine.
At 8 a.m. EDT (1200 UTC) on Sept. 22 the center of Post-Tropical Cyclone Jose was located near 39.7 degrees north latitude and 69.0 degrees west longitude. That’s about 115 miles (185 km) south-southeast of Nantucket, Massachusetts.
The post-tropical cyclone is moving slowly toward the west near 2 mph (4 kph). Jose is expected to meander well off the coast of New England for the next several days. Maximum sustained winds are near 50 mph (85 kph) with higher gusts. Gradual weakening is forecast for the next 48 hours. The estimated minimum central pressure is 993 millibars.
Minor coastal flooding is possible along portions of the coast of southern New England during the next few days. Swells generated by Jose are affecting Bermuda and much of the U.S. east coast, and will likely cause dangerous surf and rip current conditions for the next couple of days in these areas
All of the dynamical models remain in good agreement that Jose will remain trapped in weak steering flow while gradually spinning down for the next several days.
For forecast updates on Jose, visit: www.nhc.noaa.gov
Rob Gutro
NASA’s Goddard Space Flight Center
Sep. 22, 2017 – (Update #1) Hurricane Satellite Animation Shows Hurricane Maria and Post-Tropical Storm Jose
Credits: NASA-NOAA GOES Project
Sep. 21, 2017 – NASA Sees Large Tropical Storm Jose Doing a “Sit and Spin” off the Massachusetts Coast
Tropical Storm Jose continued to spin south of Massachusetts when NASA’s Aqua satellite flew overhead from space and captured an image of the large storm that hasn’t moved much.

Because of Jose’s close proximity to southern New England, the National Hurricane Center said that tropical storm conditions are occurring over portions of southeastern New England, today, Sept. 21. Also, high surf and rip currents expected to continue on the east coast of the United States.
A Tropical Storm Warning is in effect from Woods Hole to Sagamore Beach, including Cape Cod, Massachusetts. In addition to Block Island, Martha’s Vineyard and Nantucket.
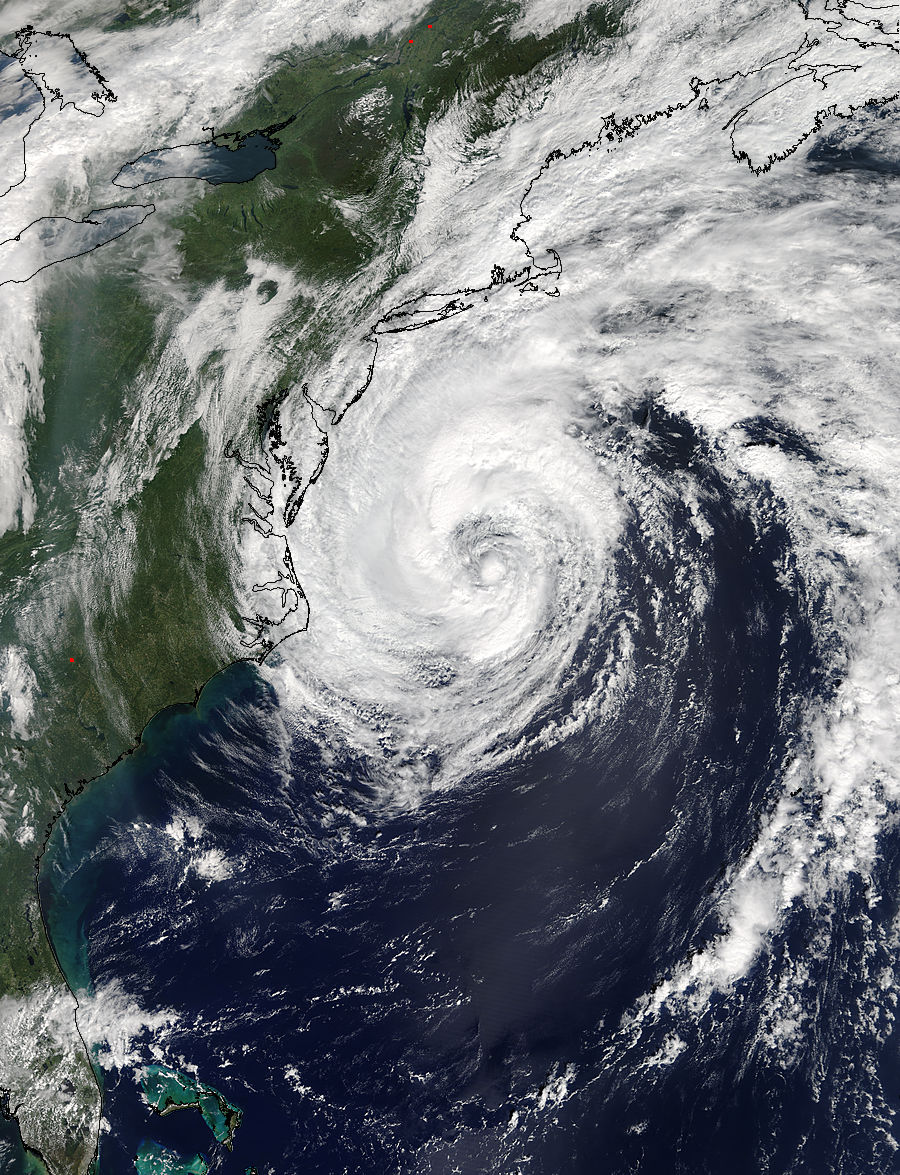
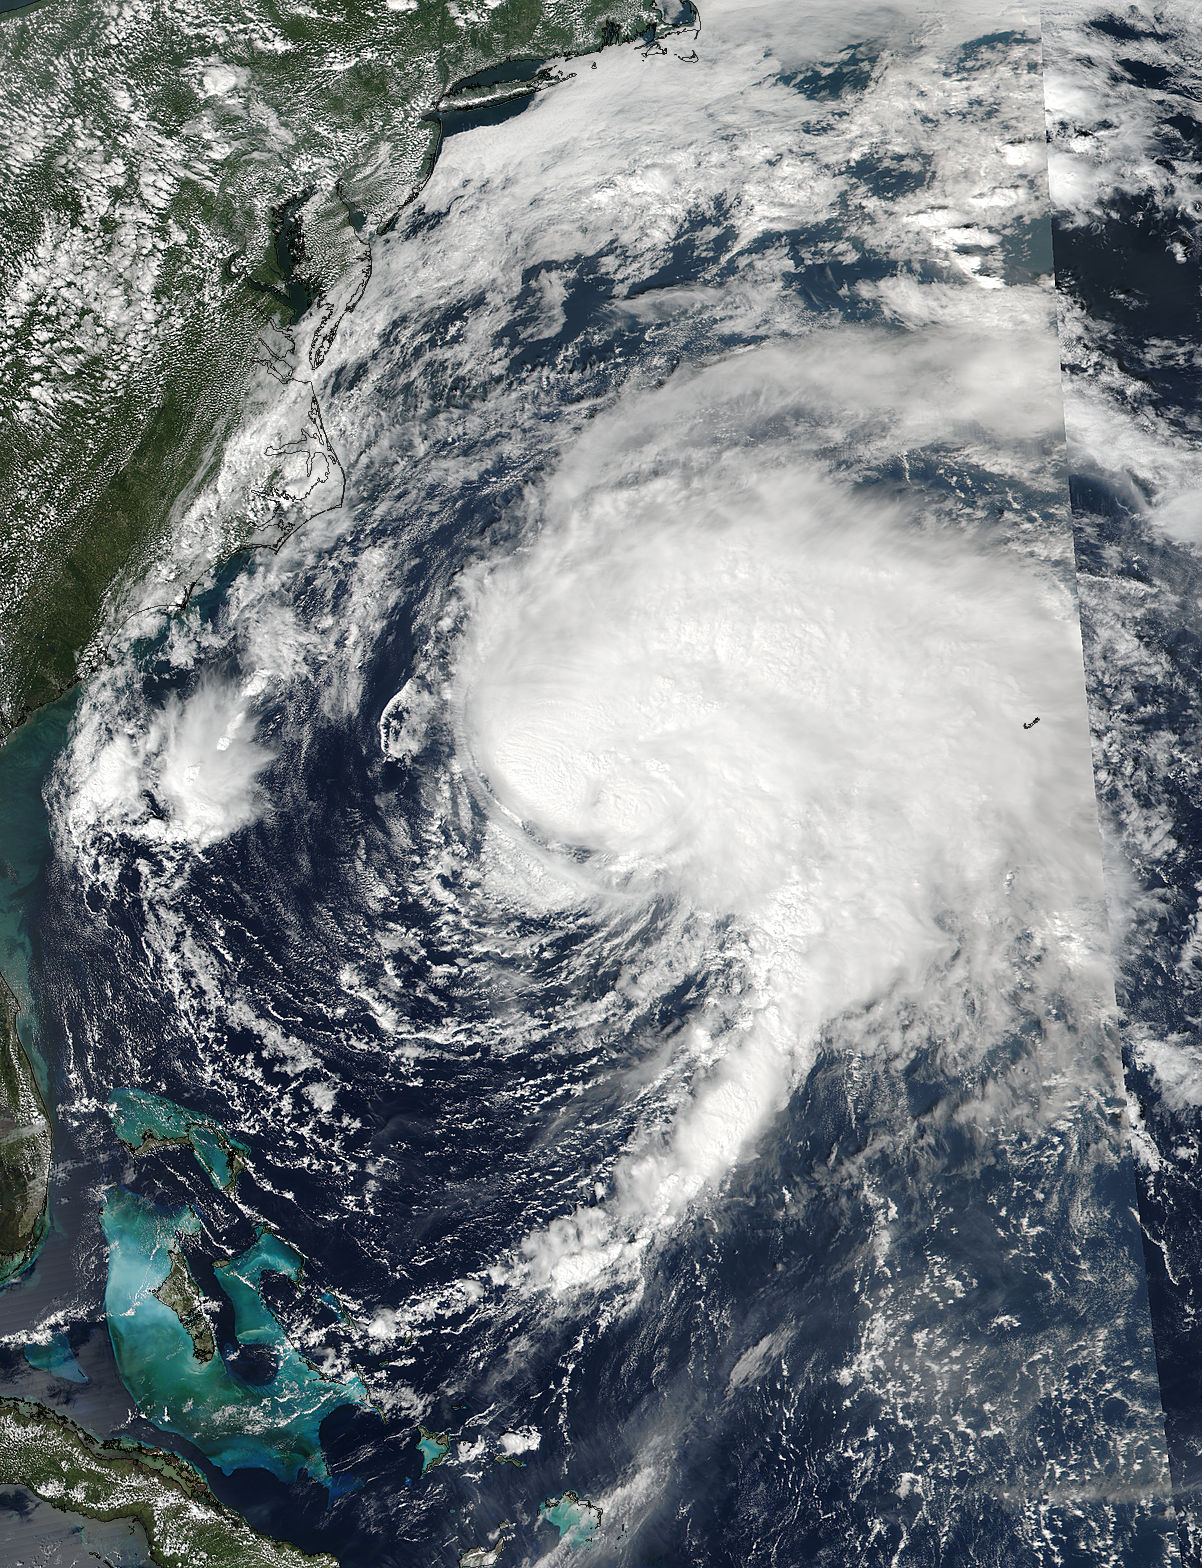
NASA’s Aqua satellite flew over Tropical Storm Jose on Sept. 20 at 2 p.m. EDT (1800 UTC) when it was centered south of Cape Cod, Massachusetts. The Moderate Resolution Imaging Spectroradiometer, known as MODIS captured a visible light picture of the large tropical storm. The storm appeared to have a defined center of circulation. Visible and microwave satellite data showed that the storm was still producing well-defined convective bands on the north side of the circulation. Some of these outer bands were approaching the southern New England coastline.
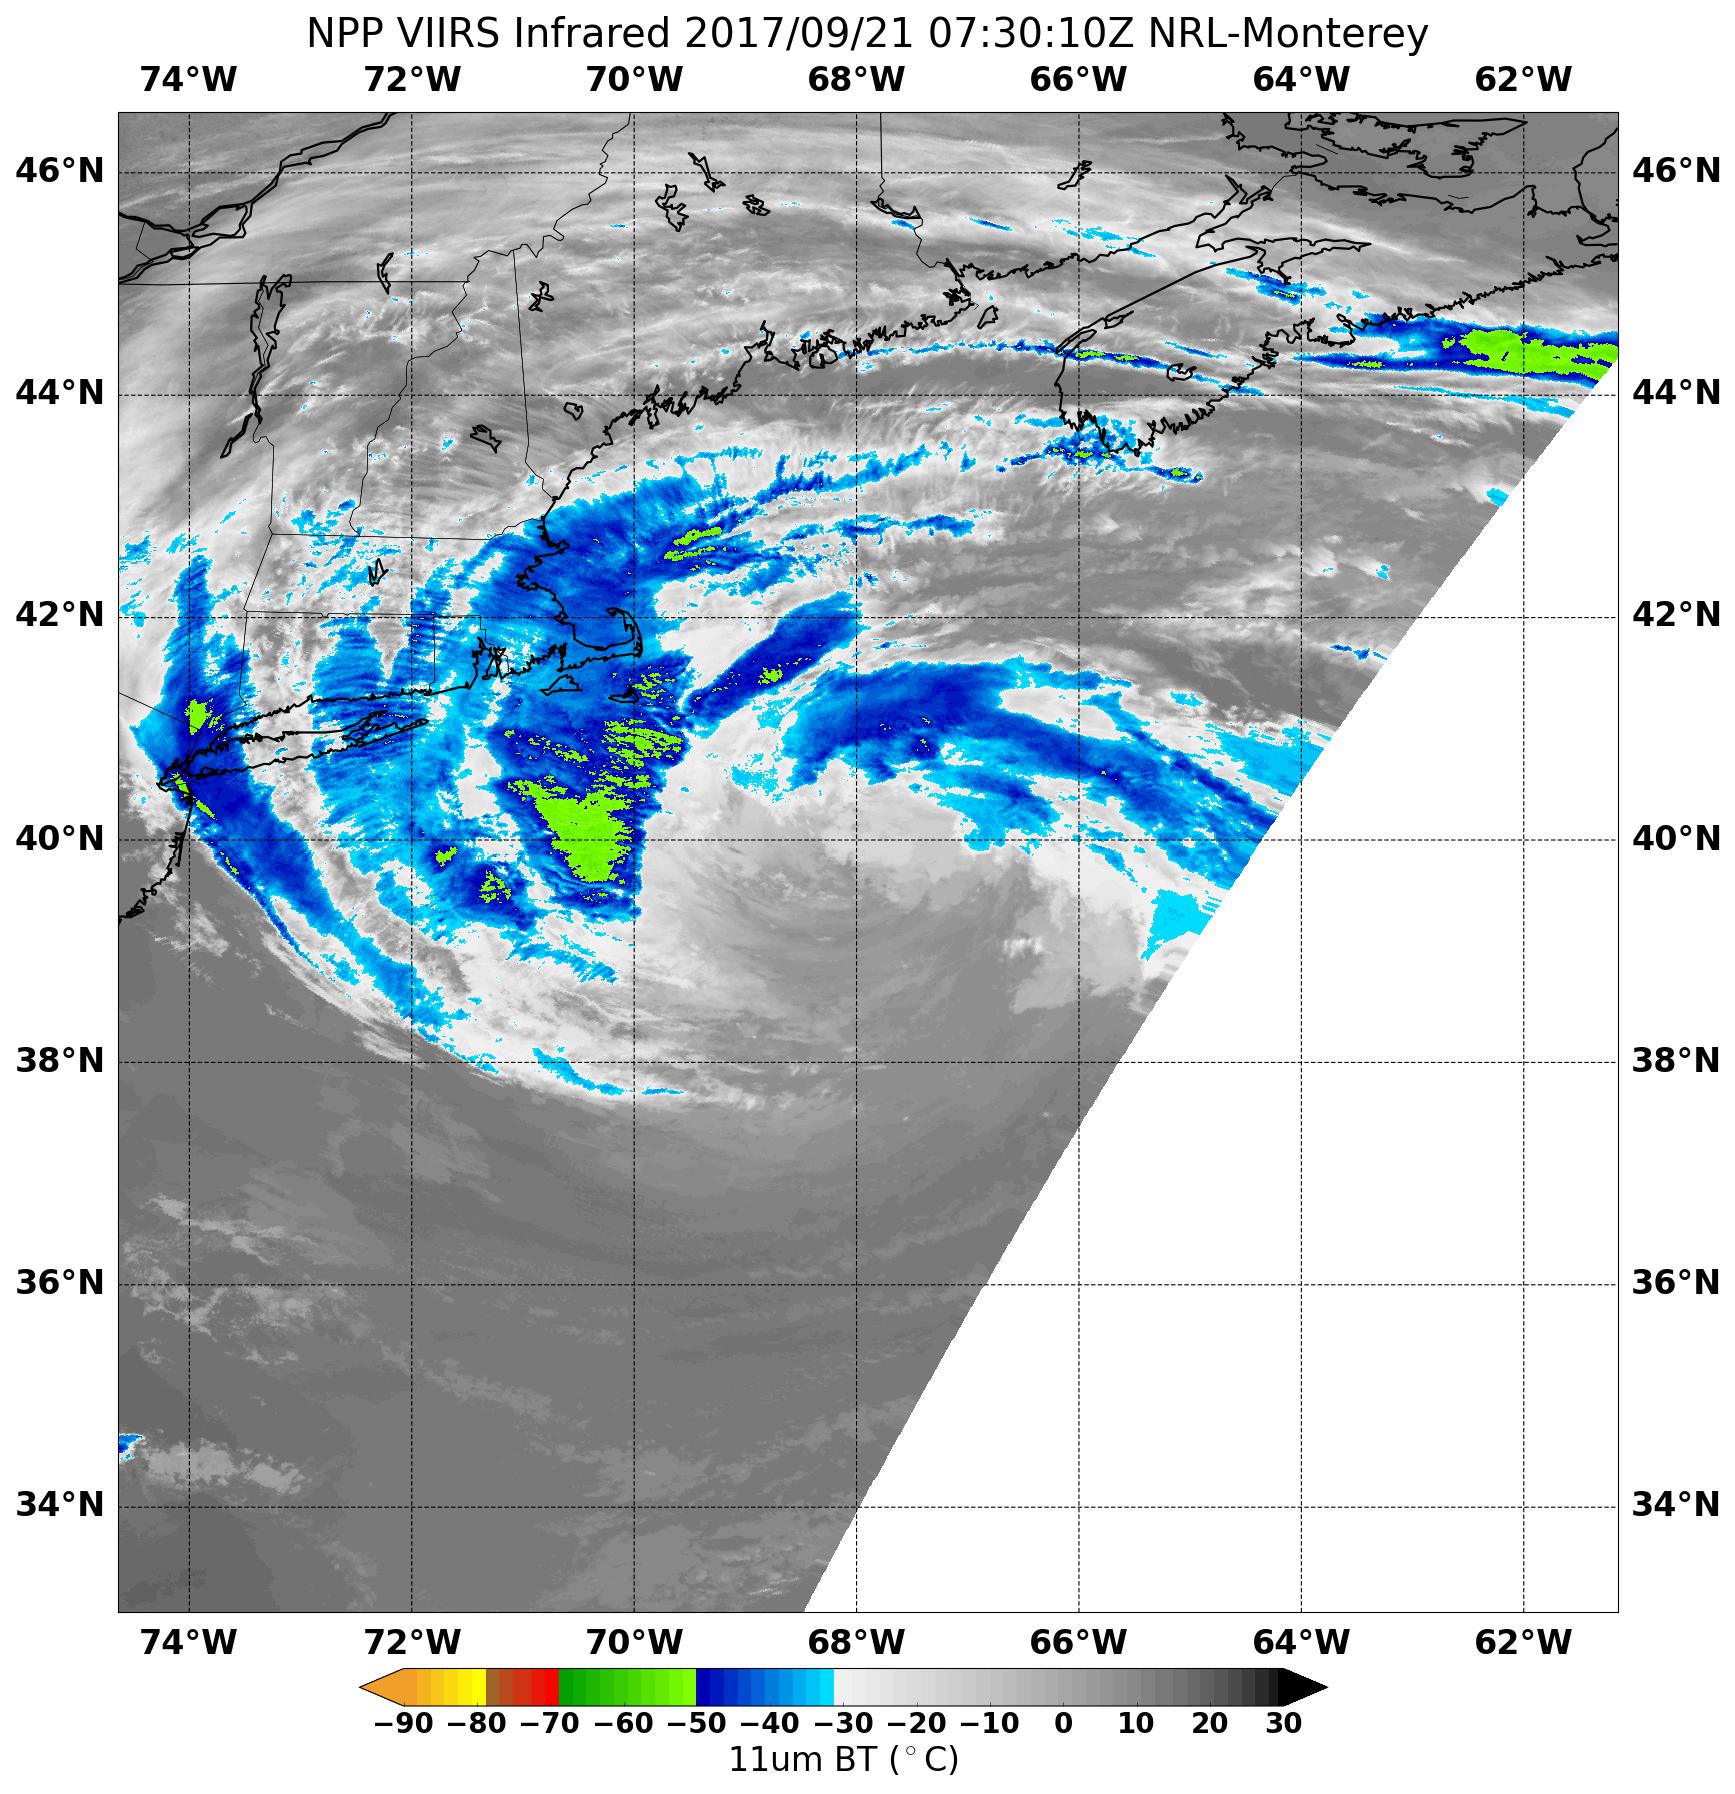
On Sept. 21 at 3:30 a.m. EDT (0730 UTC) the Visible Infrared Imaging Radiometer Suite (VIIRS) instrument aboard NASA-NOAA’s Suomi NPP satellite looked at Tropical Storm Jose in infrared light and found the coldest cloud tops and most powerful storms were located northwest of the center. Cloud top temperatures were as cold as minus 50 degrees Fahrenheit or minus 45.5 degrees Celsius).
At 8 a.m. EDT/AST (1200 UTC), the center of Tropical Storm Jose was located near 39.6 degrees north latitude and 68.1 degrees west longitude. That’s about 150 miles southeast of Nantucket Island, Massachusetts. Maximum sustained winds remain near 60 mph (95 kph) with higher gusts. Gradual weakening is forecast during the next couple of days, and Jose is forecast to become post-tropical on Friday. The minimum central pressure recently reported by an Air Force reconnaissance aircraft is 982 millibars.
Jose is a large system. Tropical-storm-force winds extend outward up to 230 miles (370 km) from the center. A gust to 48 mph (78 kph) was recently reported at the Nantucket Airport. An unofficial observing site in Vineyard Haven on Martha’s Vineyard recently reported a sustained wind of 39 mph (63 km/h) with a gust to 52 mph (83 kph).
The National Hurricane Center noted that “Jose is stationary, and the system is expected to continue to meander off the coast of southeast New England for the next several days.”
Swells generated by Jose are affecting Bermuda and much of the U.S. east coast and will likely cause dangerous surf and rip current conditions during the next few days.
For updated forecasts on Jose visit: www.nhc.noaa.gov.
Rob Gutro
NASA’s Goddard Space Flight Center
Sep. 21, 2017 – (Update #1) Satellite Animation Shows Hurricane Maria and Tropical Storm Jose
Credits: NASA/NOAA GOES Project
Sep. 20, 2017 – (Update #2) NASA Gets an Infrared View of Large Tropical Storm Jose
Satellite imagery shows that Jose is a large storm, with a large reach. NASA’s Aqua satellite captured cloud top temperatures of Tropical Storm Jose that revealed the strongest storms were in the northeastern part of the tropical cyclone but the storm is so large that it is causing dangerous ocean conditions from Bermuda to the U.S. East coast.
Tropical-storm-force winds extend outward up to 205 miles (335 km) from the center. Despite the strongest side facing away from the coast, dangerous surf and rip currents expected to continue for several more days along much of the east coast of the United States.
On Sept. 20, a Tropical Storm Warning is in effect for Woods Hole to Sagamore Beach, including Cape Cod, Massachusetts, Block Island, Martha’s Vineyard and Nantucket Island.
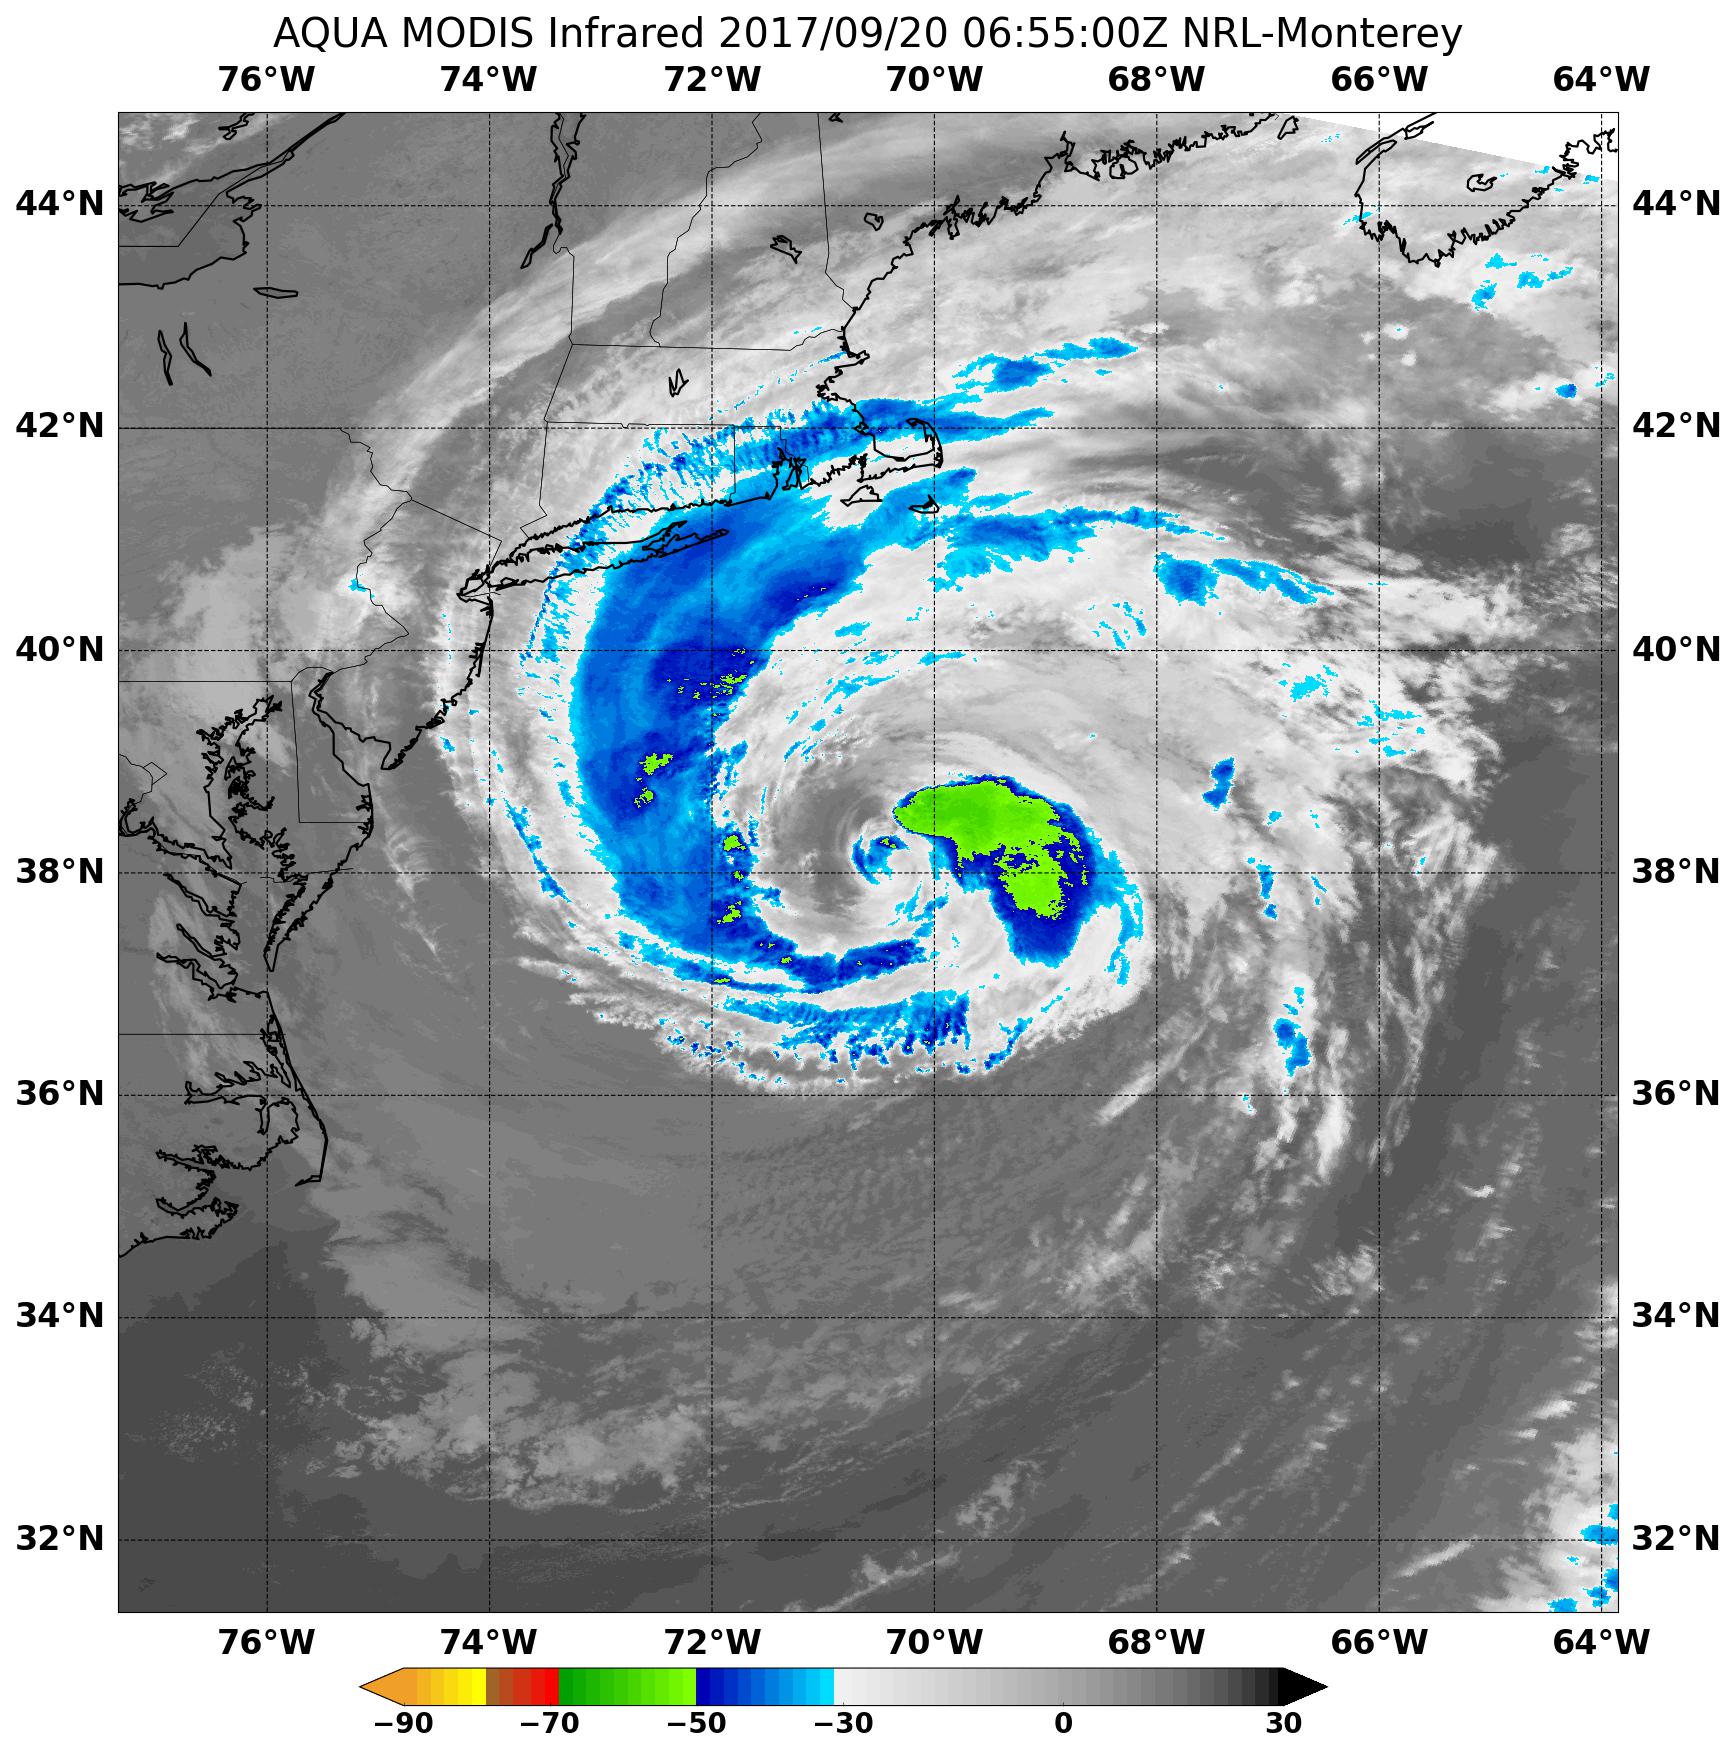
The Moderate Resolution Imaging Spectroradiometer or MODIS instrument that flies aboard NASA’s Aqua satellite captured infrared data on Tropical Storm Jose on Sept. 20 at 2:55 a.m. EDT (0655). Infrared data provides temperature information to scientists. Cloud top temperatures are an important factor when it comes to determining the strength of storms. The higher the cloud tops, the colder and the stronger the storms.
The MODIS data showed that the coldest cloud tops were colder than minus 50 degrees Fahrenheit (minus 45.5 degrees Celsius). Those storms were found northeast of the center of circulation. Cloud top temperatures around the rest of the circulation were warmer indicating weaker storms. Clouds associated with Jose stretched from North Carolina up to Nova Scotia, Canada.
The National Hurricane Center noted “Although Jose does not have a purely tropical appearance, it still has a warm core and well-defined convective bands, especially to the north of the center. “
At 11 a.m. EDT (1500 UTC), the center of Tropical Storm Jose was located near 39.0 degrees north latitude and 70.0 degrees west longitude. That puts Jose’s center about 150 miles (245 km) south of Nantucket Island, Massachusetts. Jose was moving toward the northeast near 8 mph (13 kph), and this general motion with a decrease in forward speed is expected to continue through tonight. Maximum sustained winds are near 70 mph (110 kph) with higher gusts. Gradual weakening is forecast during the next couple of days. The minimum central pressure based on data from the Air Force Hurricane Hunters is 976 millibars.
The National Hurricane Center forecasts a slow westward motion to begin on Thursday, Sept. 21. On the forecast track, the center of Jose is expected to pass well to the east of the New Jersey coast today, and pass offshore of southeastern Massachusetts on Thursday.
NHC said Jose is expected to produce additional rainfall accumulations of 1 to 2 inches over Martha’s Vineyard and Cape Cod, and 2 to 4 inches in Nantucket as it passes offshore today into Thursday. This rainfall could cause isolated flash flooding.
Swells generated by Jose are affecting Bermuda and much of the U.S. east coast and will likely cause dangerous surf and rip current conditions during the next several days. Minor to moderate coastal flooding is possible from Delaware to southern New England during the next several days.
For updated forecasts on Jose, visit: www.nhc.noaa.gov.
Rob Gutro
NASA’s Goddard Space Flight Center
Sep. 20, 2017 – (Update #1) Satellite Animation Shows Hurricane Maria Make Landfall in Puerto Rico, Jose Along East Coast
Credits: NASA’s Goddard Space Flight Center/Ryan Fitzgibbons
Sep. 19, 2017 – NASA Tracking Jose Meandering Off U.S. East Coast
Jose has been a named storm for nearly two weeks now as it continues to slowly move northward off the U.S. East Coast east of the Outer Banks of North Carolina. NASA’s GPM satellite and NOAA’s GOES East satellites have provided a look at the rainfall and movement of this long-lived storm.
The National Hurricane Center noted on Sept. 19 that Jose is expected to produce dangerous surf and rip currents along the East coast of the United States for several more days. A Tropical Storm Warning is in effect for Watch Hill, North Carolina to Hull, Block Island, Martha’s Vineyard and Nantucket.
A Tropical Storm Watch is in effect for the coast of Long Island from Fire Island Inlet to Port Jefferson and from New Haven, Conn. to Watch Hill, Rhode Island.
Jose’s Hurricane History
At one time, Jose was a powerful category 4 border line category 5 storm with maximum sustained winds at 155 mph as reported by the National Hurricane Center on September 9 as it was approaching the northern Leeward Islands. Jose passed northeast of the Leeward Islands as a category 4 storm on a northwest track and then began to weaken due to the effects of northerly wind shear. Jose then made a counterclockwise loop about midway between the southern Bahamas and Bermuda. During this time, Jose continued to weaken down to tropical storm intensity. Remaining over warm water allowed Jose to strengthen back into a hurricane on Sept. 15 as wind shear across the storm diminished. At this time, Jose was still only midway between the central Bahamas and Bermuda, having just completed its loop, and moving to the northwest. On Sept. 16, Jose turned northward as it moved around the western edge of a ridge of high pressure near Bermuda and began to parallel the U.S. East Coast well away from shore.
A Look at Jose’s Rainfall
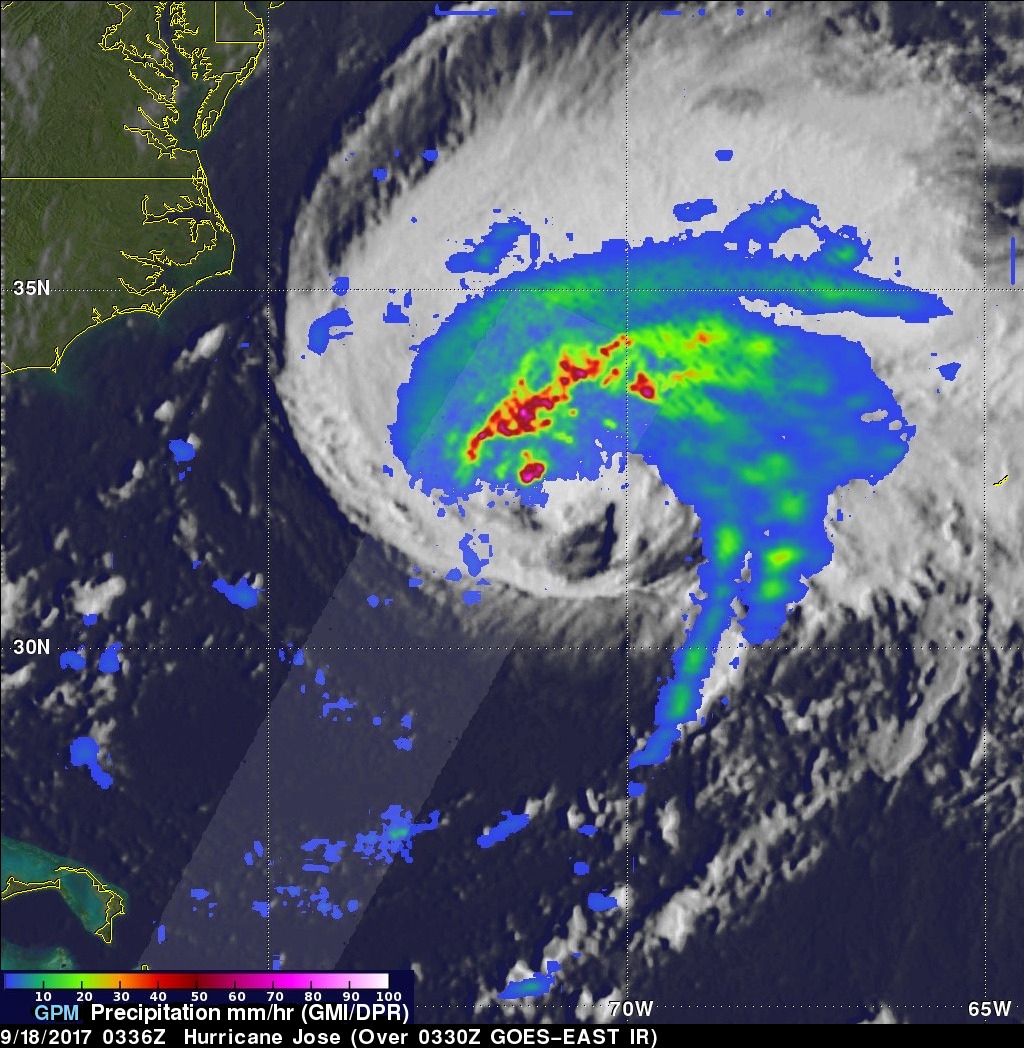
The Global Precipitation Measurement mission or GPM core satellite captured an image of Jose overnight at 3:36 UTC on Sept. 18 (11:36 p.m. EDT, Sept. 17) as the storm was moving due north at 9 mph well off shore from the coast of North Carolina. To create a total picture of Jose and its rainfall locations, GPM’s GMI and DPR instruments provided rainfall data that was overlaid on enhanced infrared imagery from the GOES-East satellite that showed the clouds of the storm.
Although Jose was still a hurricane with maximum sustained winds reported near 90 mph by Hurricane Hunters, GPM reveals that Jose is rather asymmetric with most of the rain located north of the center as a result of strong southwesterly wind shear. Within this convective band there are still areas of very heavy rain on the order of 75 mm/hr (~3 inches per hour). GPM is a joint mission between NASA and the Japanese space agency JAXA.
Animating Jose’s Meandering Track
At NASA’s Goddard Space Flight Center in Greenbelt, Maryland, the NASA/NOAA GOES Project created an animation of NOAA’s GOES East satellite imagery from Sept. 17 at 7:30 a.m. EDT (1130 UTC) to Sept. 19 ending at 7:30 a.m. EDT (1130 UTC). The animation shows Hurricane Jose slowly moving north over two days while remaining over 200 miles off shore from the Carolinas.
Credits: NASA-NOAA GOES Project
The GOES East satellite imagery shows that Jose is a large tropical cyclone. The National Hurricane Center (NHC) noted that hurricane-force winds extend outward up to 45 miles (75 km) from the center and tropical-storm-force winds extend outward up to 310 miles (500 km).
A ship located more than 200 miles southwest of the center of Jose recently reported a sustained wind of 40 mph (65 kph), and NOAA Buoy 44014, located east of the Virginia-North Carolina border or about 160 miles west of the center, also reported a sustained wind of 40 mph (65 kph).
Jose’s Location on Sept. 19
At 8 a.m. EDT (1200 UTC), the center of Hurricane Jose was located by an Air Force Reserve hurricane hunter aircraft near 36.3 degrees north latitude and 71.6 degrees west longitude. That’s about 235 miles (380 km) east-northeast of Cape Hatteras, North Carolina and 350 miles (560 km) south-southwest of Nantucket, Mass.
Jose is moving toward the north near 9 mph (15 kph). NHC said this general motion is expected to continue through today with a turn to the northeast anticipated tonight. On the forecast track, the center of Jose is forecast to pass well offshore of the Delmarva peninsula later today, pass well to the east of the New Jersey coast on Wednesday, and pass offshore of southeastern Massachusetts by Thursday, Sept. 21.
Maximum sustained winds remain near 75 mph (120 kph) with higher gusts. Little change in strength is expected today, but Jose should begin to gradually weaken on Wednesday.
Although the center of Jose is not forecast to make landfall, the storm is bringing dangerous surf and rip currents to the U.S. East Coast, and tropical storm watches and warnings have been issued by the National Hurricane Center from the Jersey shore up the coast, including Long Island, and through Cape Cod where winds are expected to reach tropical storm strength.
As Jose continues northward, it should continue to lose strength as it moves over cooler waters north of the Gulf Stream and should begin to lose some of its tropical characteristics. However, by the end of the week, what’s left of Jose could once again be left meandering somewhere southeast of the New England Coast as steering currents are forecast to weaken.
For updated forecasts on Jose, visit: www.nhc.noaa.gov.
Stephen Lang / Rob Gutro
NASA’s Goddard Space Flight Center
Sep. 18, 2017 – NASA Sees Hurricane Jose Off the U.S. East Coast
Hurricane Jose producing dangerous surf and rip currents along the east Coast of the United States. Satellite imagery shows Jose is now close enough to the coast to also trigger a tropical storm warnings and watches.
Warnings and Watches in Effect
On Sept. 18, a Tropical Storm Warning is in effect for Watch Hill to Hull, Block Island, Rhode Island, Martha’s Vineyard and Nantucket Island, Massachusetts. A Tropical Storm Watch is in effect for Fenwick Island to Sandy Hook, Delaware Bay South, East Rockaway Inlet, N.Y. to Watch Hill, Rhode Island.
Satellites Keeping Track of Jose
NASA-NOAA’s Suomi NPP satellite passed over Hurricane Jose when it was off the coast of the Carolinas, creating dangerous surf along the U.S. East Coast.
The Visible Infrared Imaging Radiometer Suite (VIIRS) instrument aboard NASA-NOAA’s Suomi NPP satellite flew over Jose on Sept. 17 at 2:24 p.m. EDT and captured a visible light image of the storm. Most of the clouds and thunderstorms appeared to be north and east of the center of circulation.
The National Hurricane Center noted on Sept. 18 that “Satellite images indicate that Jose is losing some tropical characteristics. The cloud pattern of the hurricane is asymmetric with much of the central convection and convective bands confined to the north of the center.”

NOAA’s GOES East satellite provided a visible image of Jose on Sept. 18 at 1:45 pm EDT when the storm was centered about 265 miles east-southeast of Cape Hatteras, North Carolina. NOAA manages the GOES series of satellites and the NASA/NOAA GOES Project at NASA’s Goddard Space Flight Center in Greenbelt, Md. uses the data to create images and animations.
Jose’s Stats on Sept. 18
At 2 p.m. EDT (1800 UTC), the center of Hurricane Jose was located near 34.2 degrees north latitude and 71.0 degrees west longitude. That’s about 265 miles (425 km) east-southeast of Cape Hatteras, North Carolina.
Jose is moving toward the north near 9 mph (15 kph) and this general motion is expected to continue during the next day or so. A turn to the northeast is expected to occur on Tuesday night. On the forecast track, the center of Jose is forecast to pass well offshore of the Outer Banks of North Carolina this evening, pass well east of the Delmarva Peninsula tonight and Tuesday, Sept. 19 and pass well to the east of the New Jersey coast on Wednesday, Sept. 20.
Maximum sustained winds remain near 75 mph (120 kph) with higher gusts. Little change in strength is forecast during the next 48 hours. The estimated minimum central pressure is 977 millibars.
Rainfall Expected and Dangerous Coastal Seas
According to the National Hurricane Center, Jose is expected to produce total rain accumulations of 3 to 5 inches over eastern Long Island, southeast Connecticut,
southern Rhode Island, and southeast Massachusetts, including Martha’s Vineyard and Nantucket through Wednesday. Jose is also expected to produce total rain accumulations up to 2 inches along the mid-Atlantic coast, and from southeast New York to coastal Maine. This rainfall could cause isolated flooding.
Swells generated by Jose are affecting Bermuda, the Bahamas, and much of the U.S. east coast. These swells are likely to cause dangerous surf and rip current conditions for the next several days in these areas.
Jose is expected to stay over the warm Gulf Stream for another day, and then move into an area with higher south-southwesterly vertical wind shear and progressively drier air, which are expected to gradually weaken the storm.
For updates on Jose, visit: www.nhc.noaa.gov
Rob Gutro
NASA’s Goddard Space Flight Center
Sep. 15, 2017 – Satellite Eyeing Tropical Storm Jose Churning Coastal Waters
Although Tropical Storm Jose was located off the coast of southeastern U.S. it is stirring up the waters along the U.S. East coast, causing dangerous conditions. NOAA’s GOES East satellite saw Jose centered about 360 miles northeast of the southwestern Bahamas on Sept. 15.
The National Hurricane Center said “Jose is expected to produce high surf and life-threatening rip currents along portions of the U.S. East coast.”
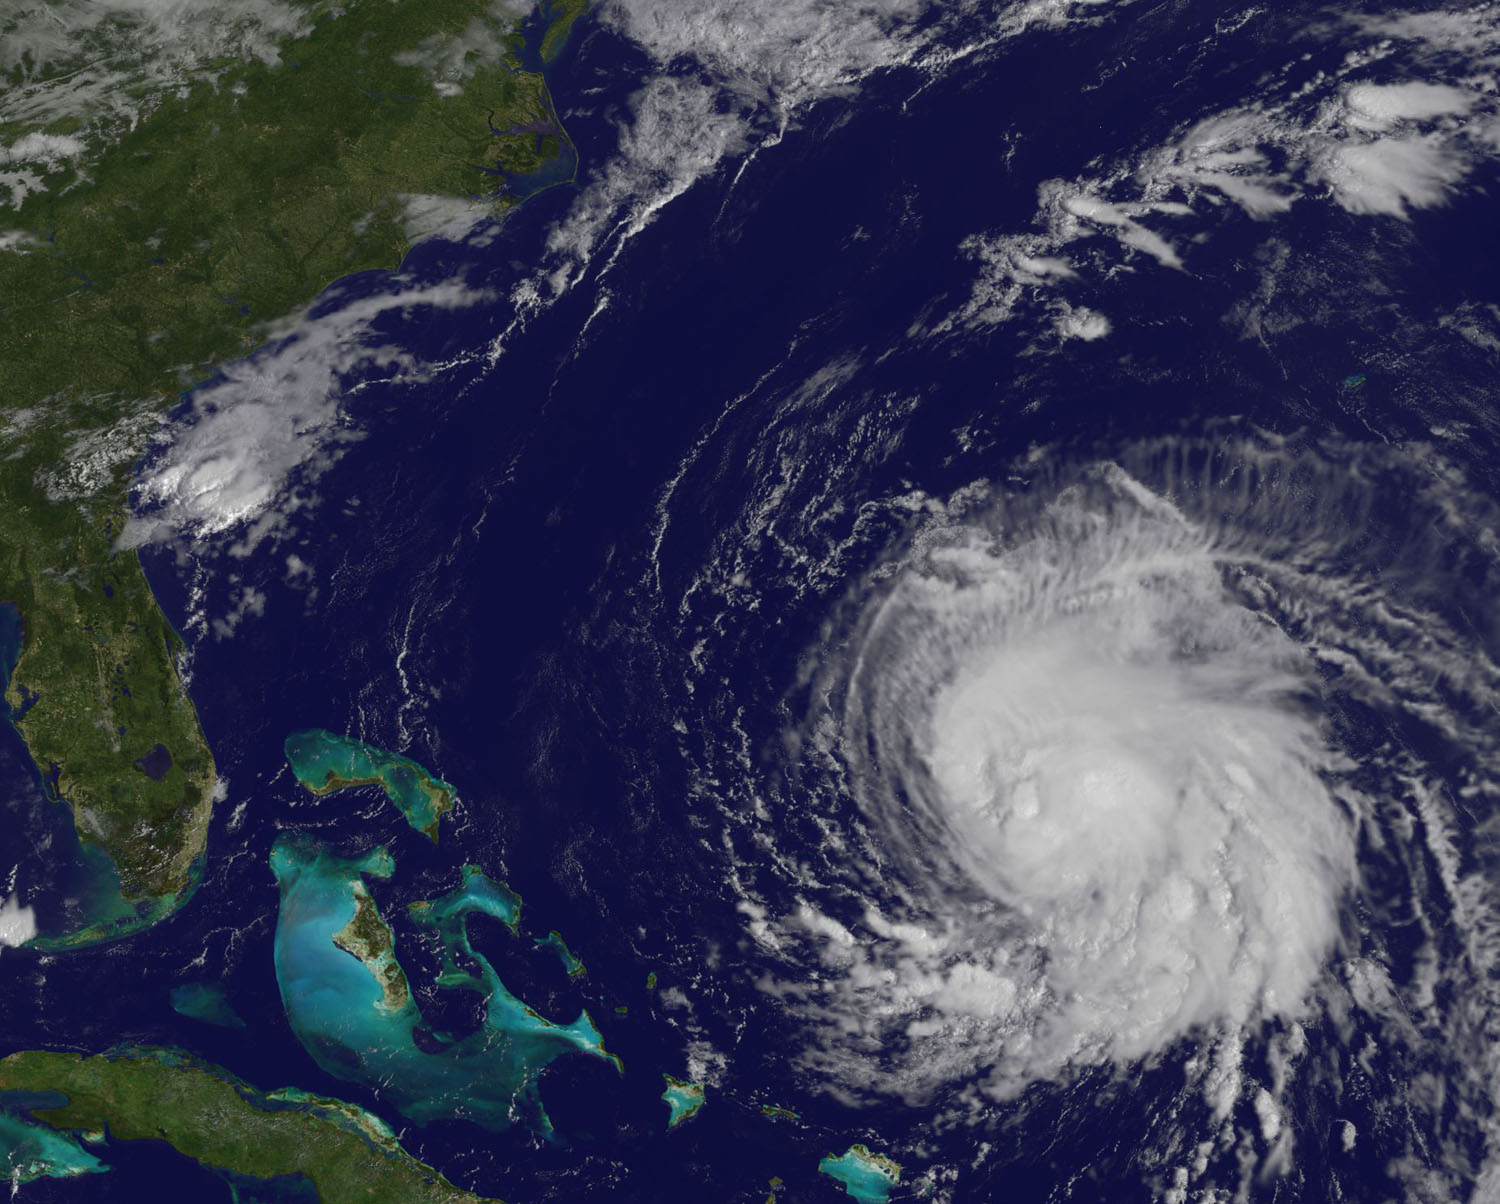
On Sept. 15, 2017 at 9:30 a.m. EDT (1330 UTC), NOAA’s GOES East satellite captured a visible image of the Tropical Storm Jose northwest of the Bahamas. NHC noted that Jose is showing signs of becoming better organized. The low-level center is embedded well within a growing central dense overcast.
The NASA/NOAA GOES Project at NASA’s Goddard Space Flight Center in Greenbelt, Maryland created an image. NOAA manages the GOES series of satellites and the NASA/NOAA GOES Project creates images and animations from the data.
At 5 a.m. EDT (0900 UTC) the center of Tropical Storm Jose was located near 25.9 degrees north latitude and 68.7 degrees west longitude. That’s about 360 miles (575 km) northeast of the southeastern Bahamas and about 500 miles (805 km) south-southwest of Bermuda.
Jose is moving toward the west-northwest near 8 mph (13 kph). The NHC forecast calls for a gradual turn toward the north on Sept. 15 and 16. The estimated minimum central pressure is 989 millibars.
Maximum sustained winds are near 70 mph (110 kph) with higher gusts. Some strengthening is forecast during the next 48 hours. Jose is forecast to become a hurricane later today.
NHC said “Swells generated by Jose are affecting Bermuda, the Bahamas, the northern coasts of Hispaniola and Puerto Rico, and the Southeast coast of the United States, and will spread northward along the Mid-Atlantic coast of the U.S. during the next few days. These swells are likely to cause life-threatening surf and rip current conditions.”
Forecasters caution that the track of Jose should be watched. Interests from North Carolina northward to New England on the east coast of the United States should monitor the progress of this system over the next several days.
For updates on Tropical Storm Jose, visit: www.nhc.noaa.gov.
Rob Gutro
NASA’s Goddard Space Flight Center
Sep. 14, 2017 – GPM Satellite Finds Sheared Hurricane Jose Has Very Tall Storms
The Global Precipitation Measurement mission or GPM core satellite analyzed Hurricane Jose and found some very tall, powerful thunderstorms within, despite still being battered by wind shear as it moves between Bermuda and the Bahamas.
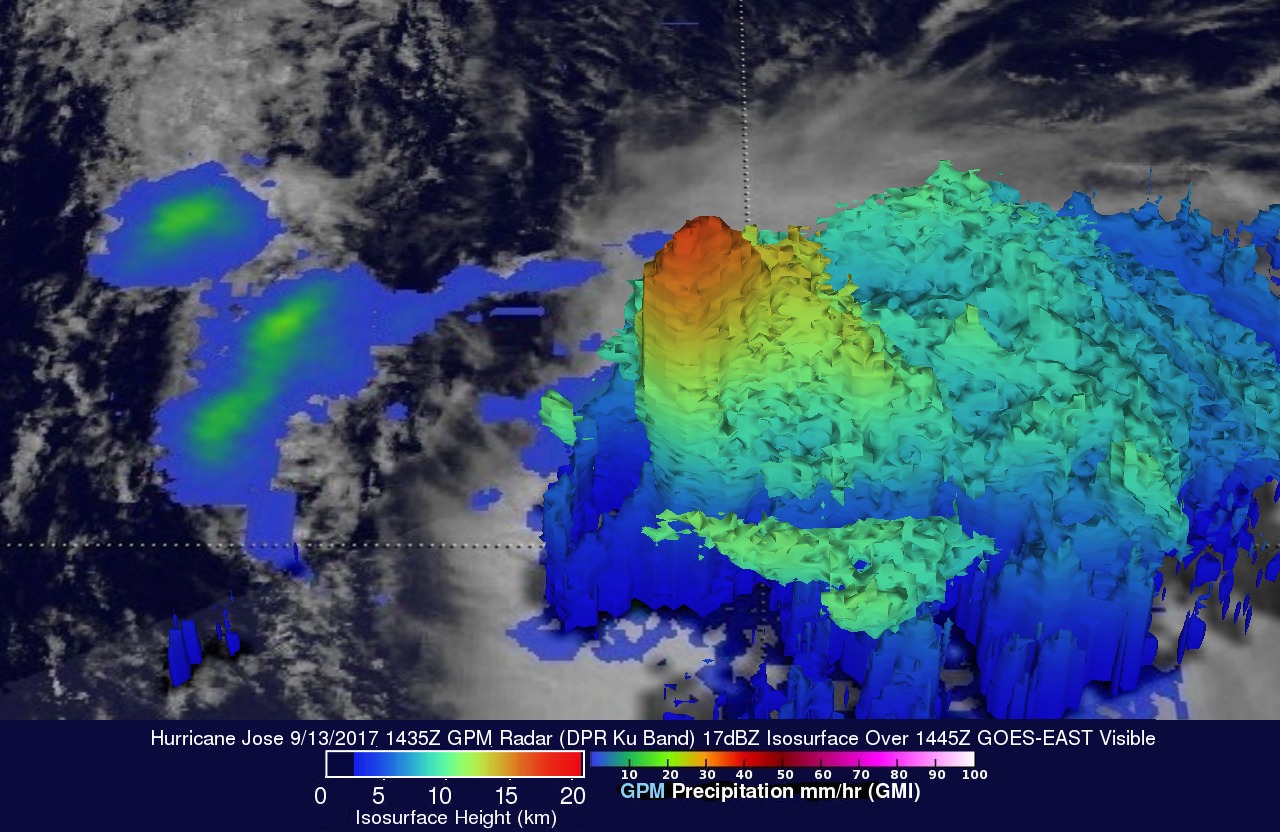
On Wednesday, Sept. 13 at 10:35 a.m. AST/EDT (1435 UTC) the GPM core observatory satellite traveled above persistent hurricane Jose as it was meandering in the Atlantic Ocean. GPM found that even though Jose was affected by strong northwesterly shear, it contained very powerful convective storms. GPM’s Dual-Frequency Precipitation Radar (DPR) found extremely intense downpours within these storms where rain was measured by DPR falling at a rate of over 8.9 inches (227 mm) per hour.
At NASA’s Goddard Space Flight Center in Greenbelt, Maryland, GPM’s radar (DPR Ku Band) was used to create a 3-D cross-section of the precipitation within hurricane Jose. This 3-D examination by DPR showed that some of the powerful convective storms within Jose had tops that were reaching altitudes greater than 10.85 miles (175 km). GPM is a joint mission of NASA and the Japan Aerospace Exploration Agency, JAXA.
NASA’s Aqua Satellite View
On Sept. 14 at 1:50 p.m. EDT (17:50 UTC) the Moderate Resolution Imaging Spectroradiometer aboard NASA’s Aqua satellite captured a visible image of Hurricane Jose that continued to show the storm was being affected by vertical wind shear as the storm appeared somewhat elongated from northwest to southeast.
Hurricane Jose’s Location on Sept. 14
At 5 a.m. AST/EDT (0900 UTC) on Thursday, September 14, 2017, the National Hurricane Center said the center of Hurricane Jose was located near 25.1 degrees north latitude and 66.5 degrees west longitude. That’s about 445 miles (715 km) east-northeast of the southeastern Bahamas and 510 miles (815 km) south-southwest of Bermuda. The estimated minimum central pressure is 986 millibars.
Jose was moving toward the west near 3 mph (6 kph). The National Hurricane Center said a turn toward the northwest with an increase in forward speed is expected later today, Sept. 14. Maximum sustained winds were near 75 mph (120 kph) with higher gusts. Little change in strength is forecast during the several days, but Jose could weaken to a Tropical Storm by Friday.
Credits: NASA/JAXA, Hal Pierce
Jose Generating Dangerous Ocean Conditions Along the U.S.
The National Hurricane Center (NHC) cautioned that “swells generated by Jose are affecting Bermuda, the Bahamas, the northern coasts of Hispaniola and Puerto Rico, and the Southeast coast of the United States, and will spread northward along the Mid-Atlantic coast of the U.S. during the next few days. These swells are likely to cause life-threatening surf and rip current conditions.”
The NHC predicts that Jose will remain far from land over the open waters of the Atlantic Ocean. Track models show a looping motion during the next couple day and that is followed by a turn toward the North Atlantic.
For updated forecasts on Jose, visit: www.nhc.noaa.gov
Rob Gutro
NASA’s Goddard Space Flight Center
Sep. 14, 2017 – (Update #1) Satellite Animation Shows Irma’s Remnants and Hurricane Jose
Credits: NASA-NOAA GOES Project
Sep. 13, 2017 – NASA Sees Hurricane Jose In Between Bahamas and Bermuda
NASA’s Terra satellite is one of many satellites keeping a close eye on Hurricane Jose and saw the storm between the Bahamas and Bermuda.
On Sept. 12 at 1:35 p.m. EDT (15:35 UTC) the Moderate Resolution Imaging Spectroradiometer (MODIS) instrument aboard NASA’s Terra satellite captured a visible image of Hurricane Jose. In the image, Jose appeared somewhat elongated as a result of vertical wind shear affecting the storm.
At 5 a.m. AST/EDT (0900 UTC), the center of Hurricane Jose was located near 26.1 degrees north latitude and 66.0 degrees west longitude. That’s about 505 miles (810 Km) east-northeast of the southeastern Bahamas and 435 miles (700 km) south of Bermuda. Jose was moving toward the southeast near 8 mph (13 km/h), but it is expected to make a slow clockwise loop during the next 36 to 48 hours, moving west-northwestward by late Thursday, Sept. 14. Maximum sustained winds are near 75 mph (120 kph) with higher gusts. Little change in strength is forecast during the next 48 hours. The estimated minimum central pressure is 985 millibars.
Credits: NASA-NOAA GOES Project
An animation of NOAA’s GOES East satellite imagery from Sept. 11 at 8:15 a.m. EDT (1215 UTC) to Sept. 13 ending at 8:30 a.m. EDT (1230 UTC) was created by the NASA/NOAA GOES Project at NASA’s Goddard Space Flight Center in Greenbelt, Maryland. NOAA manages the GOES series of satellites and NASA/NOAA GOES Project uses the data to create images and animations.
The animation showed Hurricane Jose as it continued making a loop in the Atlantic Ocean between Bermuda and the Bahamas and Post-Tropical Cyclone Irma moved north and weakened to a remnant low pressure area centered over southeastern Missouri.
National Hurricane Center forecaster Jack Beven said that Jose continues to be affected by 20-25 knots of northerly vertical wind shear, and a recent overpass from the GMI instrument aboard NASA/JAXA’s Global Precipitation Measurement mission core satellite shows that the low-level center is at the northern edge of the large area of thunderstorms.
For updates on Jose, visit: www.nhc.noaa.gov
Rob Gutro
NASA’s Goddard Space Flight Center
Sep. 12, 2017 – (Update #2) NASA Satellites Find Wind Shear Affecting Hurricane Jose
Vertical wind shear is weakening Hurricane Jose as it makes a cyclonic loop in the western Atlantic Ocean. NASA’s Aqua satellite provided an image of Jose that shows the hurricane had become asymmetrical because winds were pushing the clouds away from the center of circulation and the GPM Satellite saw the strongest rainfall in Jose southeast of the center.
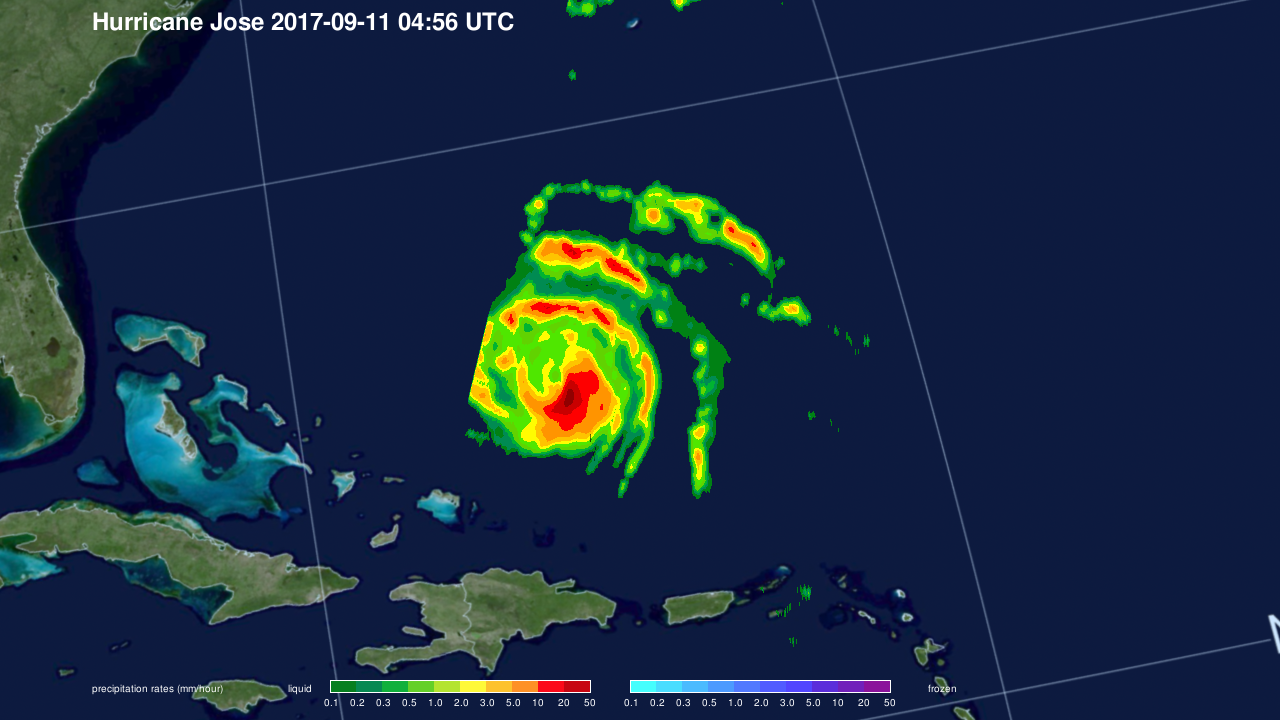
The Global Precipitation Measurement mission or GPM core satellite passed over Hurricane Jose early on Sept. 11. Rainfall data gathered by GPM at 12:56 a.m. EDT (0456 UTC) showed the heaviest rainfall occurring within Jose was located in the southeastern quadrant. Rainfall rates were near 50 mm per hour (2 inches/hour).
The Moderate Resolution Imaging Spectroradiometer aboard NASA’s Aqua satellite provided a visible light image of Hurricane Jose on Sept. 11 at 2:15 p.m. EDT (18:05 UTC). Jose had weakened and appeared somewhat elongated because of wind shear from the north.
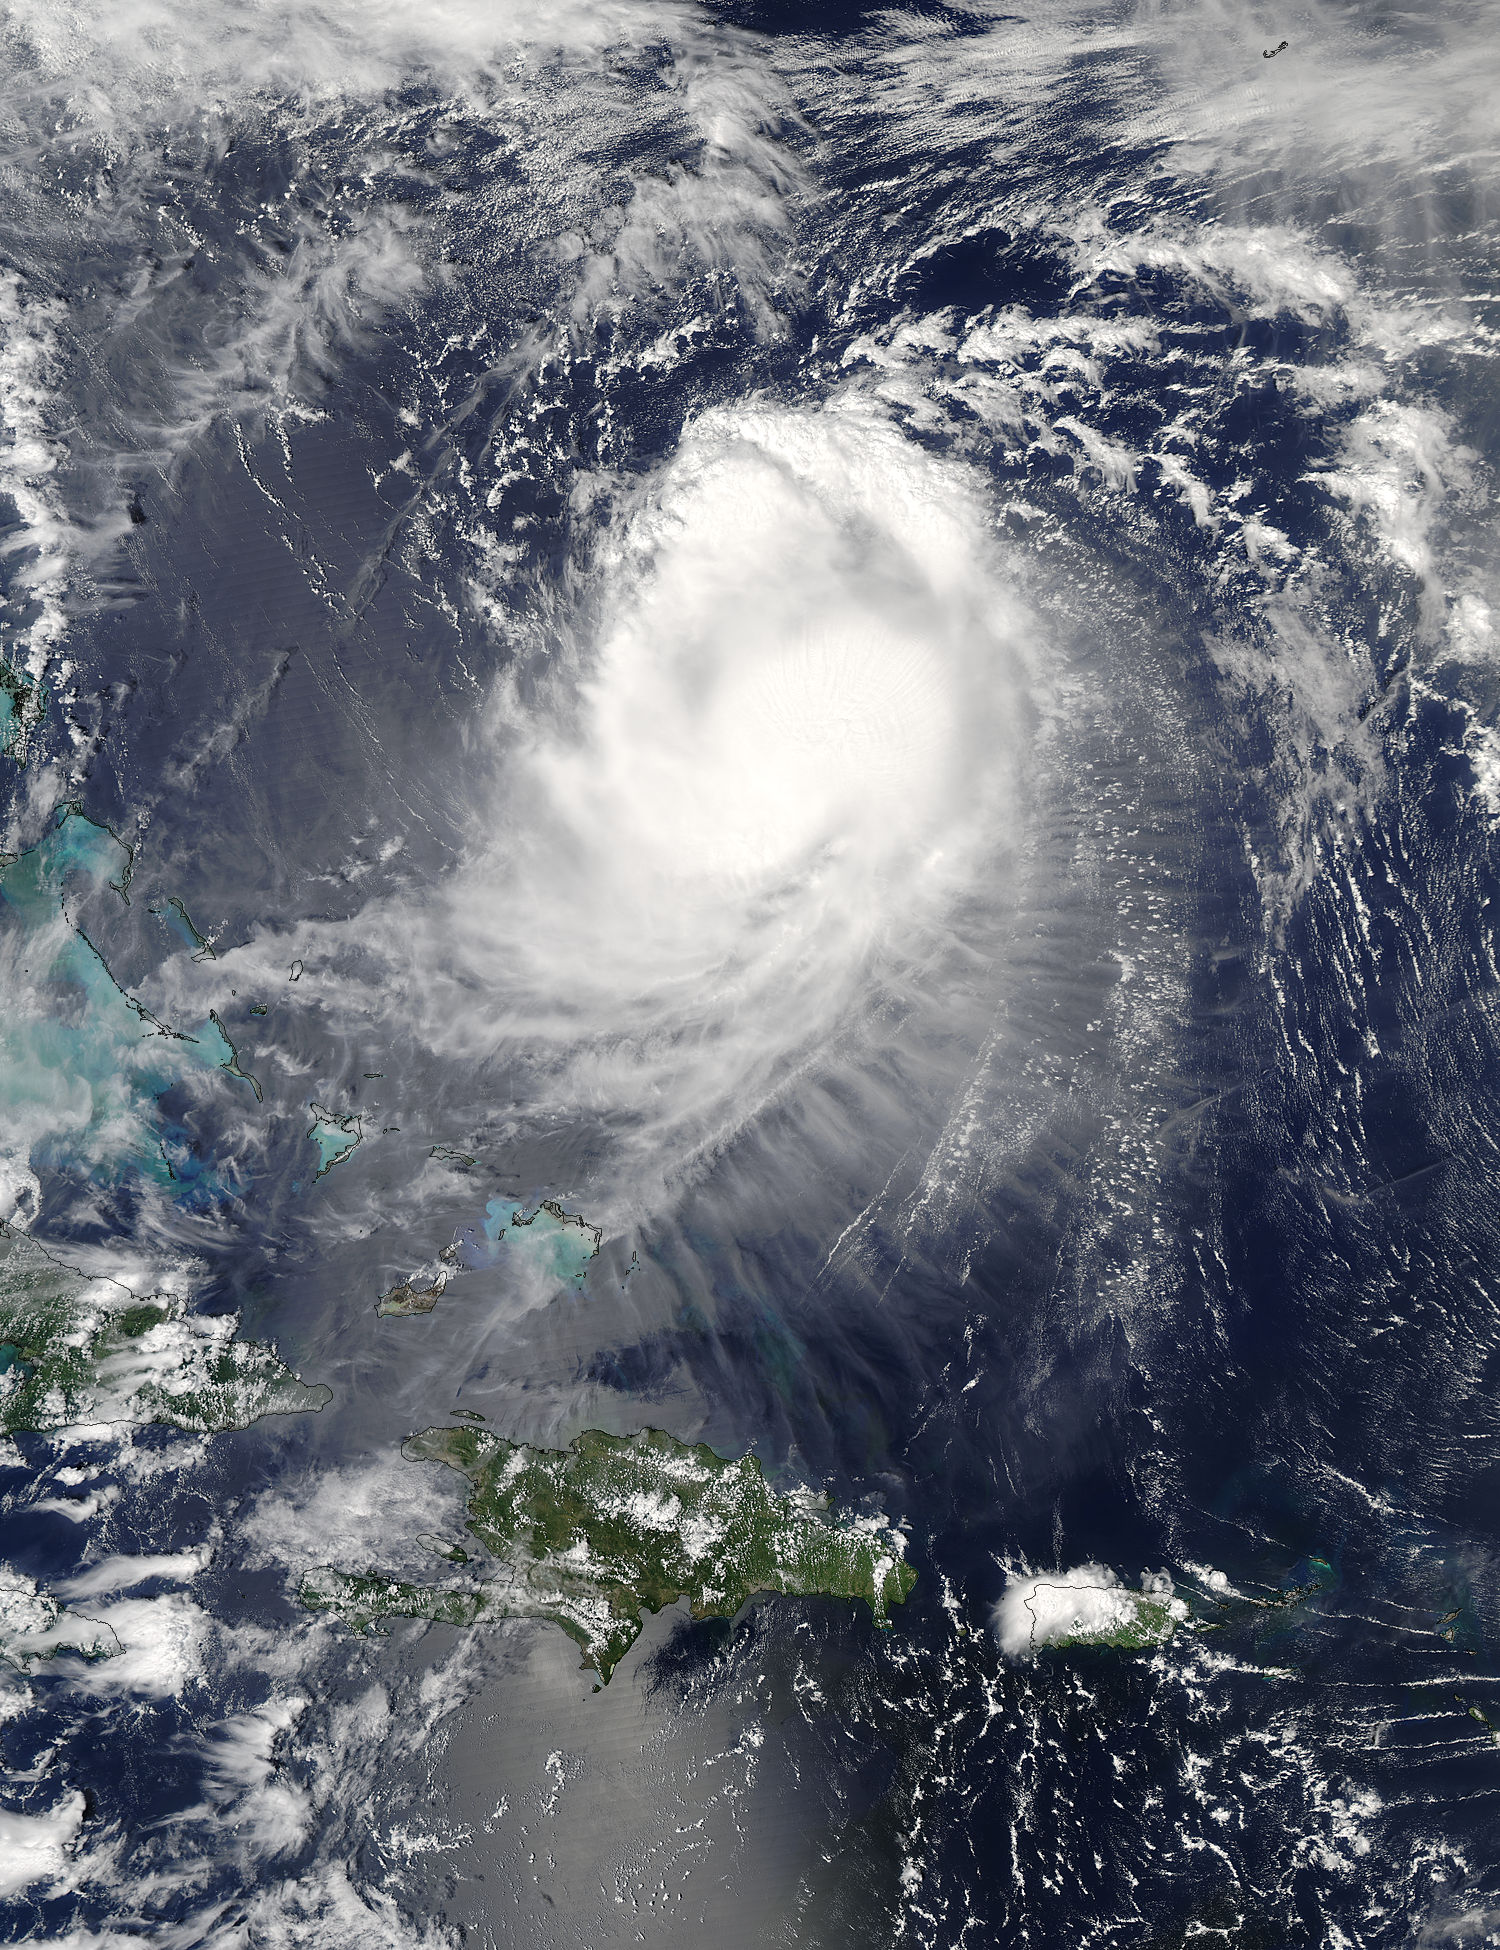
On Sept. 12, the National Hurricane Center (NHC) noted that “Jose continues to be affected by 20 knots of northerly vertical shear, and recent microwave imagery shows that the low-level center is to the northeast or north of a large burst of convection that shows little evidence of banding.”
Jose remains far from land areas, so there are no coastal watches or warnings in effect.
At 5 a.m. AST/EDT (0900 UTC), the center of Hurricane Jose was located near 27.5 north latitude and 69.0 west longitude, about 435 miles (700 km) north-northeast of Grand Turk Island. Jose was moving toward the east near 6 mph (9 kph) and this motion is expected to continue today.
Maximum sustained winds have decreased to near 75 mph (120 kph) with higher gusts. Some additional weakening is possible during the next day or so, and Jose could weaken to a tropical storm later today. The estimated minimum central pressure is 987 millibars.
Jose continued on its loop in the Atlantic Ocean. The NHC said turn toward the southeast is expected tonight, followed by a turn toward the southwest by Wednesday, Sept. 13.
For updated forecasts on Jose, visit: www.nhc.noaa.gov
Rob Gutro
NASA’s Goddard Space Flight Center
Sep. 12, 2017 – (Update #1) Satellite Animation Sees Post Tropical Cyclone Irma and Hurricane Jose
Credits: NASA-NOAA GOES Project
Sep. 11, 2017 – NASA Analyzes Hurricane Jose’s Hidden Cloud-Filled Eye
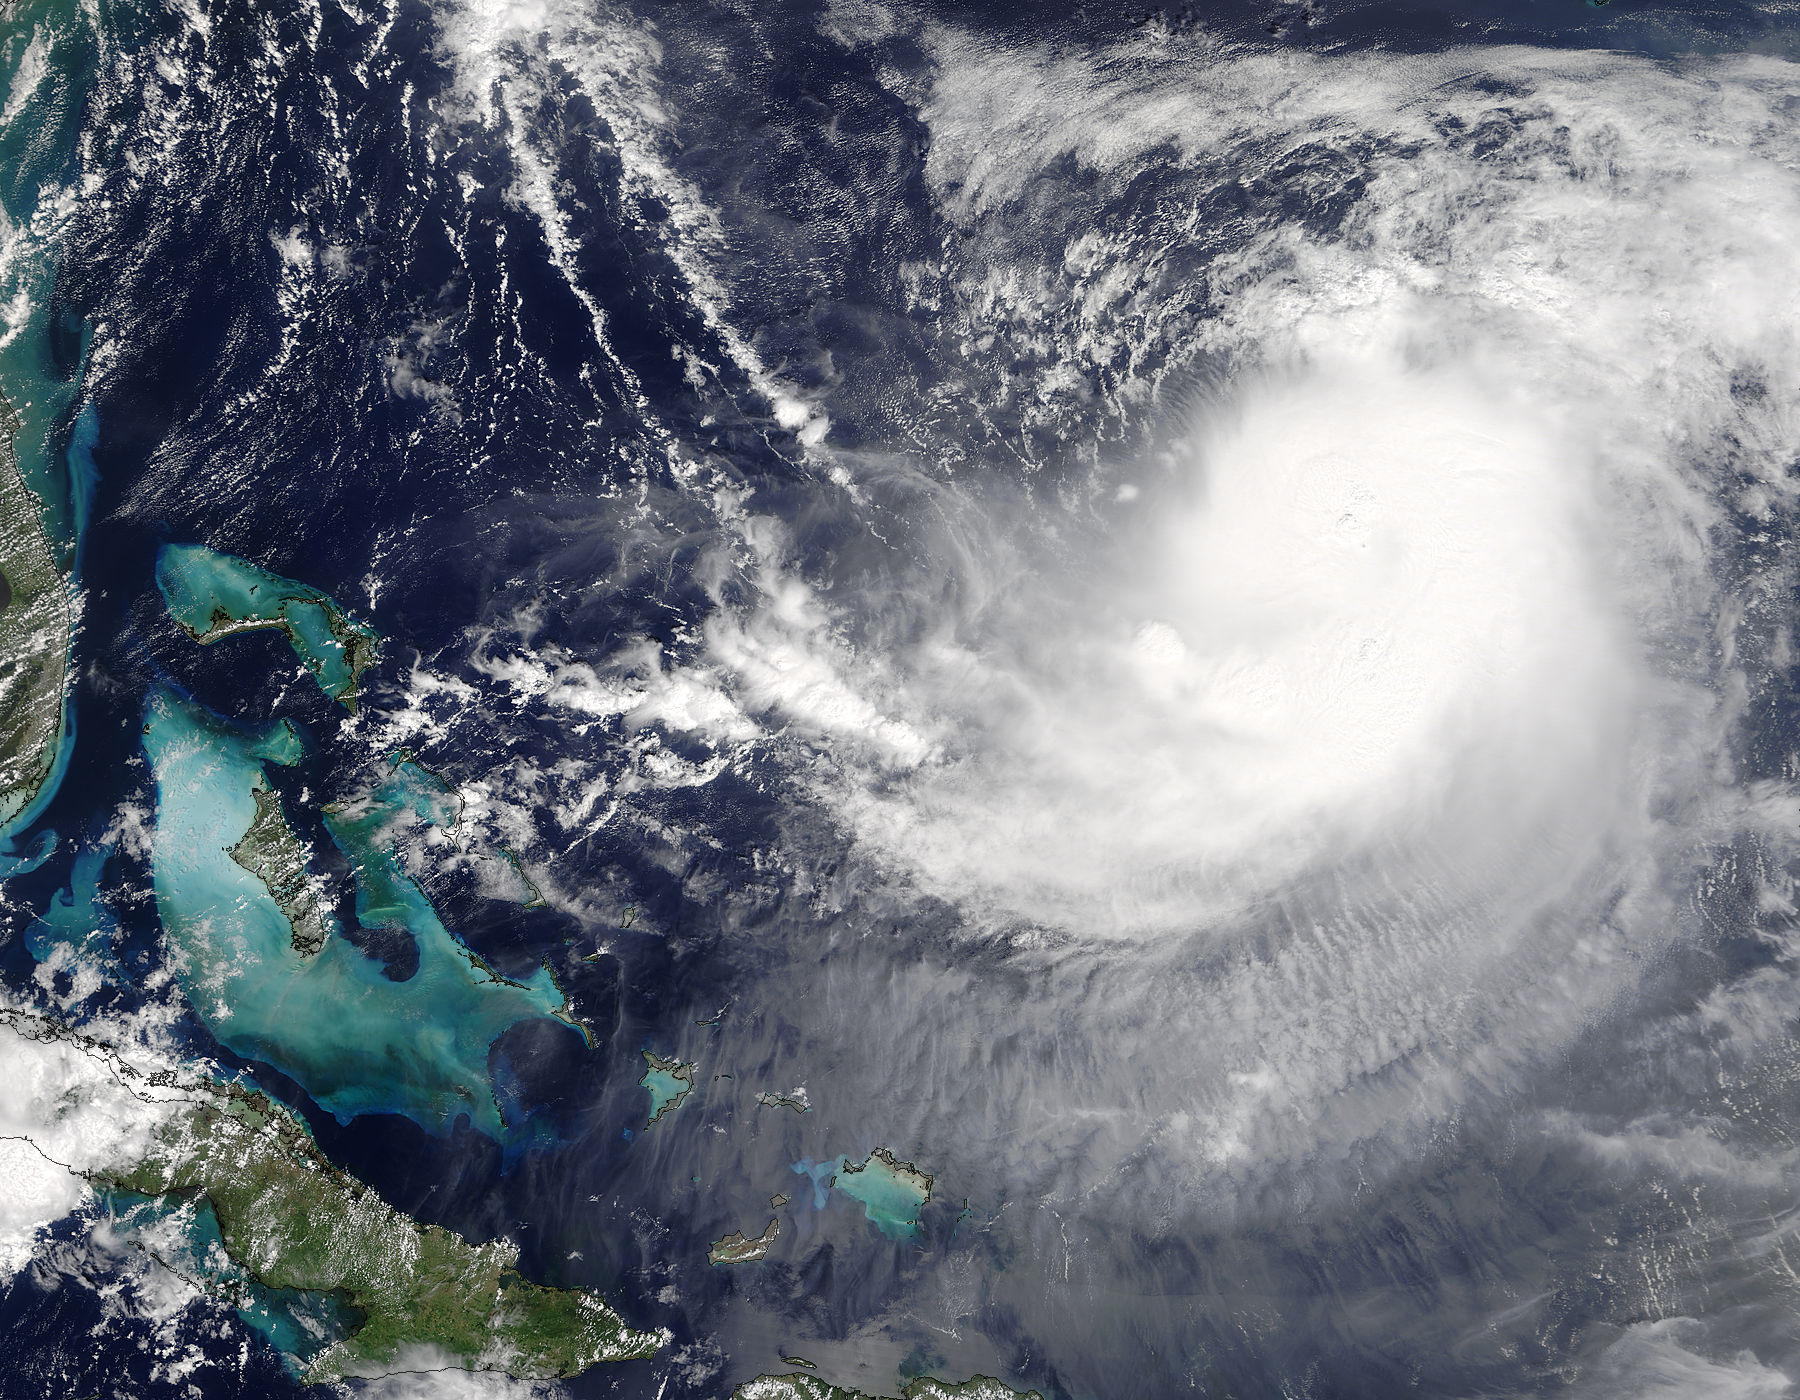
NASA satellite imagery provided a couple of views of Hurricane Jose’s cloud-filled eye allowing forecasters to see that it still existed. NASA-NOAA’s Suomi NPP satellite provided a visible look at the storm, while the GPM satellite provided a deeper look under the high clouds that were covering the eye.
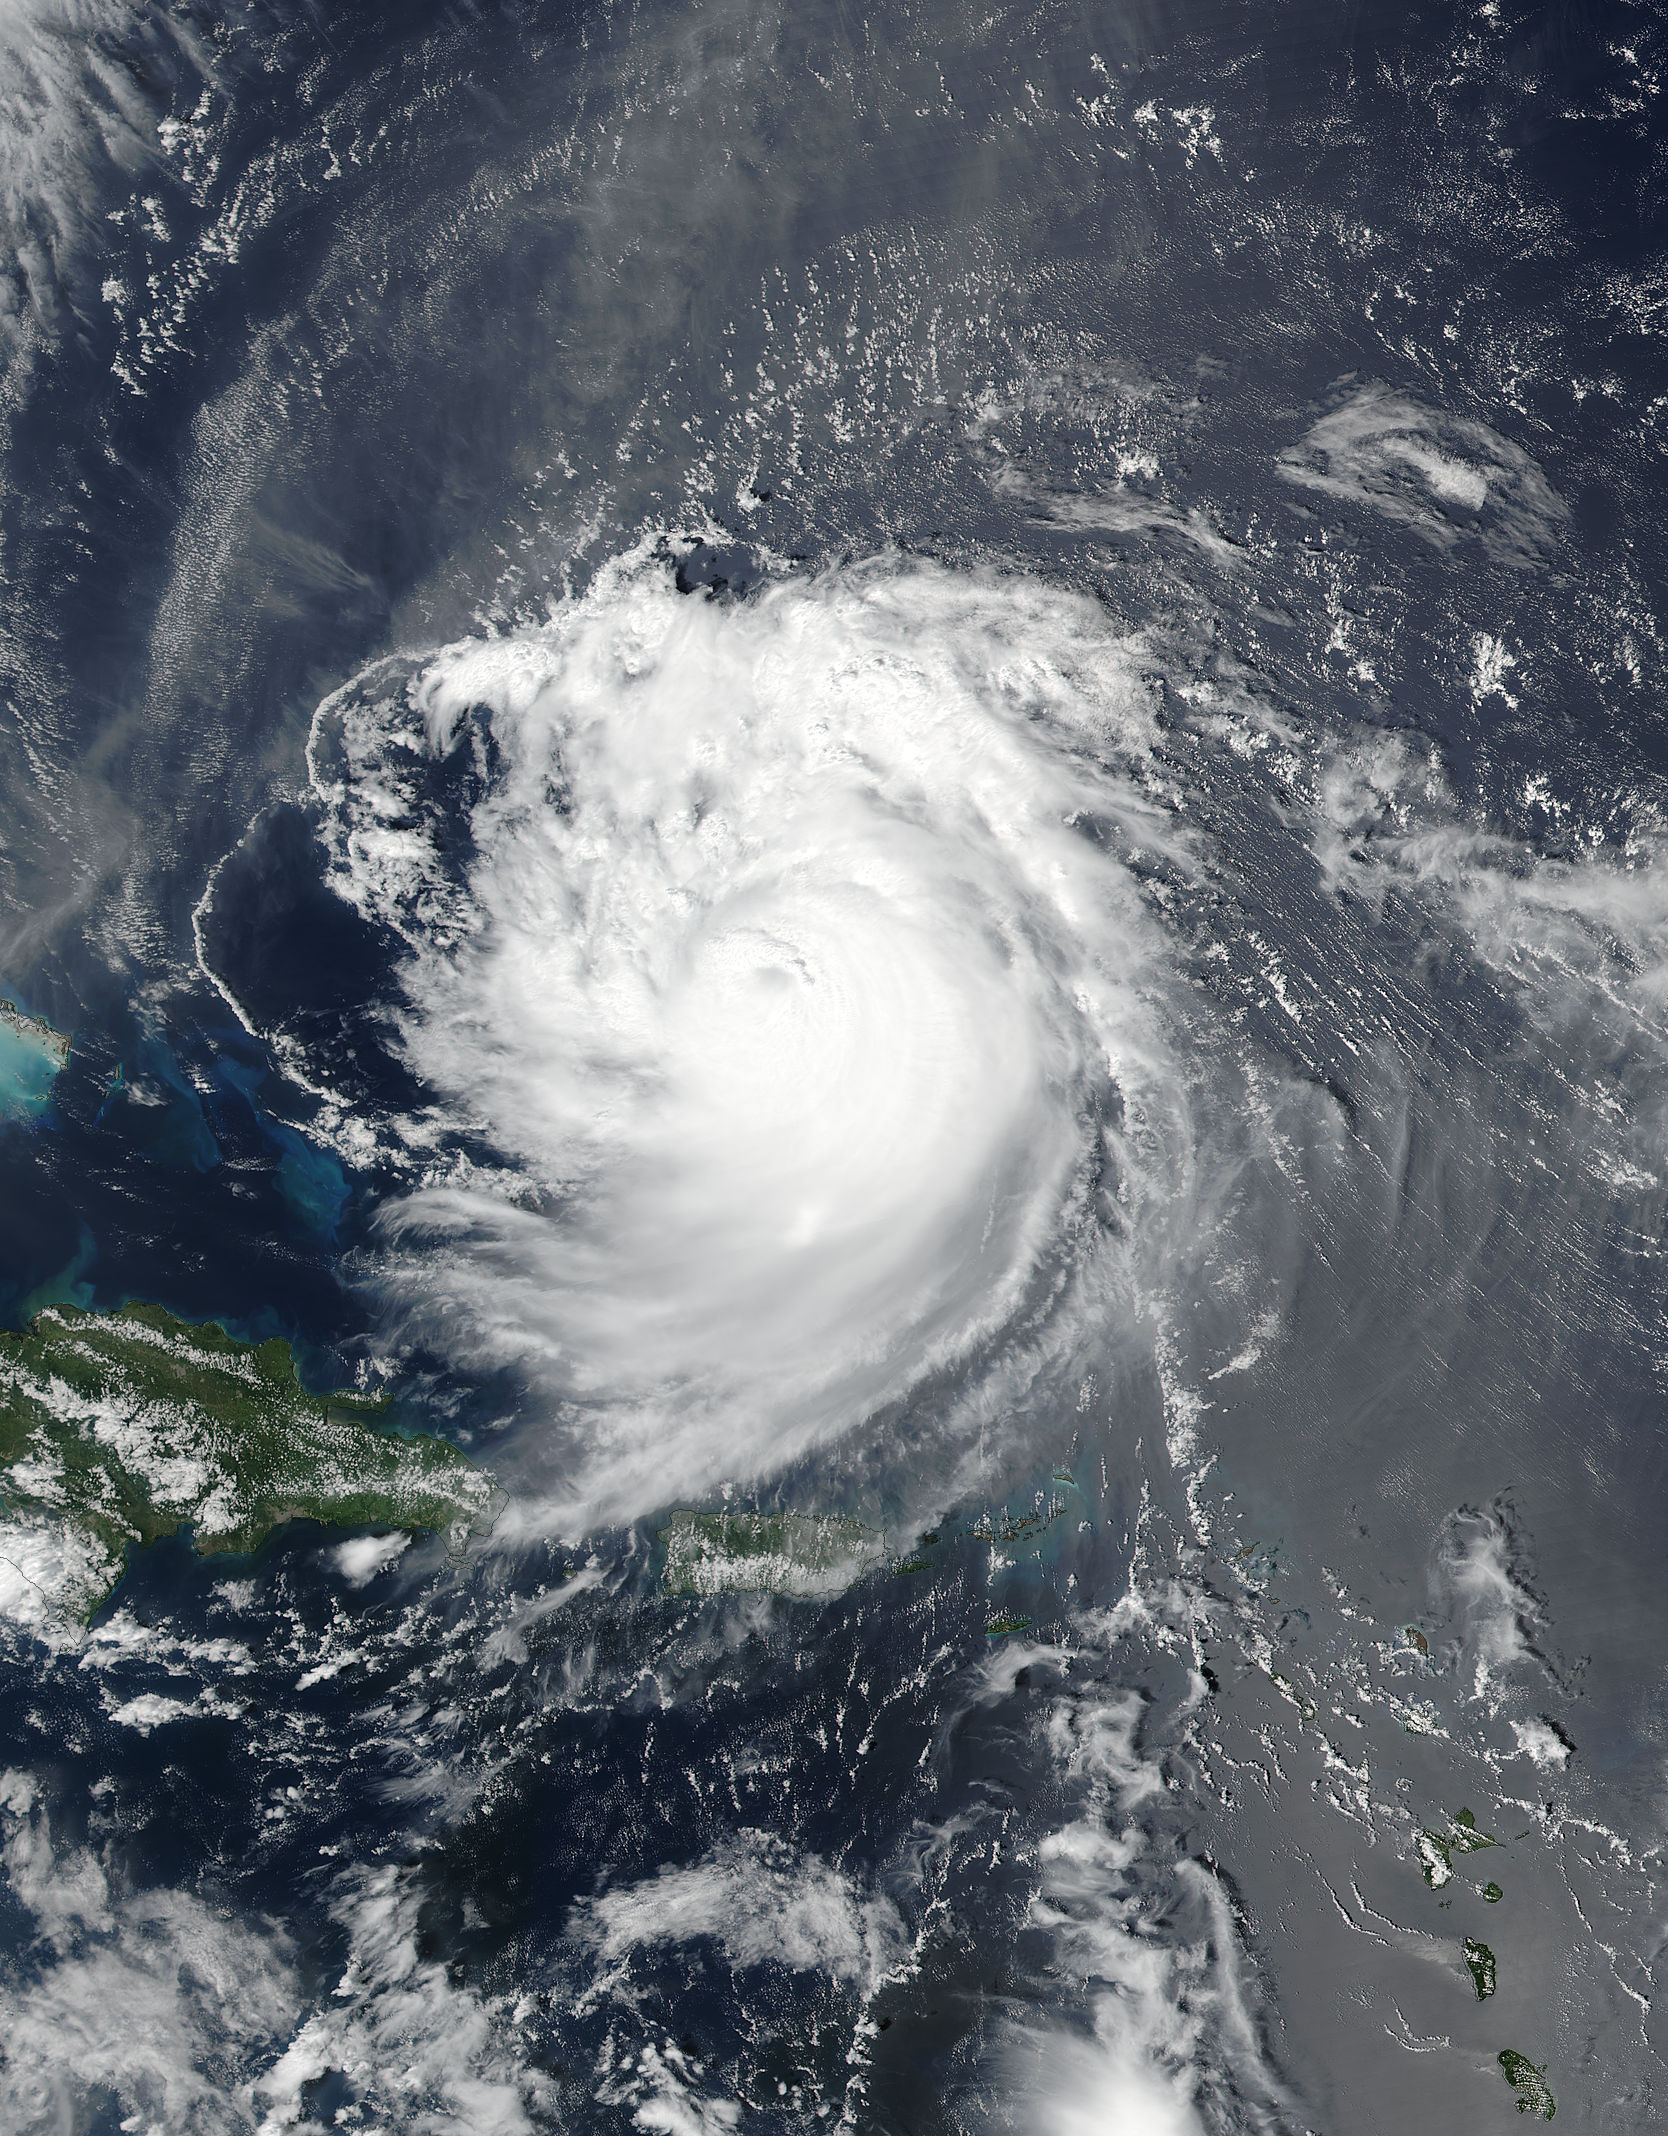
The Visible Infrared Imaging Radiometer Suite (VIIRS) instrument aboard NASA-NOAA’s Suomi NPP satellite provided a visible image of Hurricane Jose and showed that the eye had become cloud-filled eye on Sept. 10 at 1:12 p.m. EDT (1712 UTC).
On Sept. 11, the National Hurricane Center (NHC) noted “although Jose’s satellite appearance is somewhat degraded due to the effects of northeasterly shear estimated to be near 25 knots it has been able to maintain persistent deep convection over the center.”
NASA and the Japan Aerospace Exploration Agency’s Global Precipitation Measurement mission (GPM) core satellite got a closer look at what was happening with the eye. On Sept. 11 at 12:56 a.m. EDT (0456 UTC) the National Hurricane Center said, “A GPM overpass helped to confirm that the center was on the north side of the cold cloud tops while also highlighting that an eye feature persists despite being obscured in conventional imagery.”
A Temperature Check on Jose’s Clouds
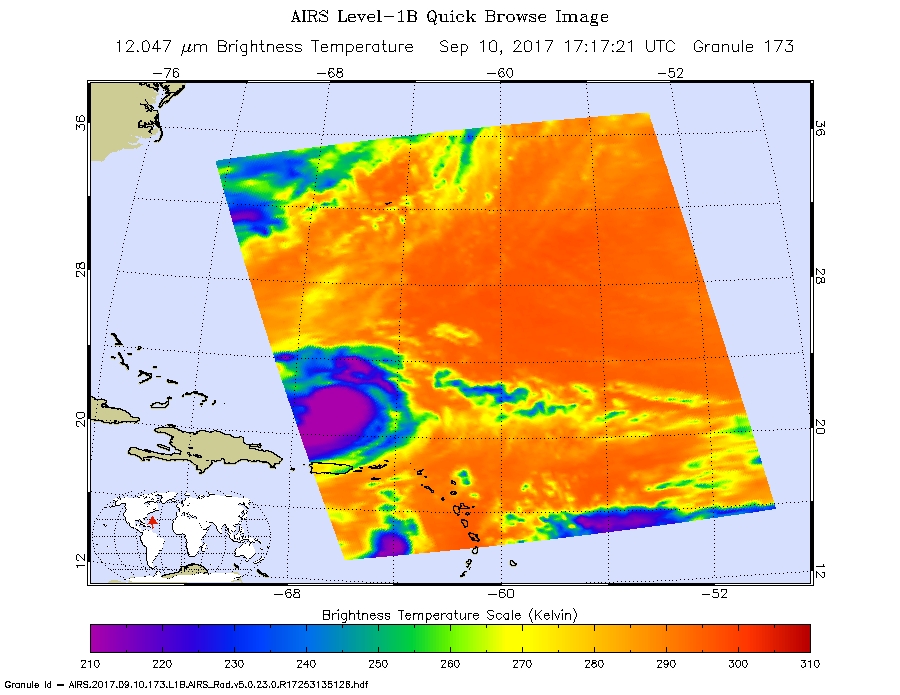
On the previous day, NASA’s Aqua satellite also provided another view of the storm, measuring cloud top temperatures of clouds around and extending outward from the eye. The Atmospheric Infrared Sounder or AIRS instrument aboard NASA’s Aqua satellite analyzed the storm in infrared light. Infrared light provides scientists with temperature data and that’s important when trying to understand how strong storms can be. The higher the cloud tops, the colder and the stronger they are. So infrared light as that gathered by the AIRS instrument can identify the strongest sides of a tropical cyclone.
When NASA’s Aqua satellite flew over Jose on Sept. 10 at 1:17 p.m. EDT (1717 UTC) AIRS detected strong thunderstorms around the eye as well as bands northeast and southeast of the center. Cloud top temperatures in those three areas were as cold as minus 63 degrees Fahrenheit (minus 53 degrees Celsius). Storms with cloud top temperatures that cold have the capability to produce heavy rainfall.
Jose’s Location on Sept. 11
A 5 a.m. AST/EDT (0900 UTC) on Sept. 11, the center of Hurricane Jose was located near 24.4 degrees north latitude and 68.6 degrees west longitude. That’s about 305 miles (490 km) north-northeast of Grand Turk Island.
Jose was moving toward the north-northwest near 10 mph (17 kph), and a turn toward the northeast is expected by tonight, with a reduction in forward speed. Jose is then expected to move slowly toward the east and southeast Tuesday into Wednesday, making a loop.
Maximum sustained winds were near 105 mph (165 kph) with higher gusts. Steady weakening is forecast during the next 48 hours. Hurricane-force winds extend outward up to 25 miles (35 km) from the center and tropical-storm-force winds extend outward up to 150 miles (240 km). The estimated minimum central pressure is 968 millibars.
For updates on Jose, visit: www.nhc.noaa.gov.
Rob Gutro
NASA’s Goddard Space Flight Center
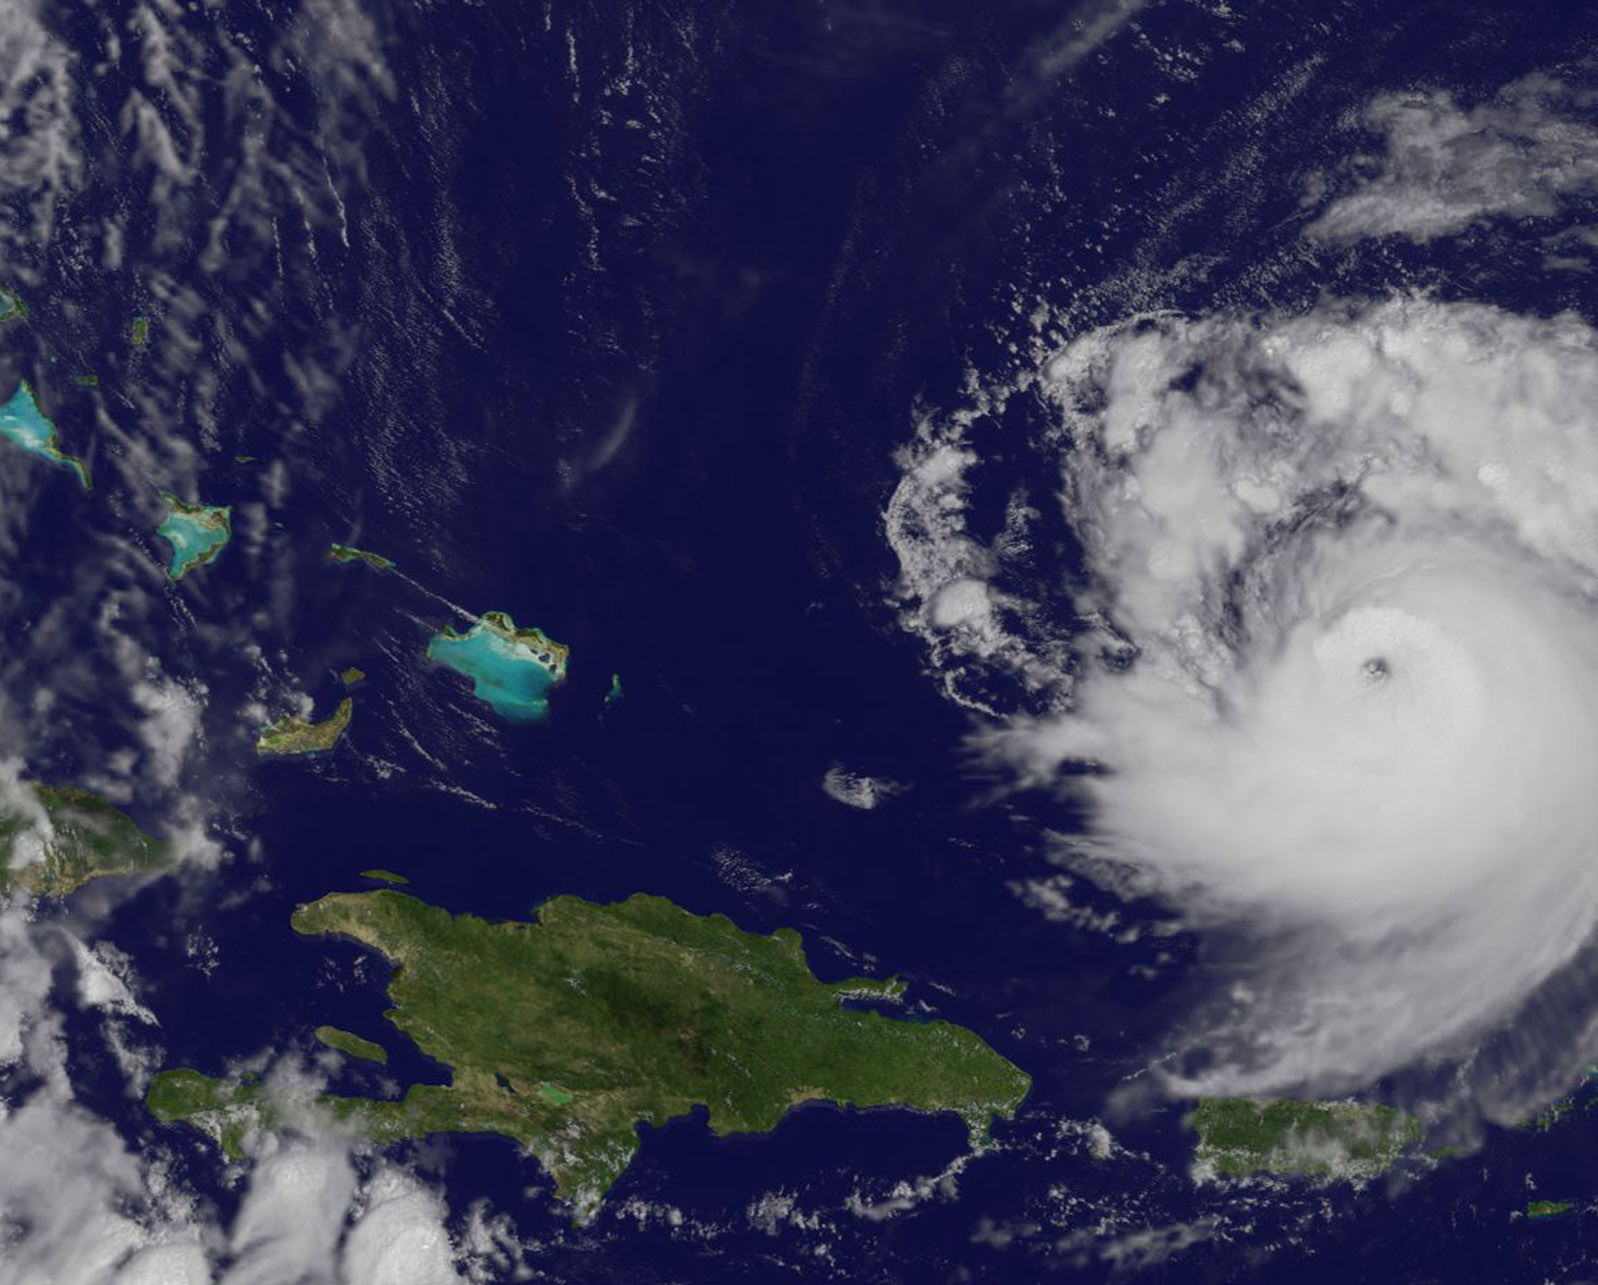
Sep. 10, 2017 – NASA Sees Hurricane Jose Move Past the Leeward Islands
Hurricane Jose moved past the Leeward Islands and well north of Puerto Rico on Sept. 10 as satellites continued providing data to forecasters.
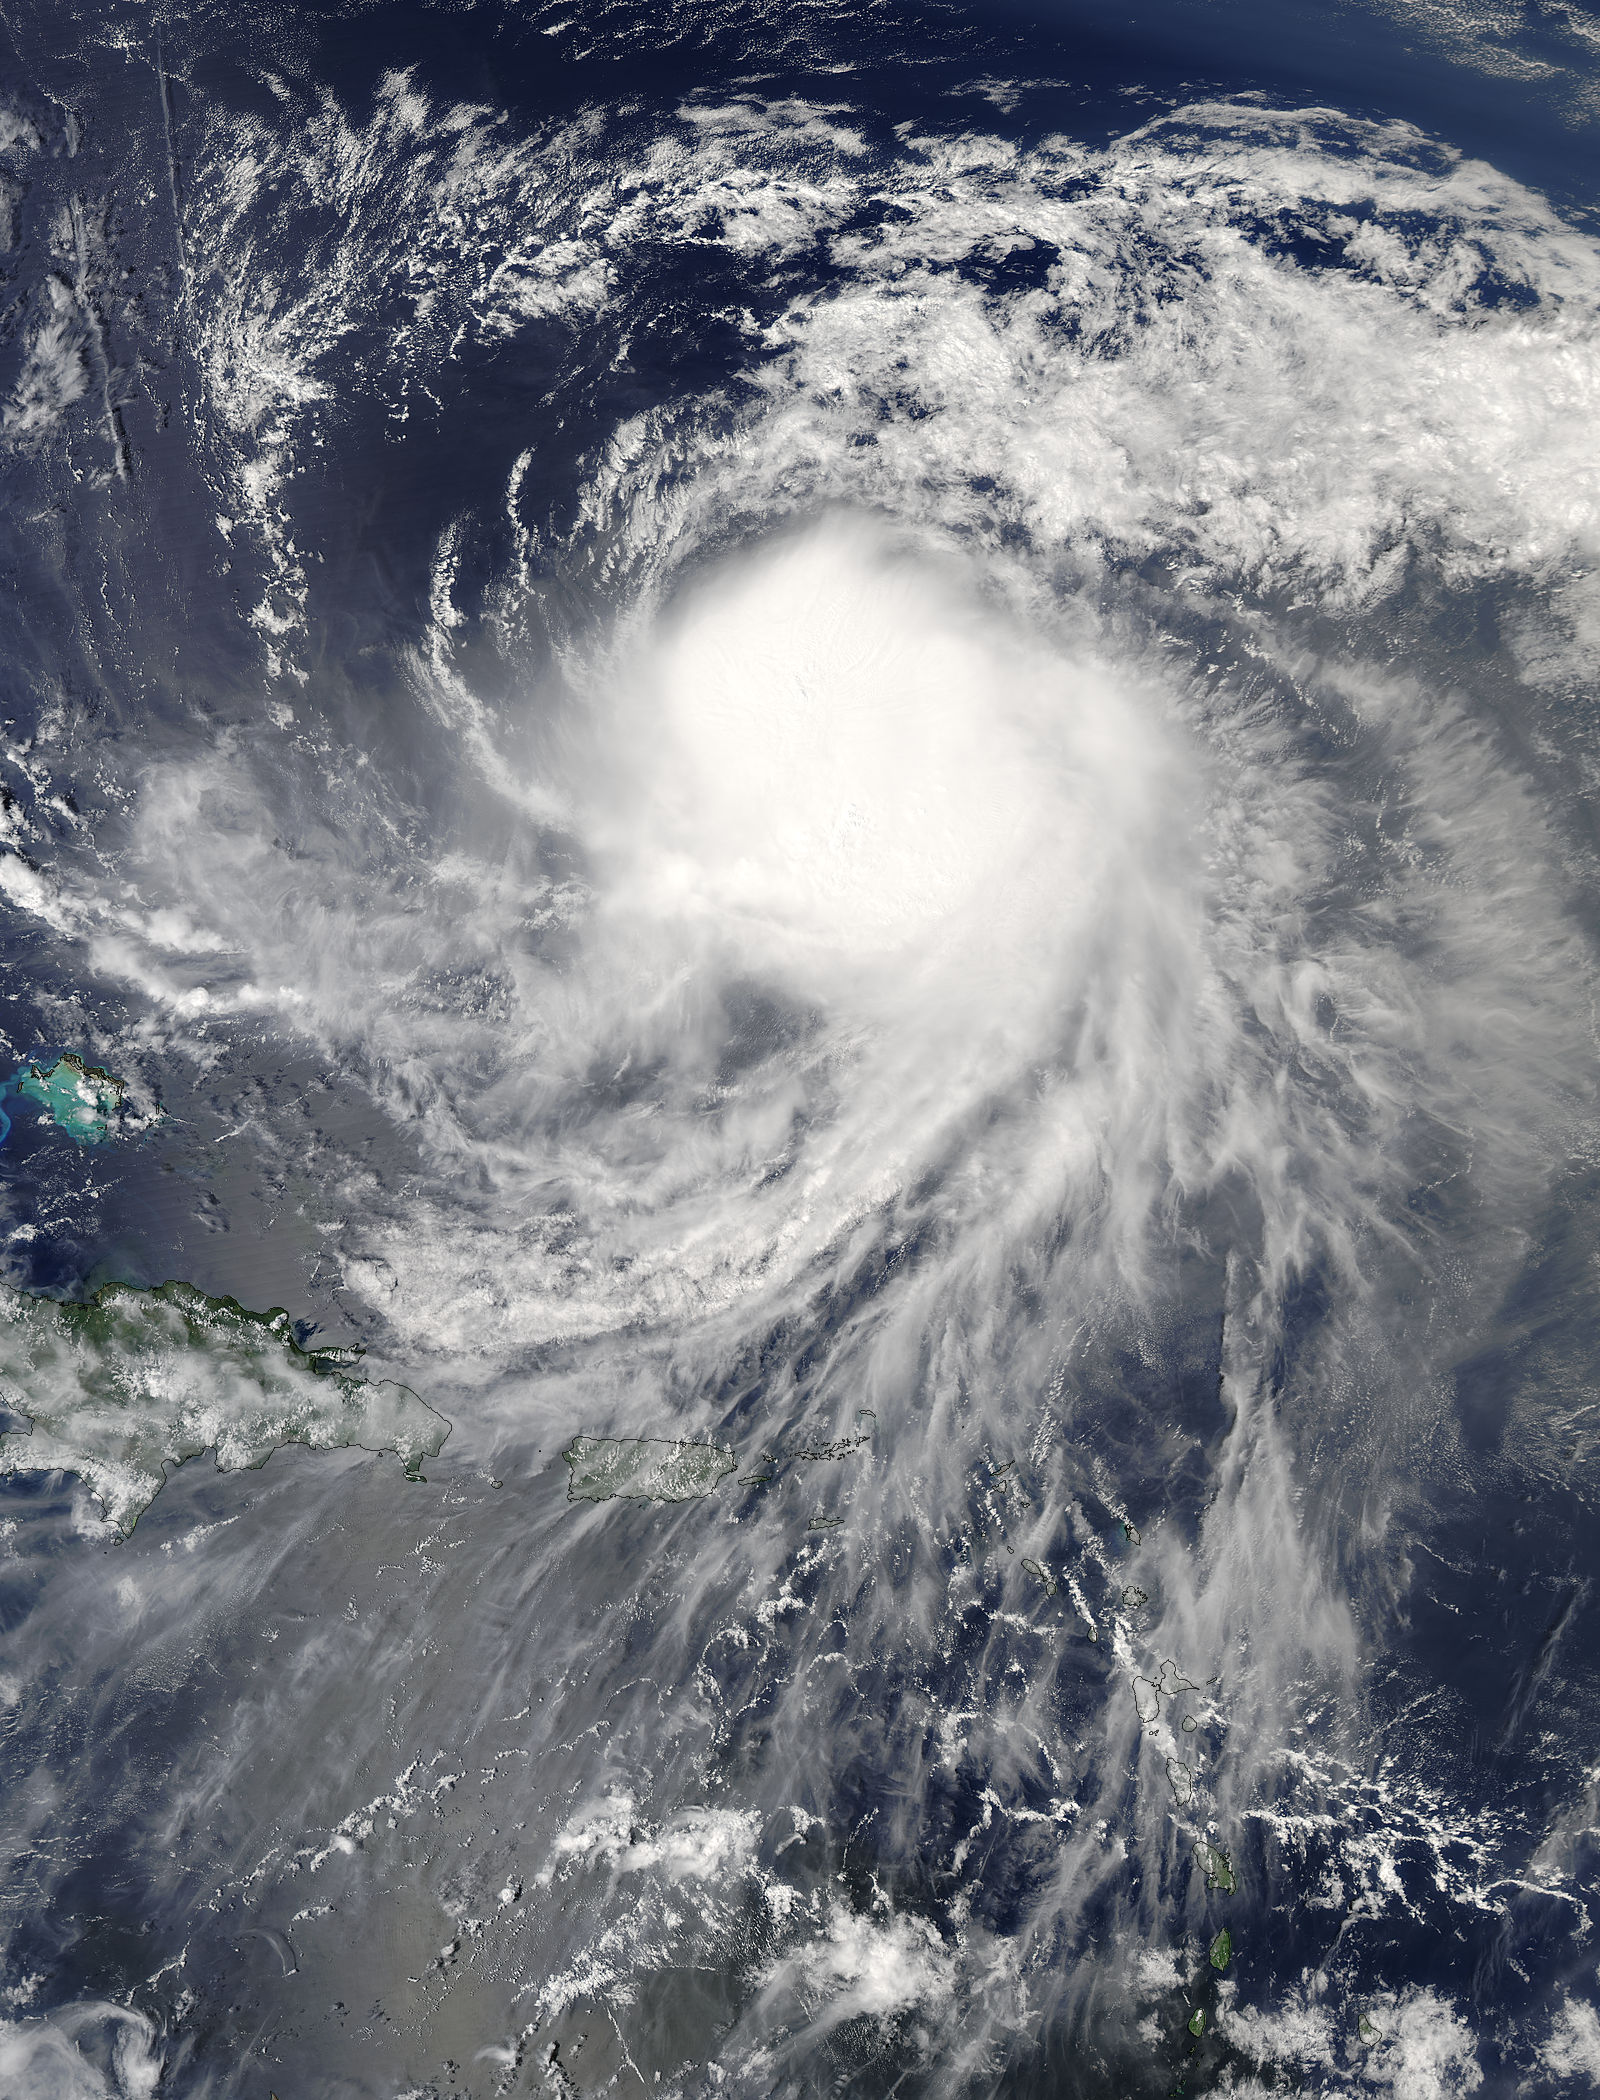
On Sept. 9 at 3:30 p.m. EDT (1730 UTC) the Visible Infrared Imaging Radiometer Suite (VIIRS) instrument aboard NASA-NOAA’s Suomi NPP satellite captured a visible image of Hurricane Jose over the Leeward Islands. The eye of the storm was visible and surrounded by powerful thunderstorms.
At 8 a.m. AST/EDT (1200 UTC), the eye of Hurricane Jose was located near 21.2 degrees north latitude and 65.3 degrees longitude, about 250 miles (400 km) north-northwest of the Northern Leeward lslands. The National Hurricane Center said “Jose is moving toward the northwest near 16 mph (26 km/h) and this general motion is expected to continue over the next 24 hours. A slower forward motion is expected later Monday into Tuesday as Jose begins to make a turn toward the north.
Maximum sustained winds are near 130 mph (215 kph) with higher gusts. Jose is a category 4 hurricane on the Saffir-Simpson Hurricane Wind Scale. Gradual weakening is forecast during the next couple of days. Hurricane-force winds extend outward up to 40 miles (65 km) from the center and tropical-storm-force winds extend outward up to 160 miles (260 km). The estimated minimum central pressure is 944 millibars.
On Sept.10 at 9 a.m. EDT there were no coastal watches or warnings in effect. The government of France has discontinued the Tropical Storm Warning for St. Martin and St. Barthelemy. The government of Saint Maarten has discontinued the Tropical Storm Warning for Saint Maarten.
At 10:30 a.m. EDT (1430 UTC) NOAA’s GOES East satellite captured an image of Hurricane Jose and the eye was located about 250 miles north-northwest of the northern Leeward Islands. The GOES image showed Jose had a 15 nautical-mile-wide eye that continued to be surrounded a solid ring of deep convection.
The 5-day forecast that shows Jose making a small anticyclonic loop over the open waters of the western Atlantic.
For updated forecasts on Jose, visit: www.nhc.noaa.gov
Rob Gutro
NASA’s Goddard Space Flight Center
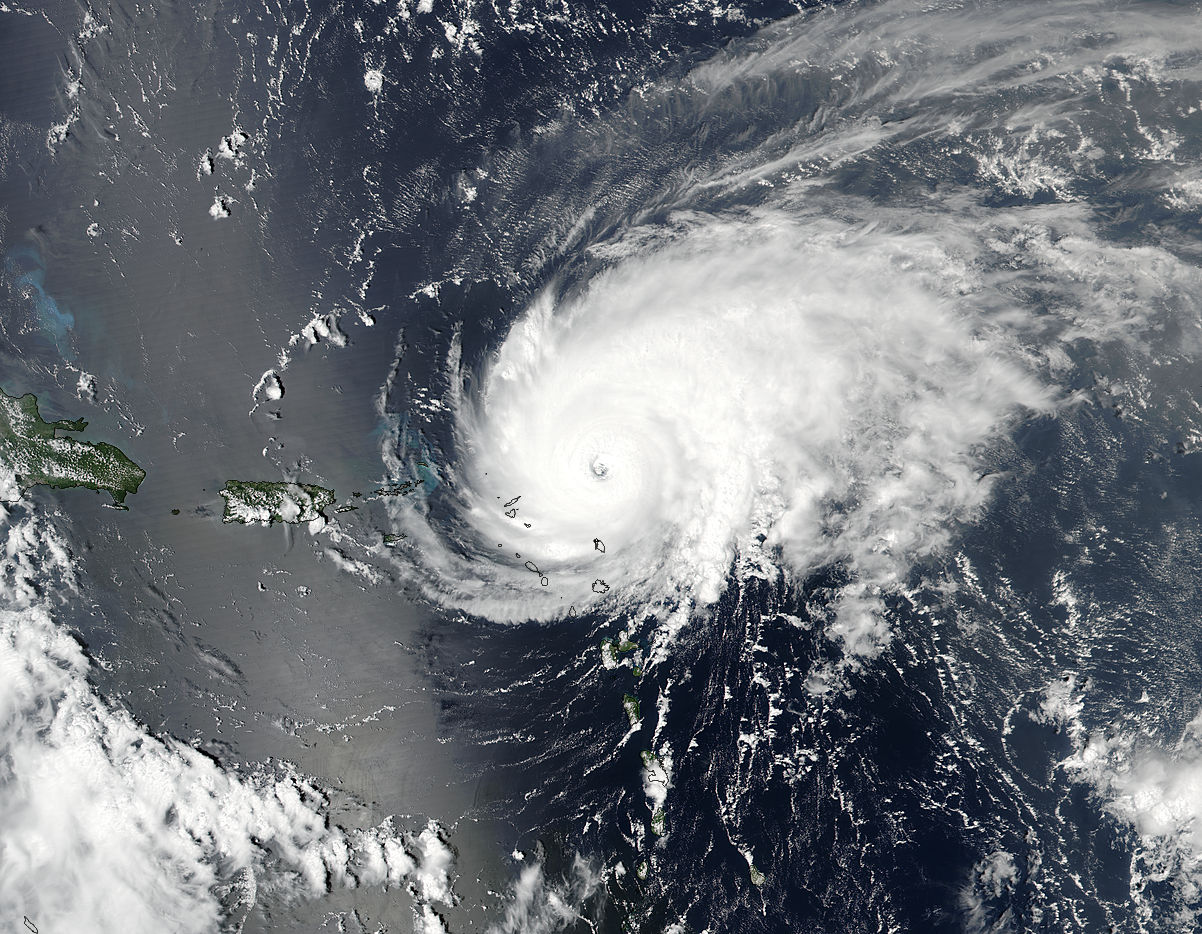
Sep. 09, 2017 – Hurricane Jose Gives NASA’s Terra Satellite a Clear Eye
NASA’s Terra satellite passed over powerful Hurricane Jose in the Atlantic Ocean and captured a close look at the eye of the storm.

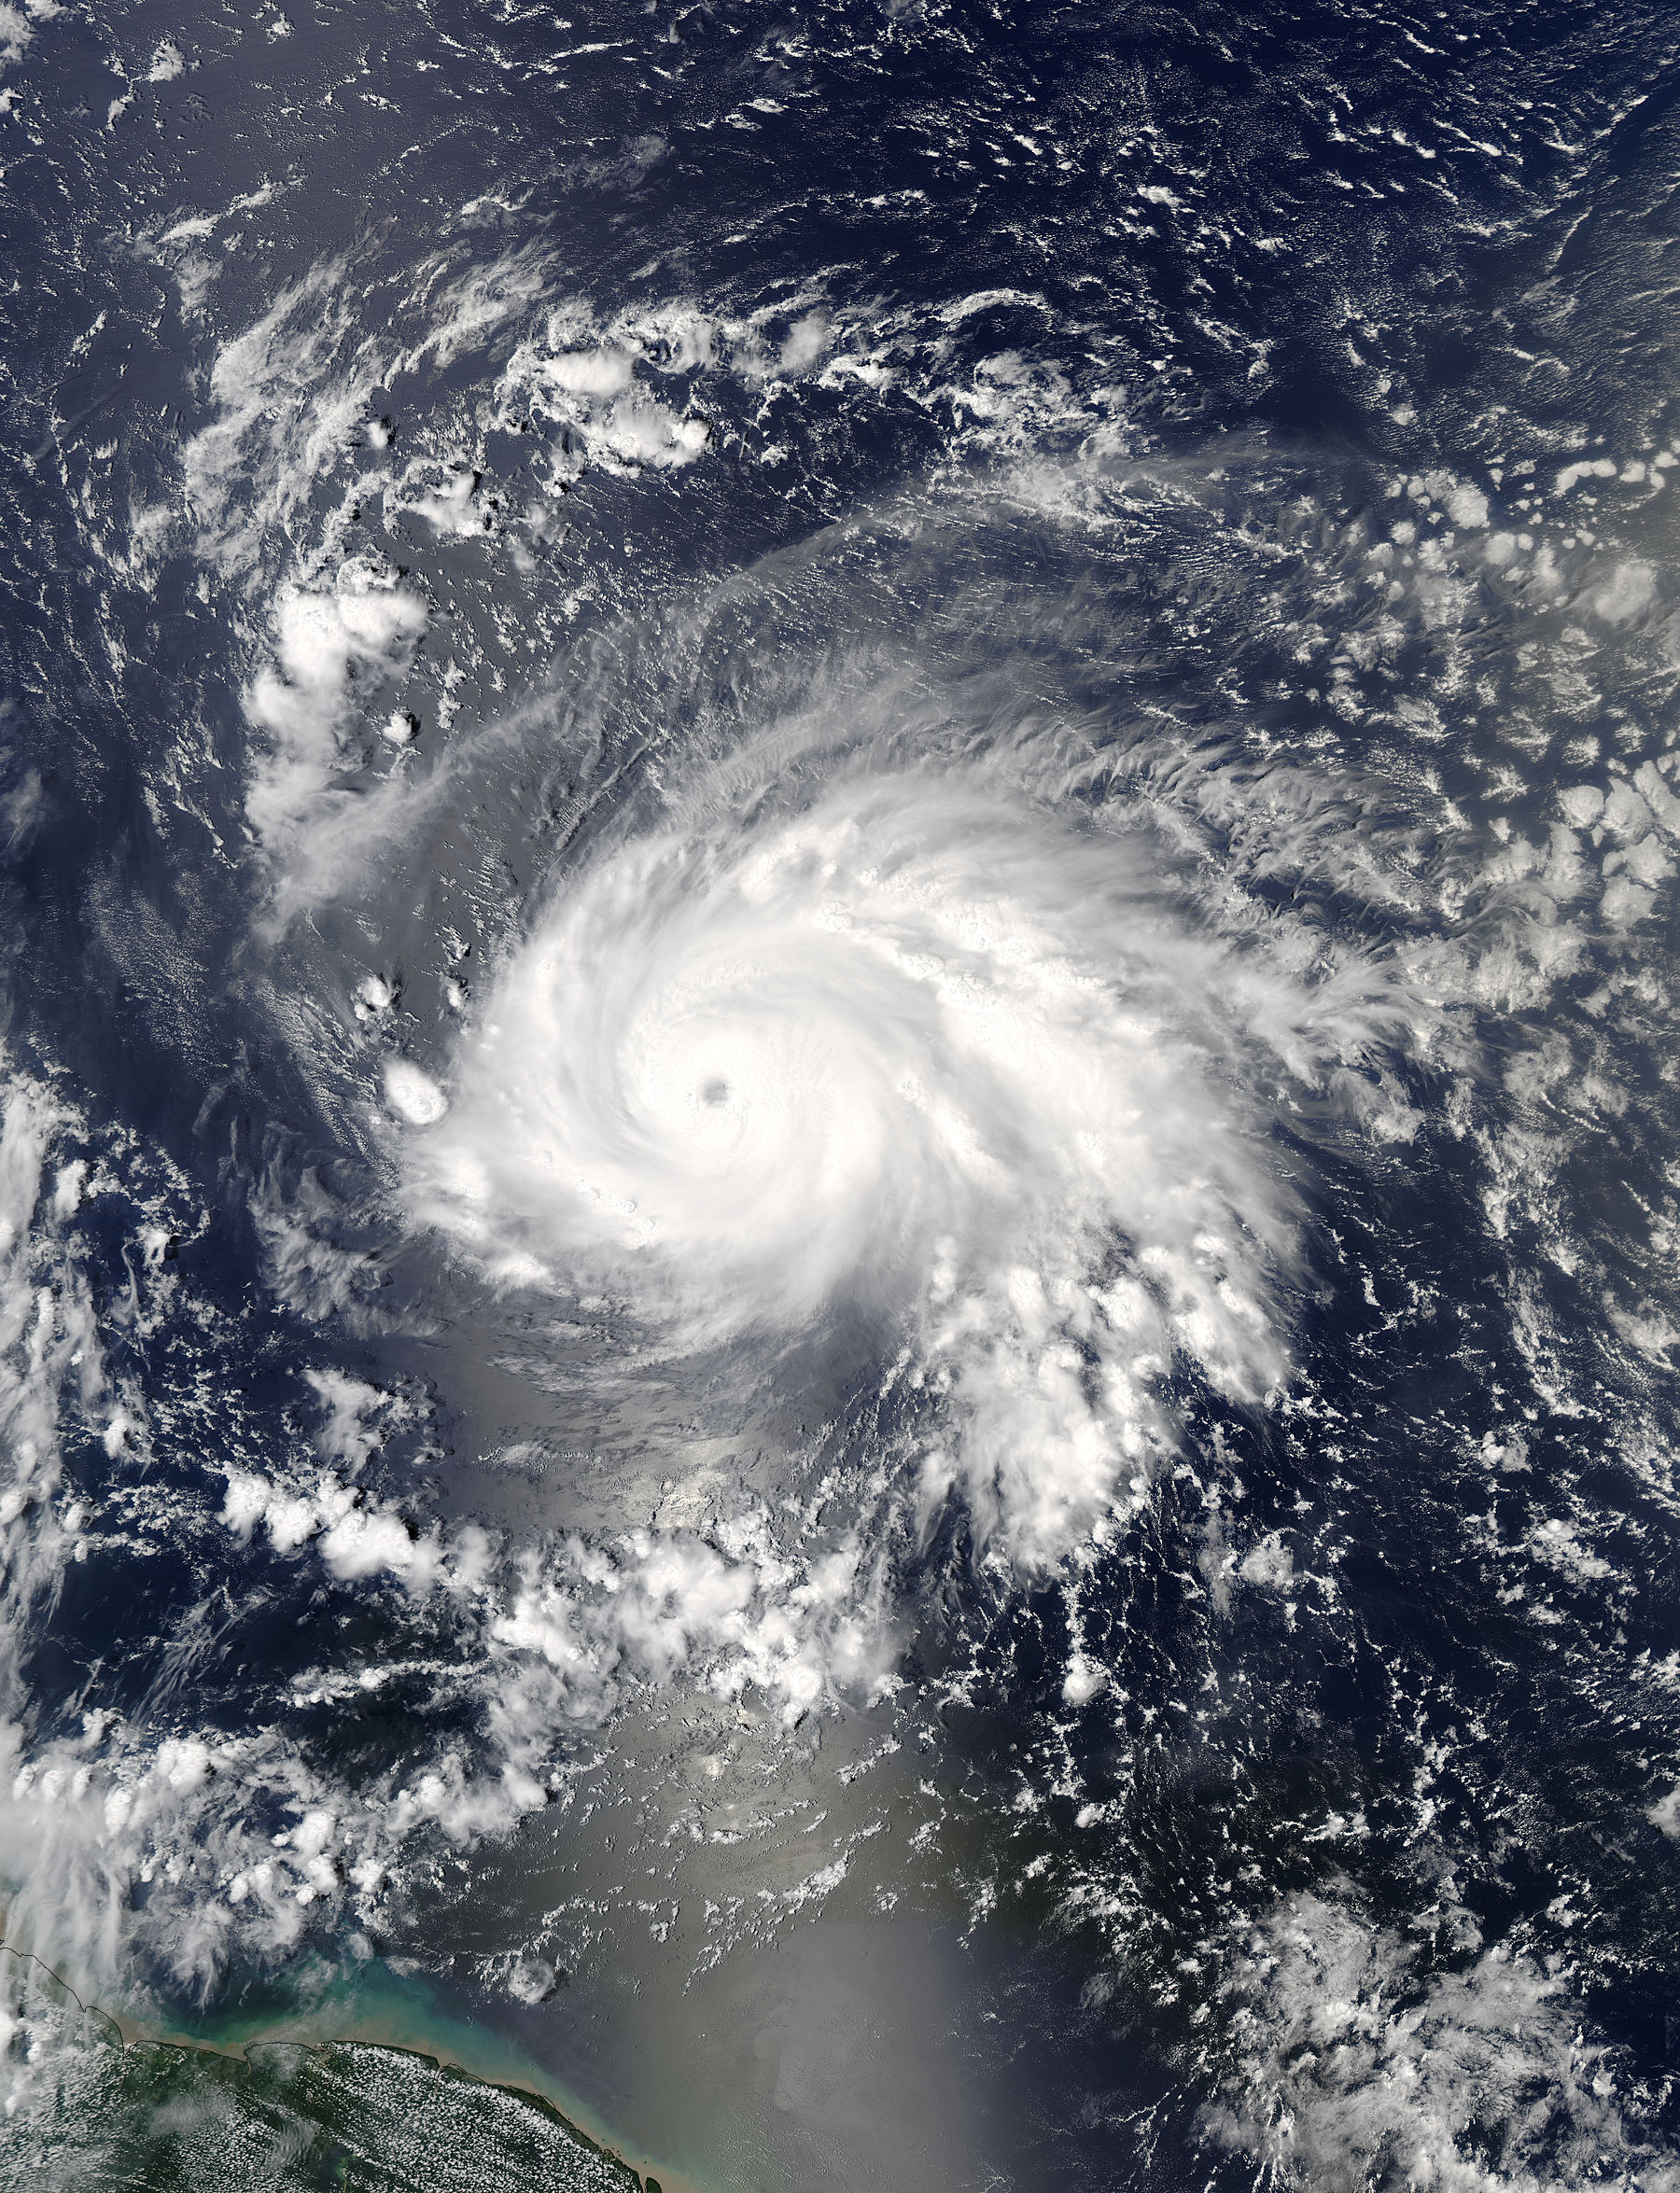
On Sept. 8 at 10:25 a.m. EDT (1425 UTC) the Moderate Resolution Imaging Spectroradiometer or MODIS instrument aboard NASA’s Terra satellite captured a visible-light image of Category 4 Hurricane Jose. The image showed that a thick band of thunderstorms continued to circle a very clear and well-defined eye.
On Sept. 9, U.S. Air Force Reserve Reconnaissance aircraft measurements suggest that this eye has become slightly more asymmetric. In addition, the National Hurricane Center noted on Sept. 9 that “visible and infrared satellite imagery indicate northeastward elongation of the cirrus canopy accompanying Jose, suggesting the southwesterly shear over the system is beginning to increase. The interaction between Jose and shear accompanying the aforementioned trough will likely result in a weakening trend through the weekend.”
Warnings and Watches
A Hurricane Warning is in effect for Saint Maarten, St. Martin, St. Barthelemy, and a Tropical Storm Warning is in effect for Barbuda and Anguilla, Saba and St. Eustatius.
The Tropical Storm Watch for St. Thomas and St. John in the U.S.Virgin Island has been discontinued. The government of Antigua has discontinued the Tropical Storm Watch for Antigua and the British Virgin Islands.
Jose’s Location on Saturday, September 9, 2017
At 11 a.m. AST/EDT (1500 UTC), the center of Hurricane Jose was located near 18.3 degrees north latitude and 61.3 west longitude. That’s about 120 miles (190 km) east of the Northern Leeward Islands.
Jose is moving toward the northwest near 13 mph (20 kph). A continued northwest motion is expected during the next couple of days. On the forecast track, the core of Jose will pass just north of the northern Leeward Islands later today.
Maximum sustained winds are near 145 mph (230 kph) with higher gusts. Jose is a category 4 hurricane on the Saffir-Simpson Hurricane Wind Scale. Gradual weakening is expected to occur over the next couple of days.
Hurricane-force winds extend outward up to 35 miles (55 km) from the center and tropical-storm-force winds extend outward up to 140 miles (220 km).
For forecast updates on Jose, visit: www.nhc.noaa.gov
Rob Gutro
NASA’s Goddard Space Flight Center
Sep. 08, 2017 – (Update #3) ISS Pass Over Hurricane Jose and Hurricane Irma 9/8/17
Credits: NASA
Raw footage download
Sep. 08, 2017 – (Update #2) NASA Gets “Eyed” by Major Hurricane Jose
NASA’s Aqua satellite captured clear view of the eye of Hurricane Jose at it moved toward the Leeward Islands and strengthened into a Category 4 Hurricane on the Saffir-Simpson Hurricane Wind Scale. Aqua also analyzed the storm in infrared light showing powerful storms around the center, capable of heavy rainfall.
On Sept. 8, the National Hurricane Center posted a Hurricane Watch for Antigua, Barbuda, and Anguilla, Saint Maarten, St. Martin and St. Barthelemy. A Tropical Storm Warning is in effect for Antigua, Barbuda, and Anguilla, and a Tropical Storm Watch is in effect for Montserrat, St Kitts, and Nevis, Saba and St. Eustatius.
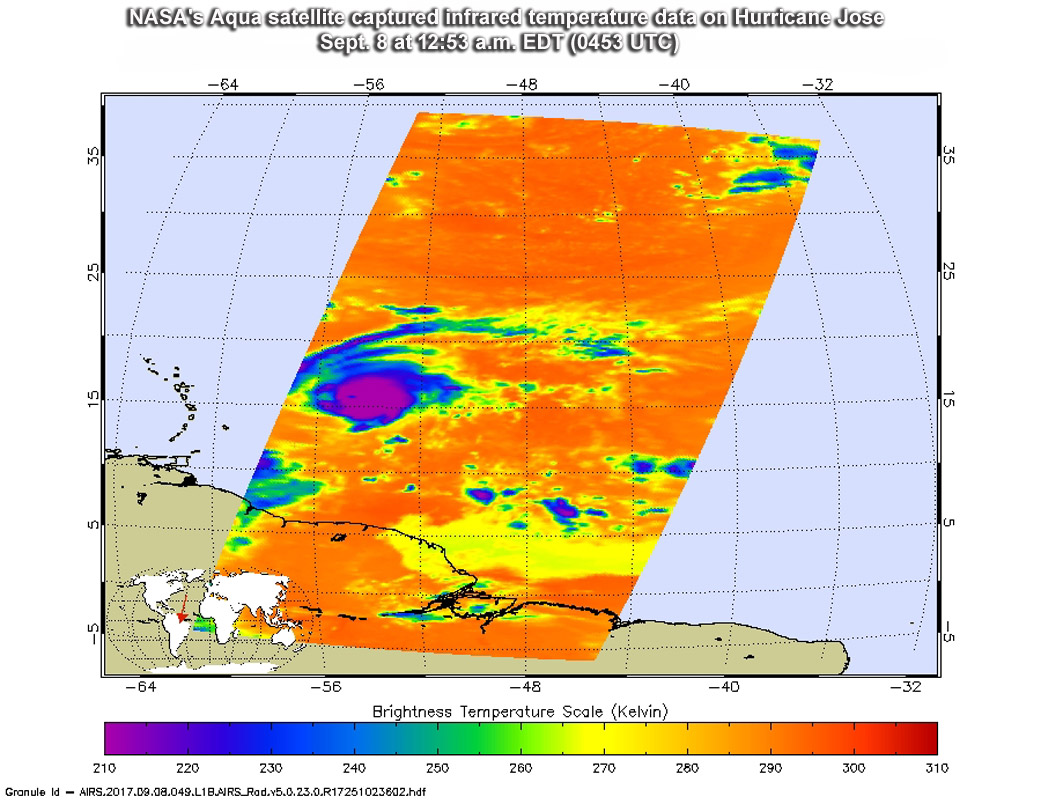
The Atmospheric Infrared Sounder or AIRS instrument aboard NASA’s Aqua satellite captured infrared temperature data on Hurricane Jose on Sept. 8 at 12:53 a.m. EDT (0453 UTC). The image showed some very cold cloud top temperatures as cold as minus 63 degrees Fahrenheit (minus 53 degrees Celsius) around the center of circulation and in a feeder band of thunderstorms west of the center. NASA research has shown that cloud tops that cold are high in the troposphere and have the potential to generate heavy rainfall.
On Sept. 8 at 12:45 p.m. EDT (1645 UTC) the Moderate Resolution Imaging Spectroradiometer or MODIS instrument aboard NASA’s Aqua satellite captured a visible-light image of Hurricane Jose. The image showed a symmetrical storm with powerful bands of thunderstorms around a clear eye.
Jose’s Location at 10 a.m. EDT on Sept. 8
The National Hurricane Center (NHC) said at 10 a.m. (1400 UTC), the eye of Hurricane Jose was located near 16.2 degrees north latitude and 56.9 degrees west longitude, about 435 miles (700 km) east-southeast of the Northern Leeward Islands. Jose was moving toward the west-northwest near 18 mph (30 kph). A slower west-northwestward motion is expected during the next couple of days.
Maximum sustained winds are near 150 mph (240 kph) with higher gusts. Jose is a category 4 hurricane on the Saffir-Simpson Hurricane Wind Scale. The estimated minimum central pressure is 942 millibars.
On the forecast track, Jose is expected to be near the northern Leeward Islands on Saturday, Sept. 9.
For updates on Jose, visit: www.nhc.noaa.gov
Rob Gutro
NASA’s Goddard Space Flight Center
Sep. 08, 2017 – (Update #1) Satellite Animation Sees Hurricanes Katia, Irma and Jose
Credits: NASA-NOAA
Sep. 07, 2017 – NASA Finds Jose Strengthening into a Hurricane
The Global Precipitation Measurement mission or GPM core satellite has been providing rainfall rates and cloud heights in tropical cyclones, and recently found towering thunderstorms that indicated strengthening in Tropical Storm Jose. Those “hot towers” were an indication the storm was strengthening and it later became a hurricane.
Credits: NASA/JAXA, Hal Pierce
The GPM core observatory satellite passed above the intensifying tropical cyclone on Sept. 6, 2017 at 12:45 a.m. AST/EDT (0435 UTC). GPM is a joint mission between NASA and the Japan Aerospace Exploration Agency, JAXA.
Data collected by GPM’s Microwave Imager (GMI) at that time showed that weak bands of rain were starting to develop around Jose’s center of circulation. GPM’s Dual-Frequency Precipitation Radar (DPR) data swath revealed the location of heavy rain in a feeder band on Jose’s western side. DPR found that rain in this area was falling at a rate of over 5.3 inches (134 mm) per hour.
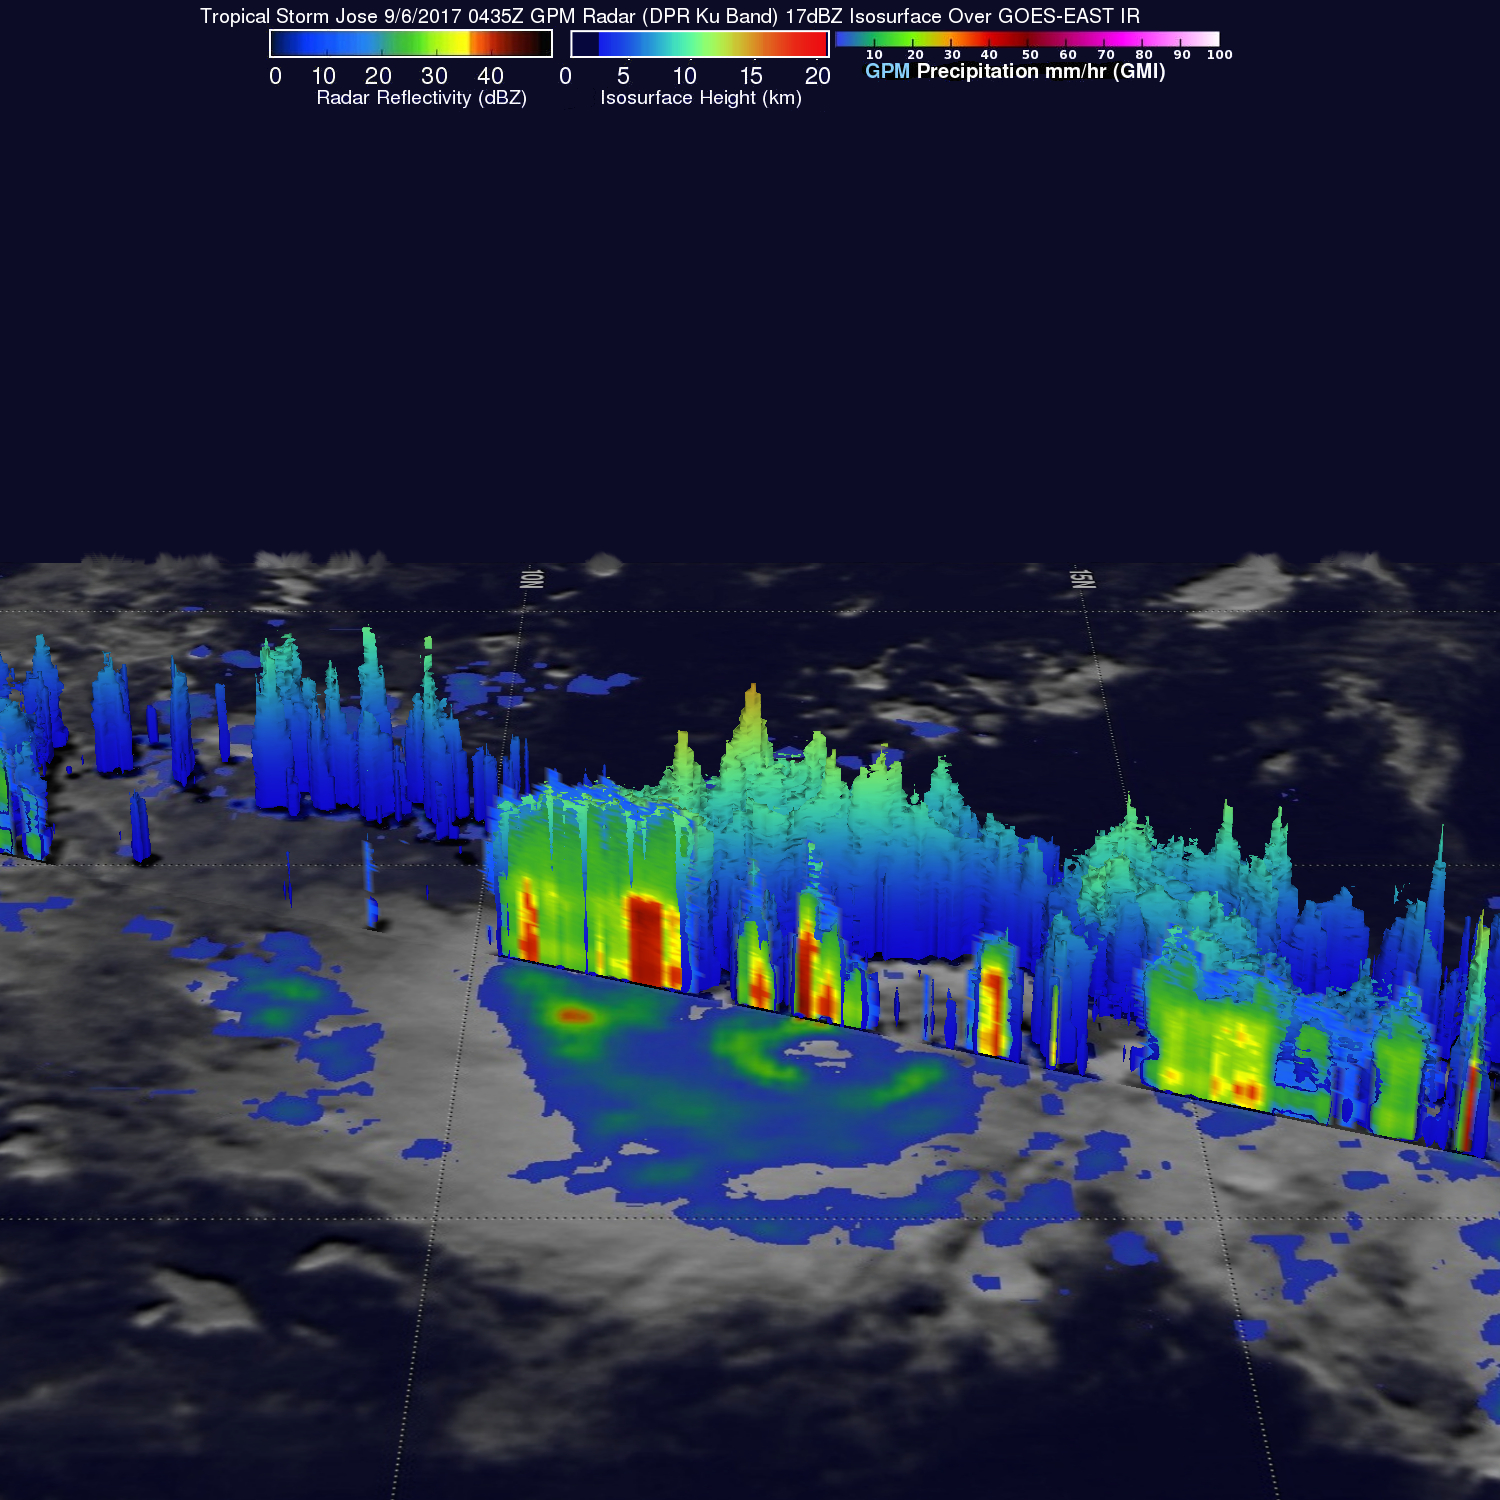
GPM’s radar data (DPR Ku band) were used to develop a 3-D cross section at NASA’s Goddard Space Flight Center in Greenbelt, Maryland. That 3-D imagery showed the structure of precipitation in the most powerful storms on the western side of the storm where a few “hot towers” in this feeder band were reaching to heights of almost 9.9 miles (16 km).
A “hot tower” is a tall cumulonimbus cloud near the center of a tropical cyclone, often seen prior to intensification. The cloud tops reach at least to the top of the troposphere, the lowest layer of the atmosphere which is approximately 9 miles/14.5 km high in the tropics. These towers are called “hot” because they rise to such altitude due to the large amount of latent heat. Water vapor releases this latent heat as it condenses into liquid. Those towering thunderstorms have the potential for heavy rain.
At 5 p.m. AST/EDT, on Sept. 6, Jose strengthened into a hurricane.
Twelve hours later, by 5 a.m. AST/EDT (0900 UTC), the center of Hurricane Jose was located near 14.8 degrees north latitude and 49.1 degrees west longitude. That’s about 815 miles (1,310 km east of the Lesser Antilles. Jose was moving toward the west-northwest near 18 mph (30 kph), and this general motion is expected to continue during the next couple of days. Maximum sustained winds have increased to near 90 mph (150 kph) with higher gusts. Some strengthening is forecast during the next 48 hours. The estimated minimum central pressure is 986 millibars.
Jose is a small storm. Hurricane-force winds extend outward up to 15 miles (30 km) from the center and tropical-storm-force winds extend outward up to 80 miles (130 km).
Forecaster Roberts of the National Hurricane Center (NHC) noted that further strengthening is forecast during the next 36 hours. After that time, increasing northerly shear associated with the outflow of Hurricane Irma should inhibit further intensification and subsequently, cause the cyclone to begin weakening.
NHC stated that Interests in the Leeward Islands should monitor the progress of Jose. Hurricane and Tropical Storm Watches will likely be required for portions of these islands later this morning.
For updated forecasts on Jose, visit: www.nhc.noaa.gov
Rob Gutro
NASA’s Goddard Space Flight Center
Sep. 06, 2017 – NASA Watching Tropical Storm Jose Get Organized
Tropical Storm Jose appeared somewhat elongated in NASA satellite imagery as NASA-NOAA’s Suomi NPP satellite passed overhead, but the storm organized and strengthened overnight.

The Visible Infrared Imaging Radiometer Suite (VIIRS) instrument aboard took a visible light picture of the Jose on Sept. 5 at 11:18 a.m. EDT (1518 UTC). In the image bands of thunderstorms had developed as the storm continued to consolidate and organize. Satellite imagery showed that the center was well-defined, yet somewhat elongated.
On Sept.6, Jose appeared much better organized. At 11 a.m. AST/EDT (1500 UTC), the center of Tropical Storm Jose was located near 13.1 degrees north latitude and 44.5 degrees west longitude. That’s about 1,135 miles (1,825 km) east of the Lesser Antilles.
Jose was moving toward the west-northwest near 17 mph (28 kph) and this general motion is expected to continue over the next couple of days.
Maximum sustained winds are near 65 mph (100 kph) with higher gusts. Continued gradual strengthening is forecast and Jose is expected to become a hurricane later in the day on Sept. 6. The estimated minimum central pressure is 998 millibars.
For updates on Jose, visit: www.nhc.noaa.gov
Rob Gutro
NASA’s Goddard Space Flight Center
Sep. 05, 2017 – NASA Sees Development of Tropical Storm Jose
As Tropical Storm Jose was forming in the Eastern Atlantic Ocean, NASA’s Aqua satellite analyzed its cloud top temperatures.
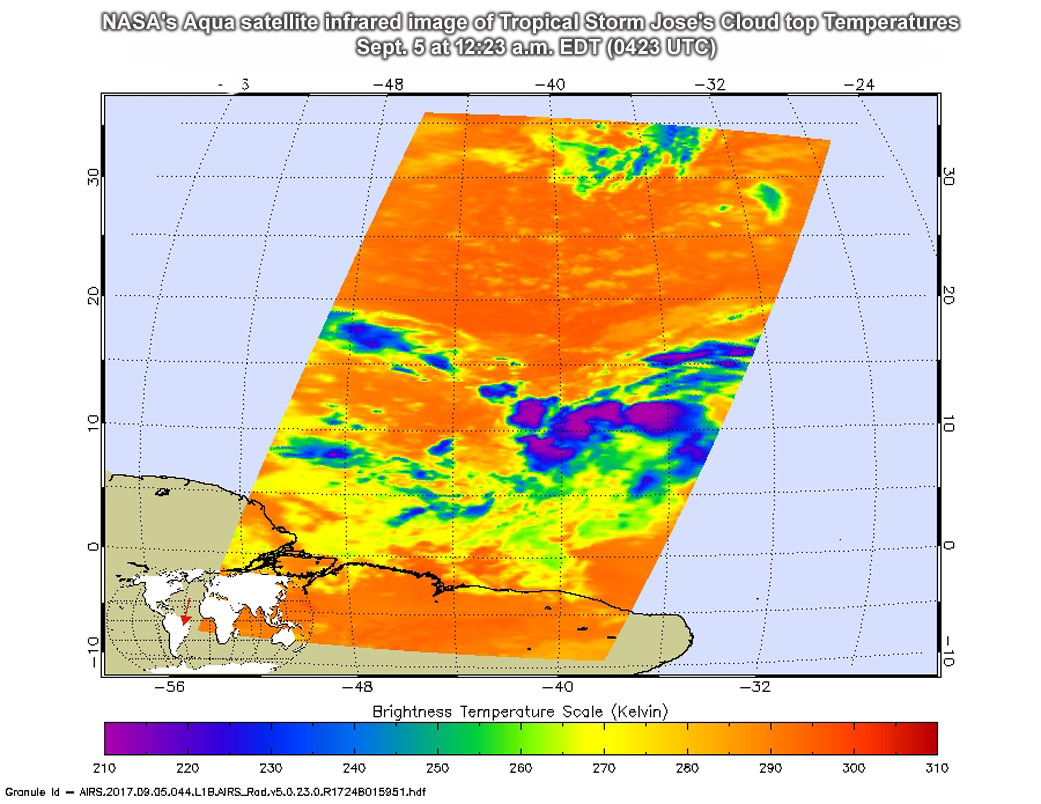
The Atmospheric Infrared Sounder or AIRS instrument aboard NASA’s Aqua satellite passed over Tropical Storm Jose as it was consolidating. AIRS analyzed the storm in infrared light providing scientists with temperature data and that’s important when trying to understand how strong storms can be. The higher the cloud tops, the colder and the stronger they are. So infrared light as that gathered by the AIRS instrument can identify the strongest sides of a tropical cyclone.
NASA’s Aqua satellite flew over Jose on Sept. 5 at 12:23 a.m. EDT (0423 UTC) AIRS detected some strong thunderstorms with cloud top temperatures as cold as minus 63 degrees Fahrenheit (minus 53 degrees Celsius). Storms with cloud top temperatures that cold have the capability to produce heavy rainfall. AIRS data and other satellite imagery showed a well-defined though slightly elongated center had formed.
At 11 a.m. EDT (1500 UTC) on Sept. 5, the center of Tropical Storm Jose was located near 12.3 degrees north latitude and 39.1 degrees west longitude. Jose was moving toward the west-northwest near 13 mph (20 kph) and a movement toward the west or west-northwest at a slightly faster rate of forward speed is expected during the next two days. Maximum sustained winds are near 40 mph (65 kph) with higher gusts. Some strengthening is forecast during the next 48 hours and Jose could become a hurricane by Friday.
NHC forecaster Chris Landsea said that Jose should move toward the west or west-northwest for the next three to four days at a slightly faster rate of forward speed as it moves south of the deep-layer Azores-Bermuda high.
For updated forecasts on Jose, visit: www.nhc.noaa.gov.