


![Request for Information – Potential [Placeholder for Prize]](https://assets.science.nasa.gov/dynamicimage/assets/science/psd/solar/2023/09/s/solarsystem_0.jpg?w=1024)


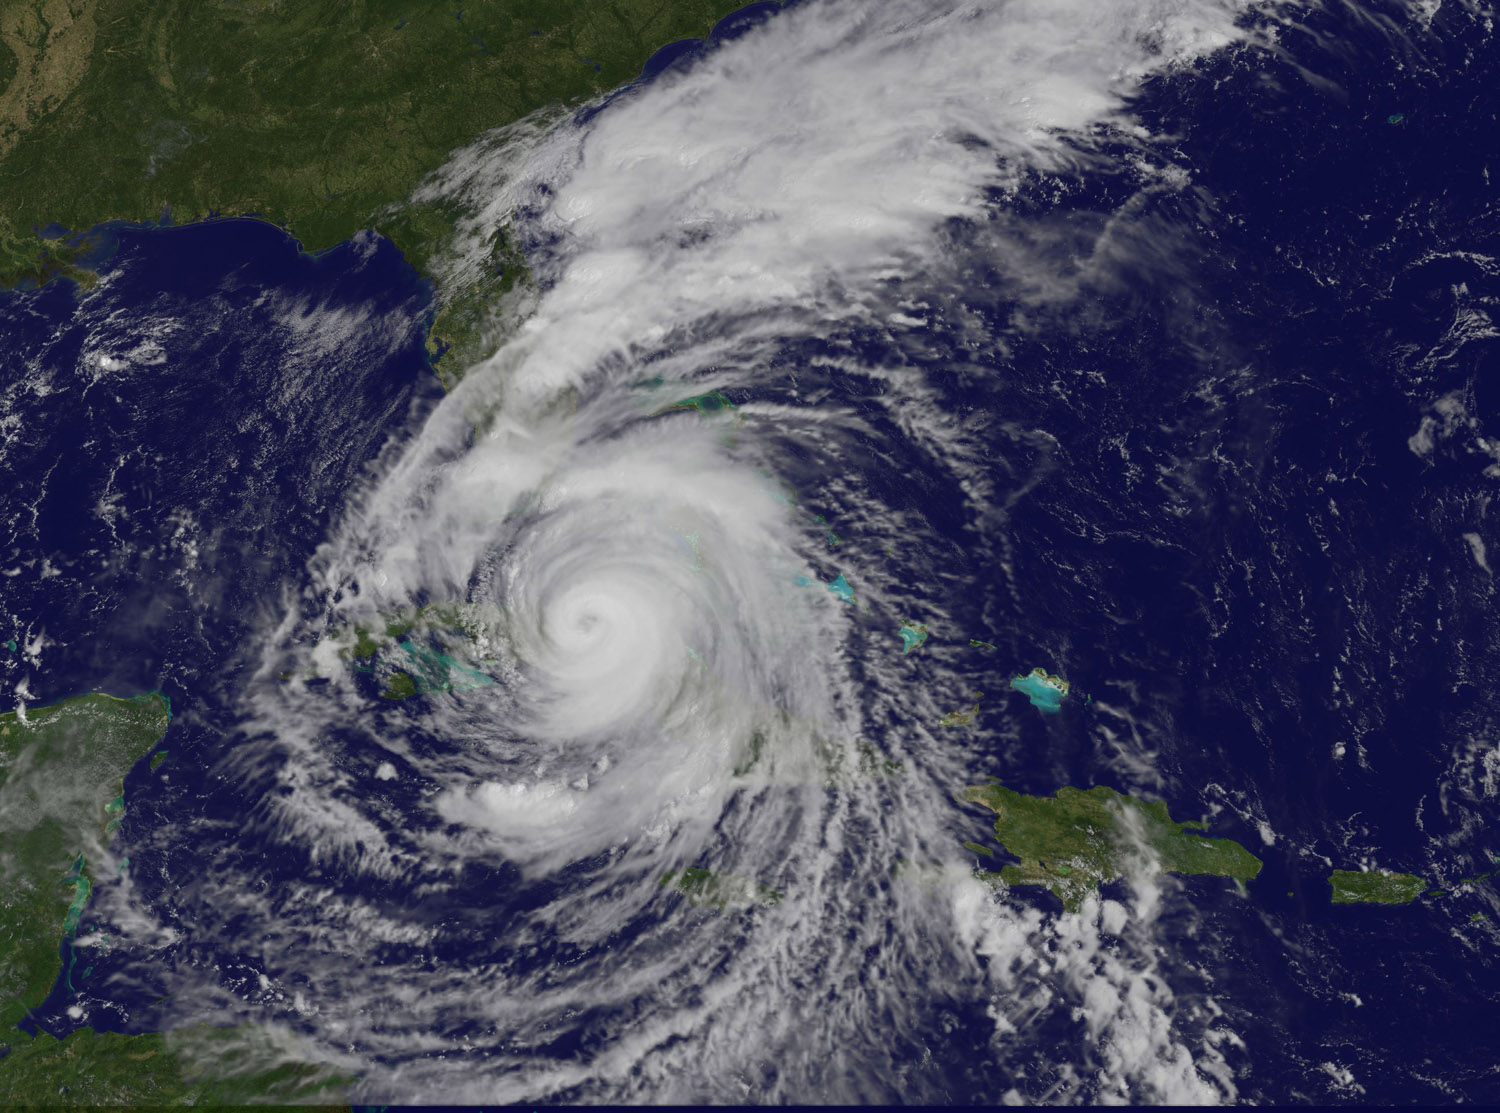
NASA Sees Remnants of Irma Ready to Exit Eastern U.S.
NASA’s Terra satellite and NOAA’s GOES East satellite have been just two of the fleet of satellites monitoring the life and death of former Hurricane Irma. Imagery from both of those satellites over two days show the movement of Irma’s remnant clouds.
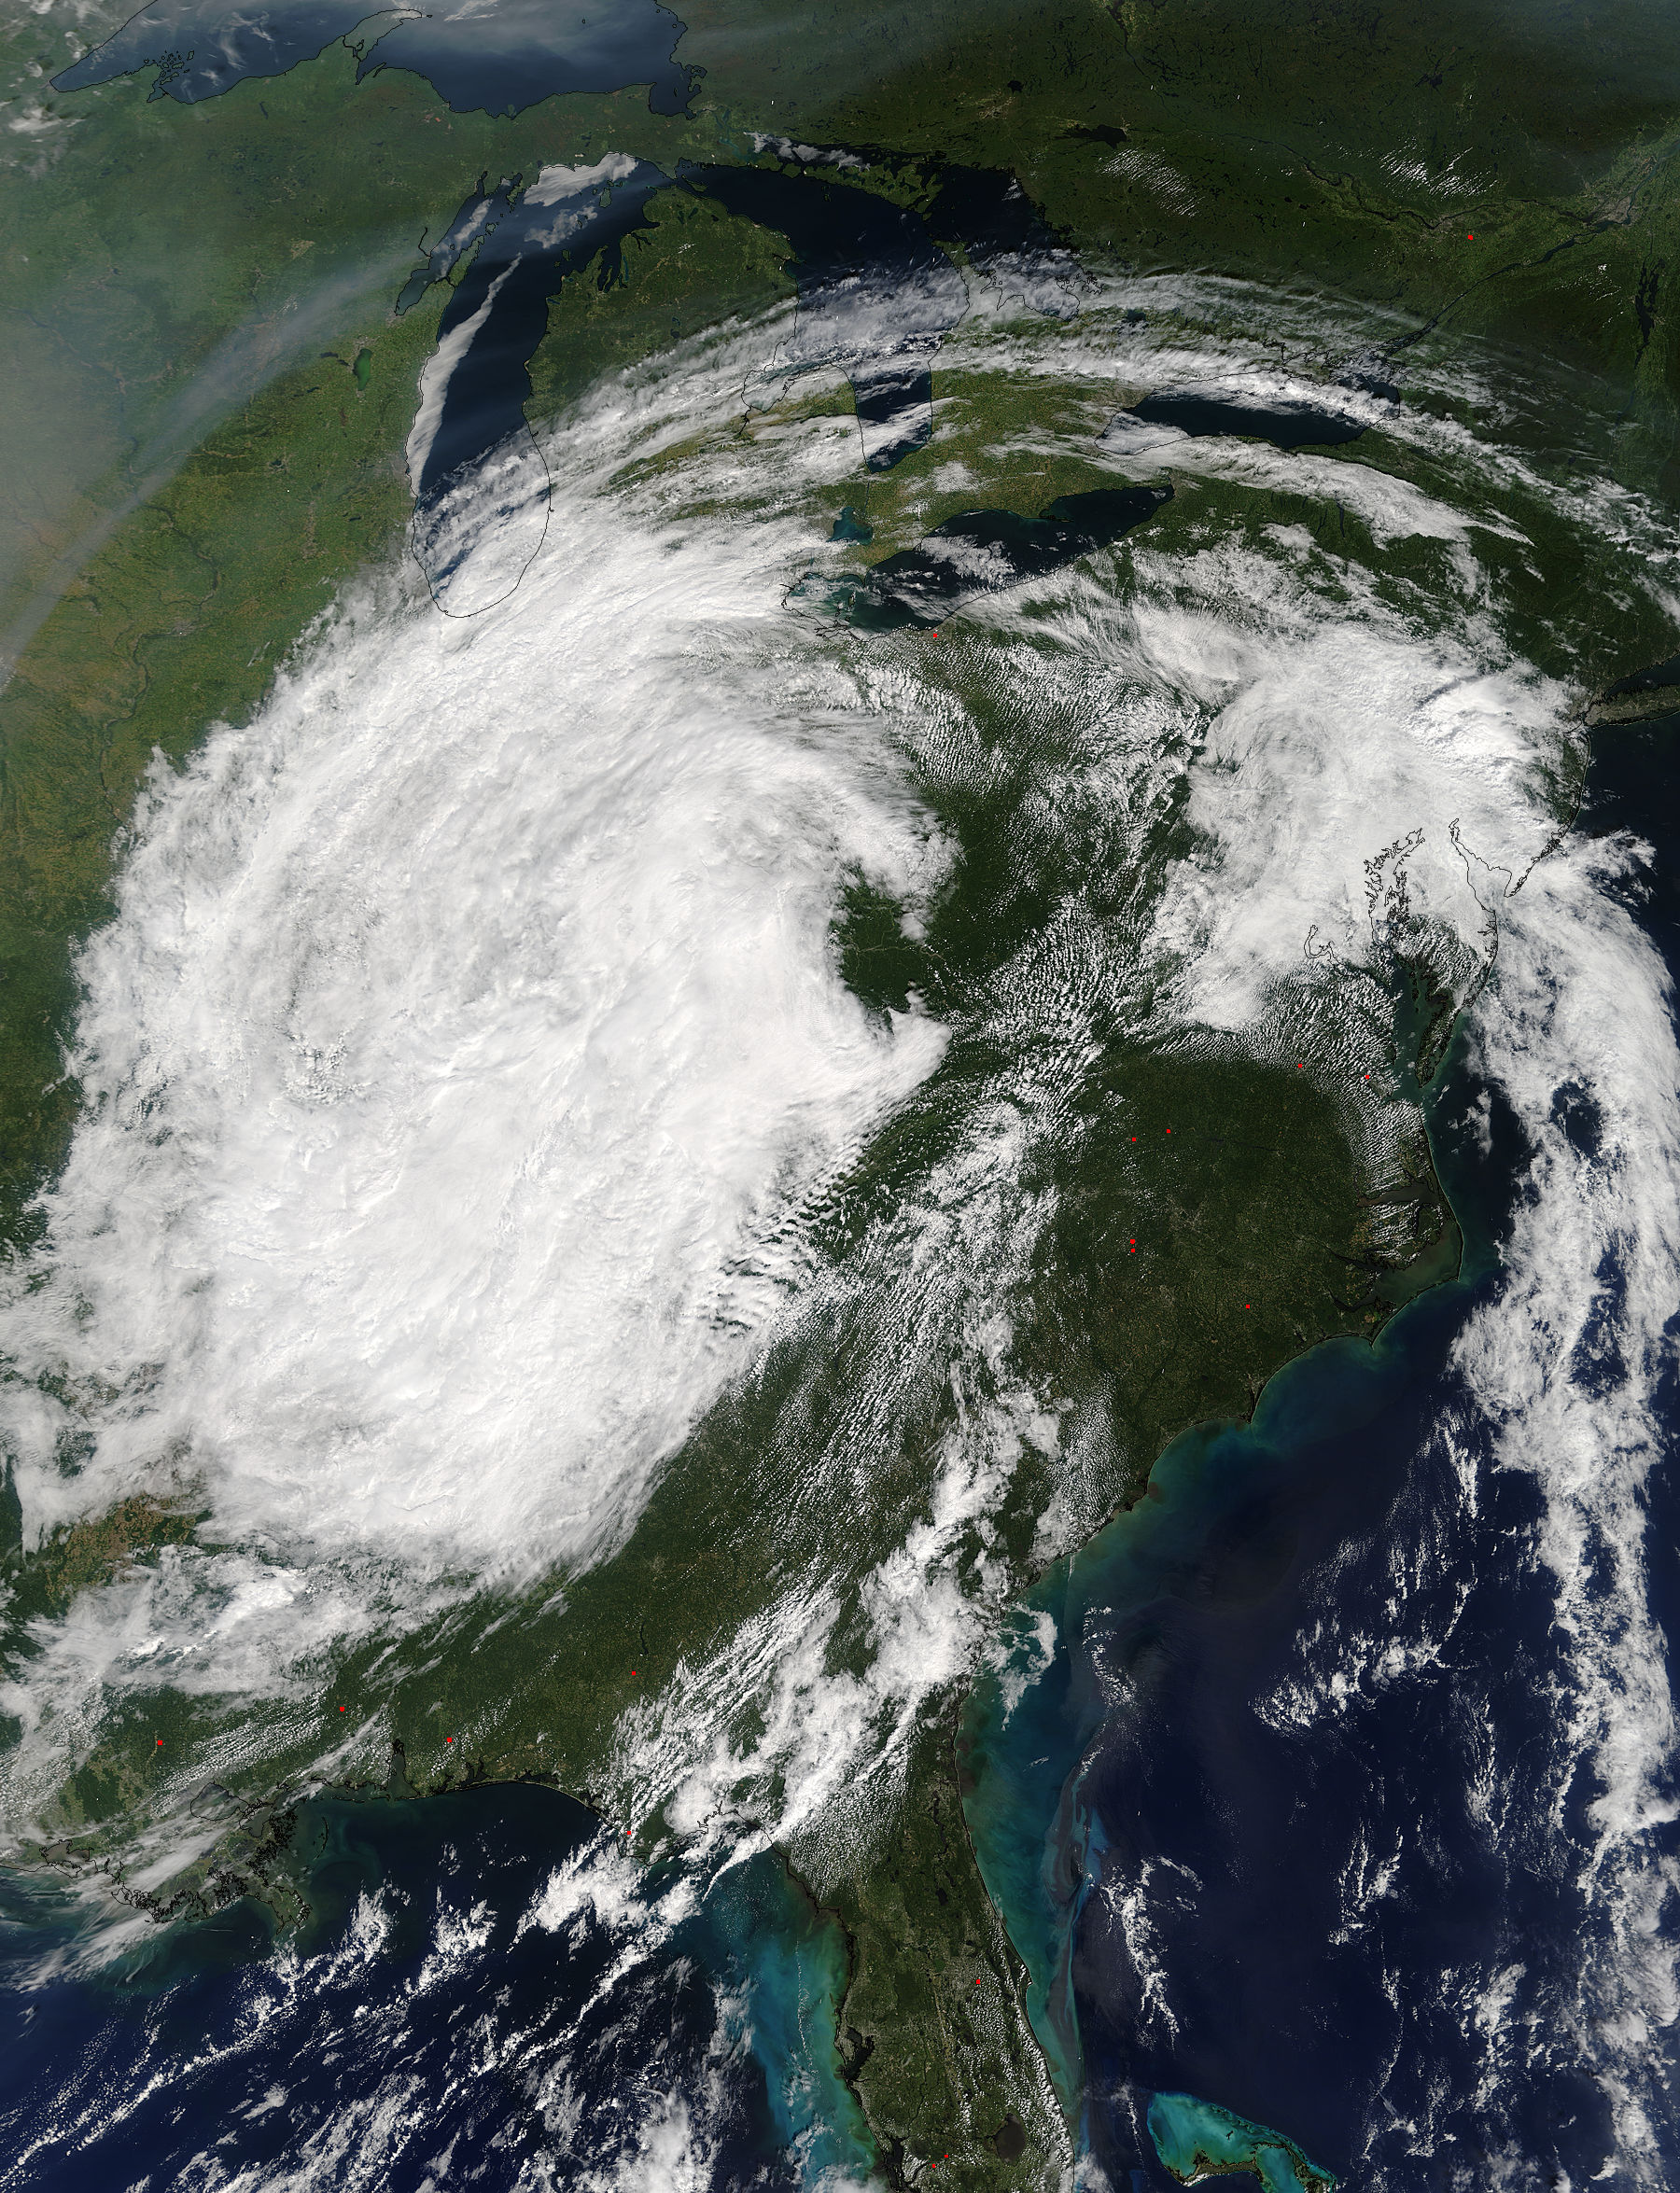
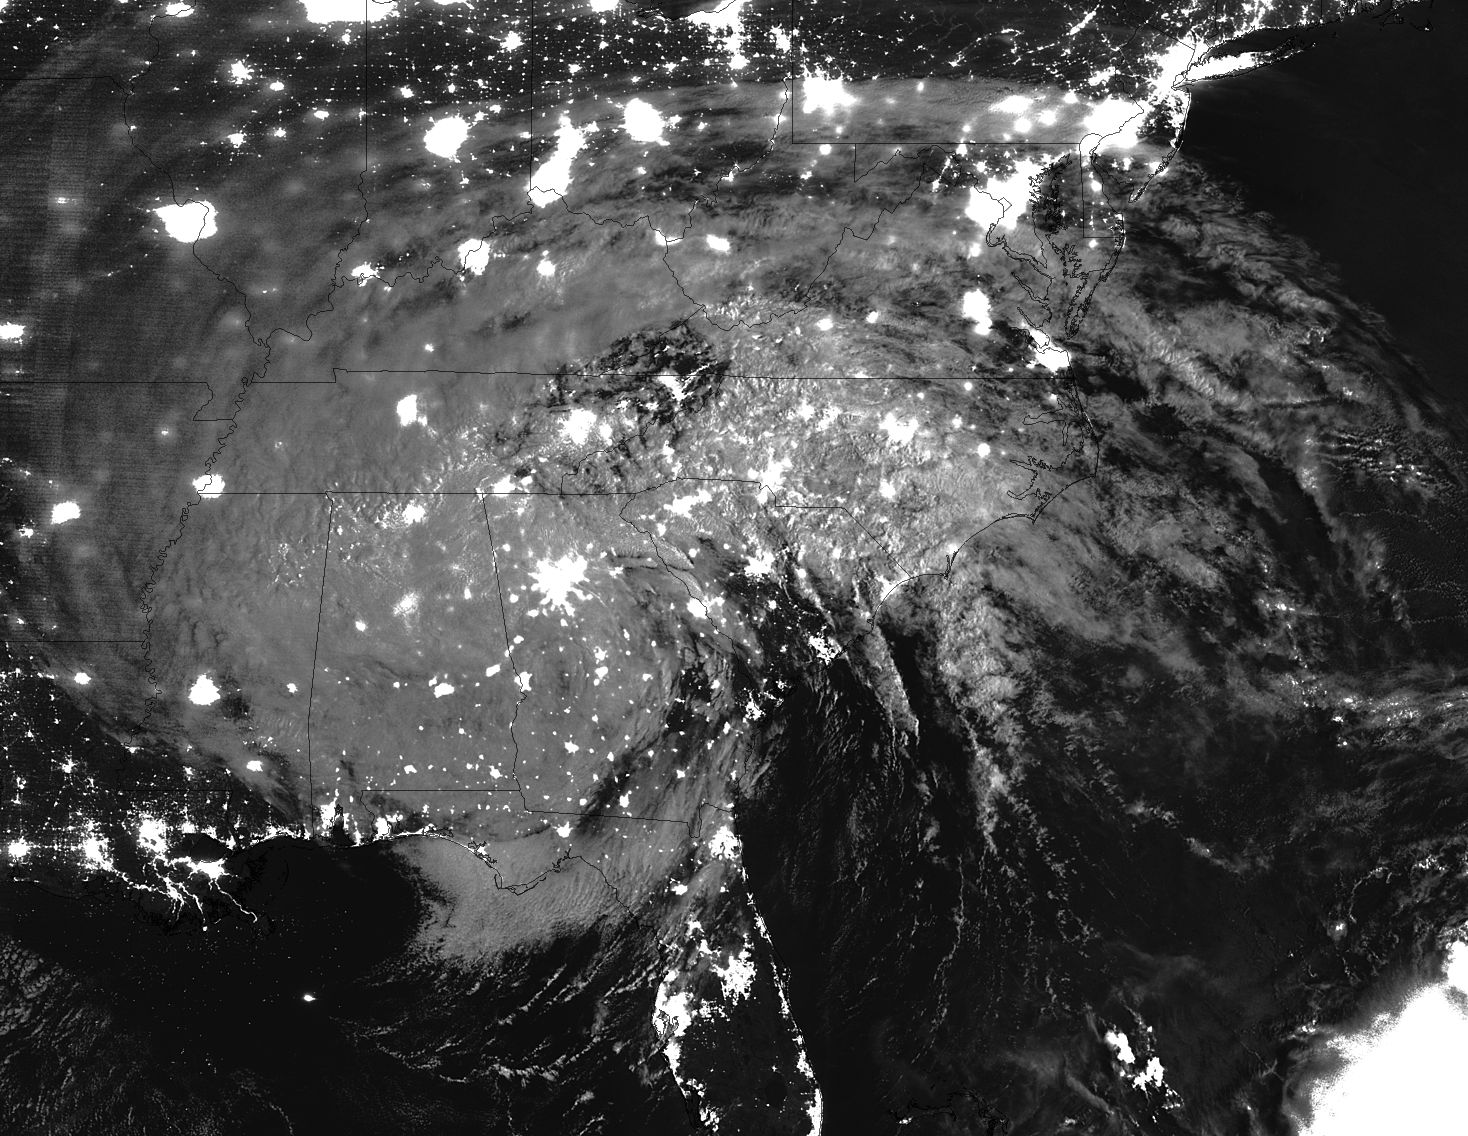
On Sept. 13 at 12:20 p.m. EDT (1620 UTC) the Moderate Resolution Imaging Spectroradiometer of MODIS instrument aboard NASA’s Terra satellite provided a visible image of the remnants of Hurricane Irma over the U.S. Midwest. The clouds stretched from Missouri to the southern tip of Lake Michigan in the Great Lakes.
The MODIS image was created by NASA’s MODIS Rapid Response Team at NASA’s Goddard Space Flight Center in Greenbelt, Maryland.
On Thursday, Sept. 14 at 3:34 a.m. EDT, the Discussion from the National Weather Service, Baltimore, Maryland/Washington, D.C. noted “The remnants of Irma will scoot toward the northeast and across Pennsylvania today then to southern New England tomorrow.”
On Sept. 14 at 9 a.m. EDT (1300 UTC) NOAA’s GOES East satellite saw the remnant clouds associated with former Hurricane Irma moving over New England and the Mid-Atlantic. The low pressure system associated with the remnant clouds was moving over upstate New York today, Sept. 14 and moving toward the U.S. East coast.

NOAA manages the series of GOES satellites and NASA/NOAA GOES Project at NASA Goddard uses the GOES data to create images and animations.
The National Weather Service at Logan Airport in Boston, Massachusetts noted on Thursday, September 14, 2017, “The much weakened remnants from Irma will bring scattered showers and a few thunderstorms late today into Friday, but the vast majority of the time will feature dry conditions.”
Irma’s remnants are expected to slide off the U.S. East coast on Friday, Sept. 15 and into the Atlantic Ocean.
Rob Gutro
NASA’s Goddard Space Flight Center
Sep. 14, 2017 – (Update #1) Satellite Animation Shows Irma’s Remnants and Hurricane Jose
Credits: NASA-NOAA GOES Project
Sep. 13, 2017 – (Update #2) NASA-NOAA Satellite Shows Extent of Irma’s Remnants
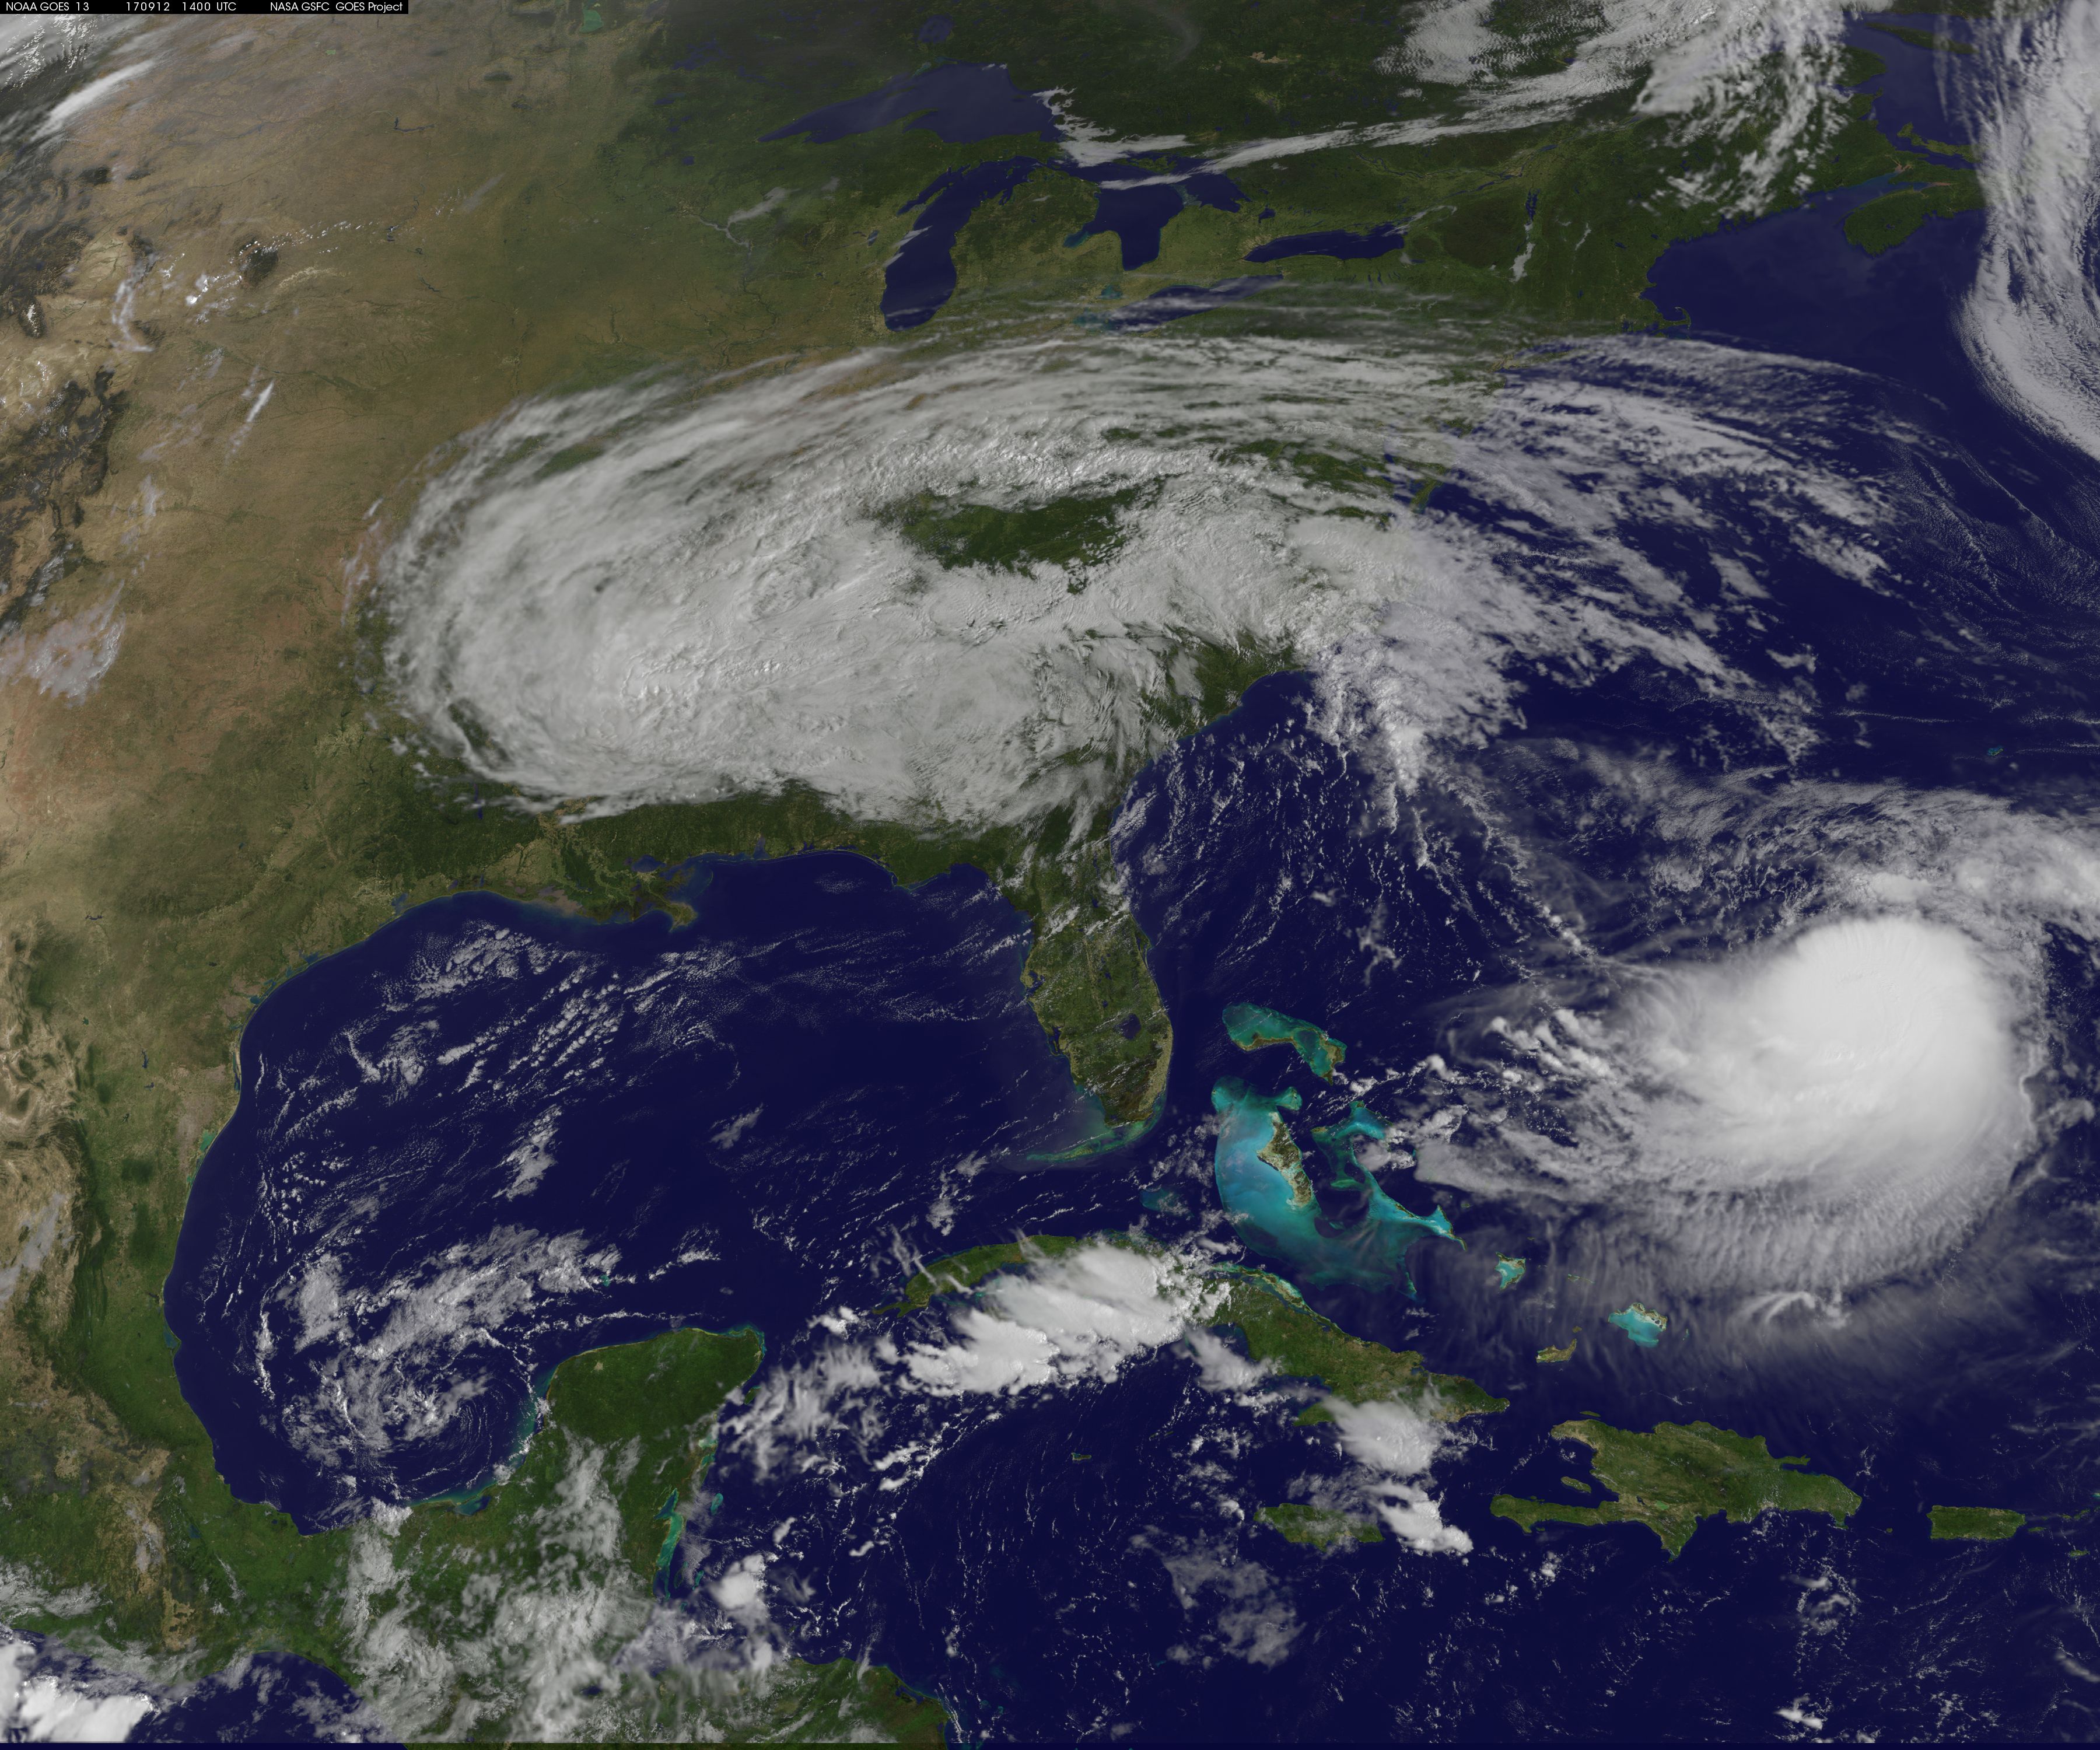
Satellite imagery showed the large extent of the remnant clouds and rains from what was Hurricane Irma. Those remnants were blanketing about a quarter of the continental U.S. over the Ohio and Tennessee Valleys and east to the Mid-Atlantic States.
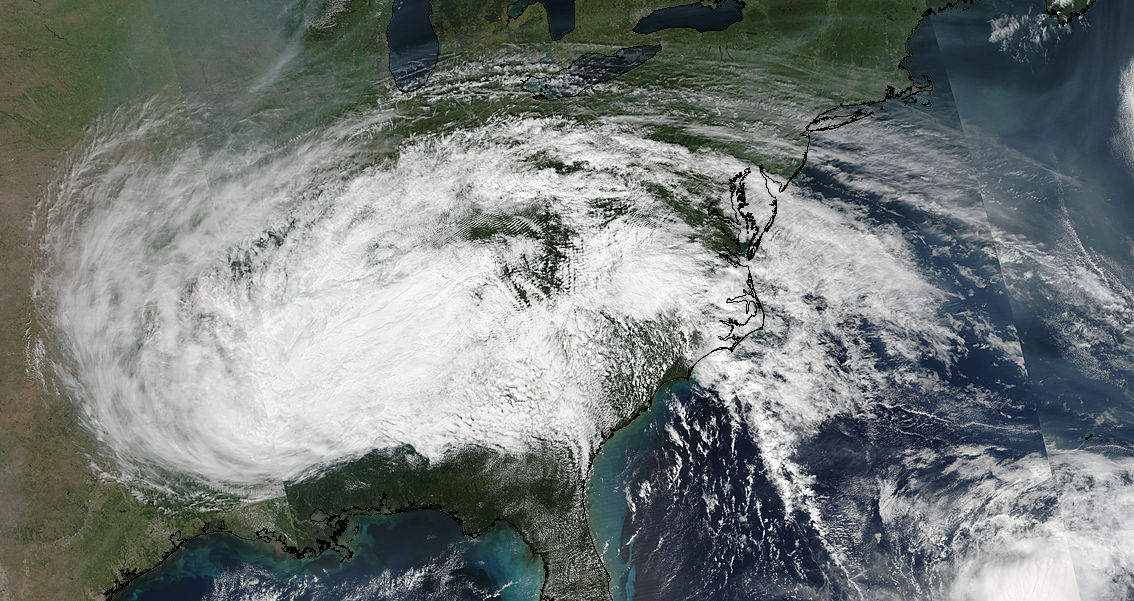
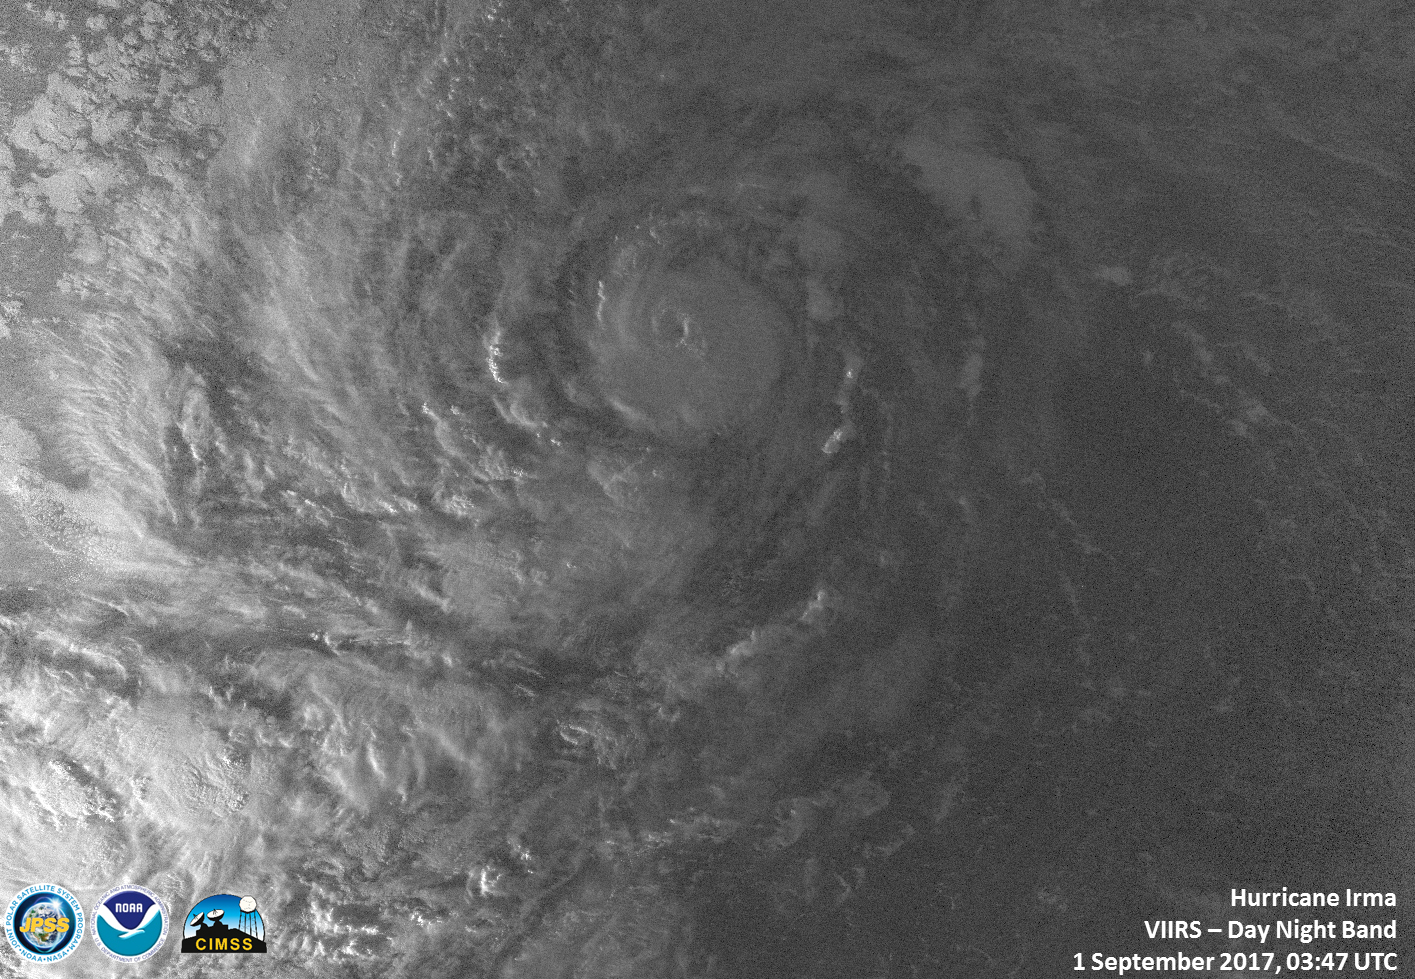
The Visible Infrared Imaging Radiometer Suite (VIIRS) instrument aboard NASA-NOAA’s Suomi NPP satellite took a visible light picture of Irma’s remnant clouds on Sept. 13 at 4 p.m. EDT (2000 UTC). The image showed the large extent of Irma’s remnant clouds.
NOAA’s National Weather Service Weather Prediction Center (WPC) in College Park, Maryland said that “Post-tropical cyclone Irma will continue to weaken and lift northwestward through Wednesday. Moderate to locally heavy rain in the Mid-South and Southeast will lift into the Ohio Valley and Middle Atlantic by Wednesday. Some of the heavier rainfall may produce flash flooding. Isolated thunderstorms will also be possible in the middle Atlantic.”
Credits: NASA-NOAA GOES Project
An animation of NOAA’s GOES East satellite imagery from Sept. 11 at 8:15 a.m. EDT (1215 UTC) to Sept. 13 ending at 8:30 a.m. EDT (1230 UTC) was created by the NASA/NOAA GOES Project at NASA’s Goddard Space Flight Center in Greenbelt, Maryland. NOAA manages the GOES series of satellites and NASA/NOAA GOES Project uses the data to create images and animations. The animation showed Hurricane Jose as it continued making a loop in the Atlantic Ocean between Bermuda and the Bahamas and Post-Tropical Cyclone Irma moved north and weakened to a remnant low pressure area.
WPC said, “Upper-level energy once associated with Irma will move over parts of the Northeast on Thursday into Thursday evening. The energy will aid in producing showers and thunderstorms over parts of the Northeast on Thursday.”
Rob Gutro
NASA’s Goddard Space Flight Center
Sep. 13, 2017 – (Update #1) GPM Satellite Provides 3-D Scan of Hurricane Irma at Category 5
Credits: NASA’s Scientific Visualization Studio
Sep. 12, 2017 – (Update #2) Irma’s Heavy Rainfall Measured by NASA’s IMERG
NASA calculated the rainfall left in the wake of now post-tropical cyclone Irma as it moved through the Caribbean Sea to landfall in Florida and then captured a night-time look at the storm as it moved over Georgia.
NASA found that Irma dropped extremely heavy rain at times during its trek. Starting from near the Cape Verde Islands in the eastern Atlantic Ocean all the way across the Atlantic to the western Atlantic’s northern Leeward Islands, Cuba and the southeastern United States.
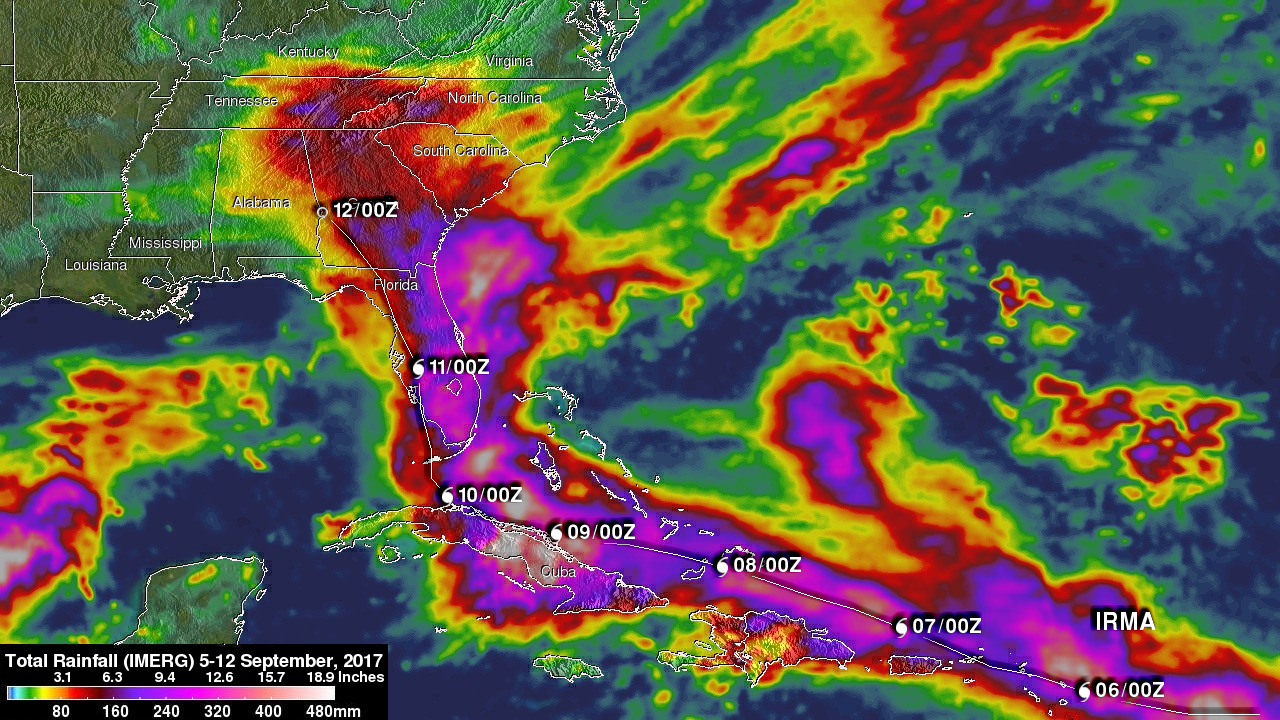
Over 16 inches (406 mm) of rain was reported in Guantanamo, Cuba in the easternmost province of Cuba, as the category five hurricane battered the country. Almost 16 inches (406 mm) of rain was also reported at Fort Pierce on the eastern side of Florida. Charleston, South Carolina reported 6 inches (152.4 mm) of rain in 24 hours. This heavy rainfall plus storm surge flooding caused the worst flooding in Charleston since hurricane Hugo hit the state in 1989.
NASA’s IMERG Rainfall Calculations
Data from the Global Precipitation Measurement mission (GPM) is used to develop rainfall total estimations. GPM is a joint mission between NASA and the Japan Aerospace Exploration Agency, JAXA.
NASA’s Integrated Multi-satellitE Retrievals for GPM (IMERG) data were used to estimate the total amount of rain that Hurricane Irma dropped from September 5 to early September 12, 2017. During that period Irma dropped heavy rain along its path from the Leeward Islands until weakening to a post-tropical cyclone over the southeastern United States. Rainfall totals were often greater than 6 inches (152.5 mm) around Irma. The greatest IMERG rainfall estimates were indicated by more than 20 inches (512 mm) over Cuba.
A Night-Time Look at a Weaker Irma
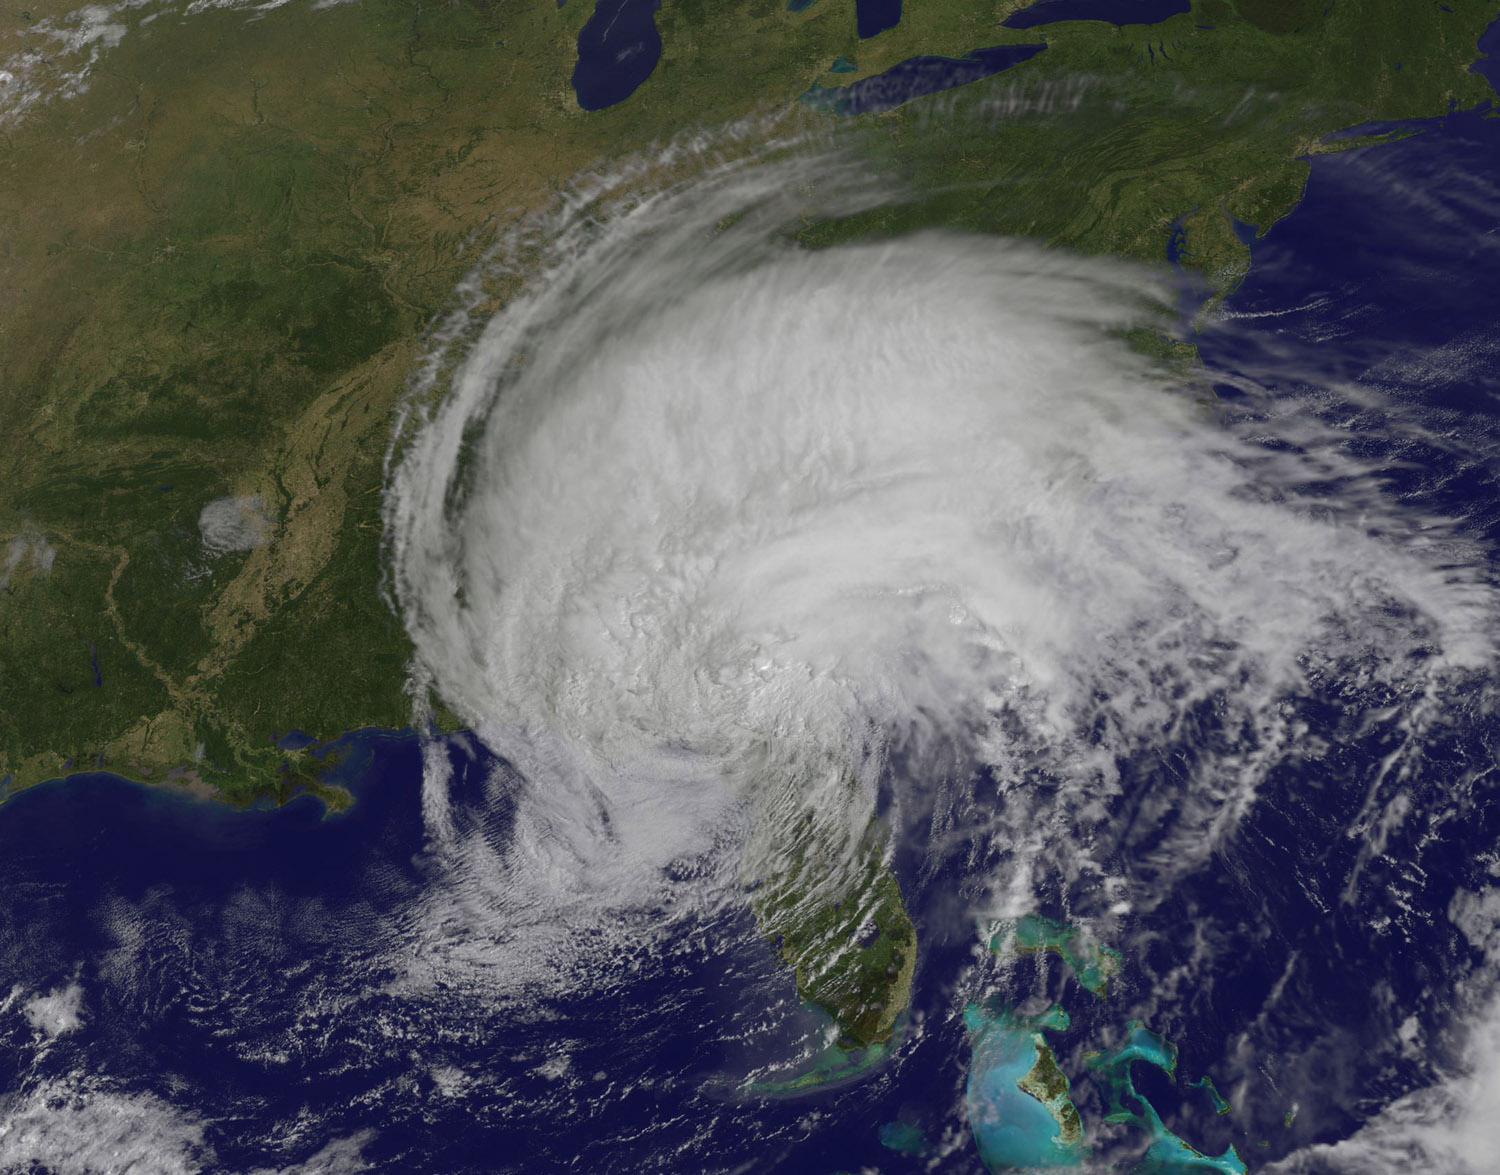
On Sept. 12, 2017 at 3:03 a.m. EDT (0703 UTC) the Visible Infrared Imaging Radiometer Suite (VIIRS) instrument aboard NASA-NOAA’s Suomi NPP satellite provided a night-time infrared image of Irma when its center of circulation was located over Georgia. The VIIRS image showed the large extent of Irma over Florida, Georgia, Alabama and the Carolinas.
The National Hurricane Center (NHC) stopped issuing advisories on Irma on September 11, 2017 at 11 p.m. (0300 UTC).
Irma’s Location on Sept. 12
At 5 a.m. EDT on Sept. 12 the center of Post-Tropical Cyclone Irma was located near 33.0 degrees north latitude and 85.2 degrees west longitude. That’s about 65 miles (110 km) southwest of Atlanta, Georgia.
NOAA’s Weather Prediction Center (WPC) said “Irma has lost its tropical characteristics in the last several hours, and is now classified as a post-tropical cyclone. Irma has been moving northwestward through the southeast U.S. and will continue this motion and approach the Tennessee valley by Tuesday afternoon, Sept. 12. Irma is expected to weaken throughout the day. Minimum central pressure is 998 millibars.
An image from NOAA’s GOES-East satellite showed Irma’s clouds covering the southeastern U.S. and extending into the Mid-Atlantic on Sept. 12 at 10 a.m. EDT (1400 UTC).
More Rainfall Expected From Post-Tropical Cyclone Irma
Irma continues to generate large rainfall. Flash flood watches are in effect for portions of the southern Appalachians and Flood warnings and advisories are ongoing scattered throughout the southeastern U.S. For local warnings and watches visit: www.weather.gov.
WPC stated “Remnant bands from Post-Tropical Cyclone Irma are expected to produce additional rain accumulations of 1 to 3 inches with isolated 5 inches through Tuesday across northern South Carolina into southern and western North Carolina. Localized intense rainfall rates will lead to additional isolated areas of flash flooding and rapid rises on creeks, streams, and rivers. Closer to Irma’s remnant circulation center, an additional 1 to 2 inches of rainfall is expected across northern Mississippi, Northwest Alabama, eastern Arkansas, western Tennessee, and western Kentucky. Significant river flooding will persist over much of the Florida peninsula in the wake of Irma, while additional river flooding will be possible across Georgia and eastern Alabama.
Credits: NASA/JAXA, Hal Pierce
For updates on Irma visit: http://www.nhc.noaa.gov/#Irma
Rob Gutro
NASA’s Goddard Space Flight Center
Sep. 12, 2017 – (Update #1) Satellite Animation Sees Post Tropical Cyclone Irma and Hurricane Jose
Credits: NASA-NOAA GOES Project
Sep. 11, 2017 – (Update #3) NASA Gets Night-Time and Daytime Look at a Weaker Wide Irma
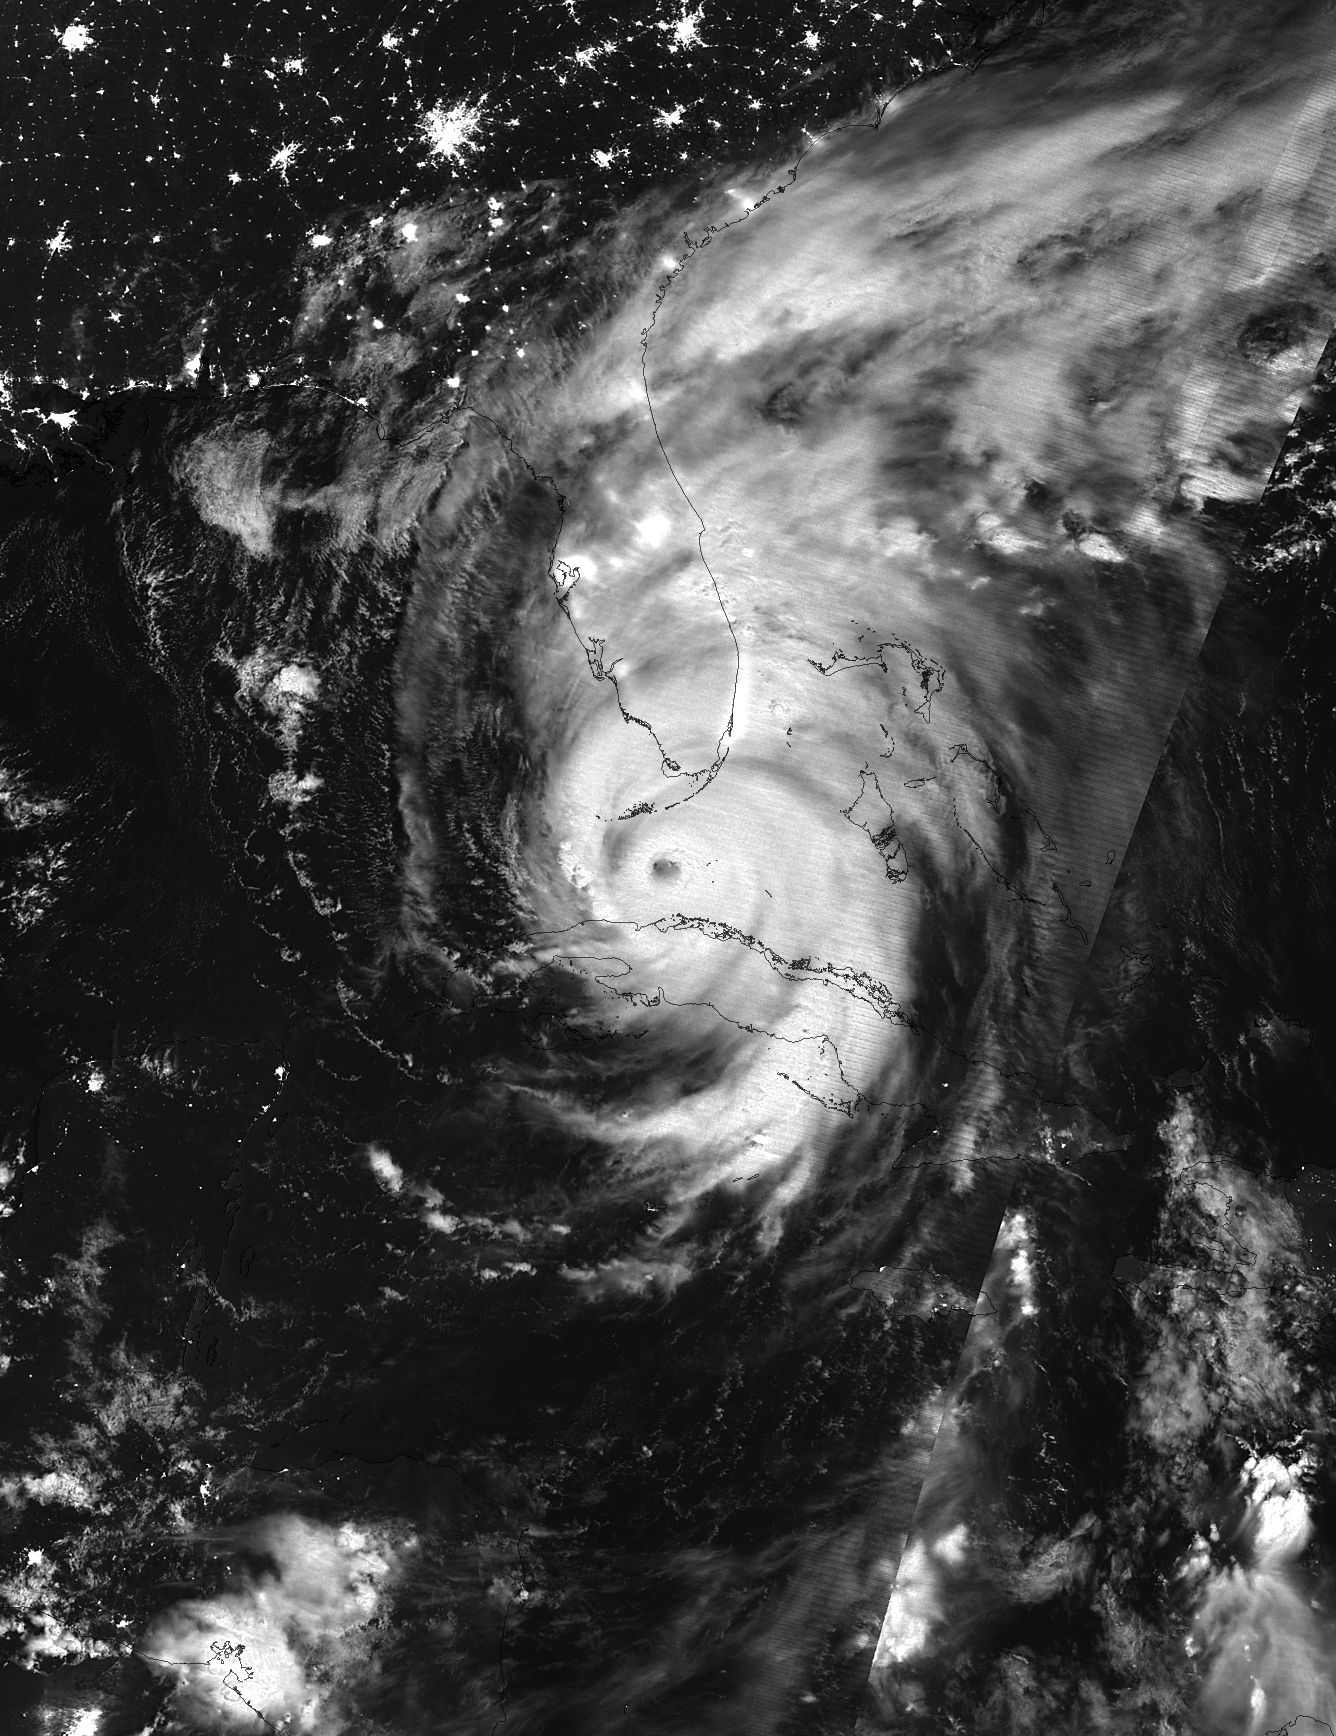
NASA-NOAA’s Suomi NPP satellite captured night-time look at Hurricane Irma as it weakened to a large tropical storm and the GOES East satellite provided a daytime view as the large storm continued moving north over Florida.

Irma made landfall twice on Sept. 10, first in the Florida Keys and then near Naples. The storm has now been downgraded to a tropical storm but could still cause significant impacts over Georgia and Alabama. NASA’s Marshall Space Flight Center in Huntsville, Alabama was under a Tropical Storm Watch on Sept. 11.
At 3:21 a.m. EDT (0721 UTC), Sept. 11, the Visible Infrared Imaging Radiometer Suite (VIIRS) instrument aboard NASA-NOAA’s Suomi NPP satellite provided an night-time infrared image of Irma. The VIIRS image showed the large extent of Irma over Florida, Georgia, Alabama and the Carolinas.
After sunrise, NOAA’s GOES East satellite provided a daytime look at Tropical Storm Irma as it continued to move north up the Florida Peninsula. The large storm covered a large area in the southeastern U.S. The image was created by the NASA/NOAA GOES Project at NASA’s Goddard Space Flight Center in Greenbelt, Maryland. Irma remains a large tropical cyclone.
The National Hurricane Center said “Tropical-storm-force winds extend outward up to 415 miles (665 km) from the center.” That makes the storm more than 830 miles in diameter since the cloud cover extends farther out than the tropical storm-force winds.
Warnings and Watches
At 11 a.m. EDT on Sept. 11, the National Hurricane Center noted that a Storm Surge Warning is in effect for South Santee River southward to the Flagler/Volusia County line, Florida; from north of Bonita Beach to the Ochlockonee River and for Tampa Bay.
A Tropical Storm Warning is in effect for Anclote River to the Okaloosa/Walton County Line and north of the Volusia/Brevard County line to the South Santee River.
Irma’s Status on Sept. 11 at 11 a.m. EDT
At 11 a.m. EDT (1500 UTC), the center of Tropical Storm Irma was located near 30.3 degrees north latitude and 83.1 degrees west longitude. That’s about 70 miles (115 km) east of Tallahassee, Florida.
Irma was moving toward the north-northwest near 17 mph (28 kph), and this motion is expected to continue through Tuesday. On the forecast track, the center of Irma will move into southwestern Georgia later today, and move into eastern Alabama Tuesday morning, Sept. 12. The estimated minimum central pressure is 975 millibars.
Maximum sustained winds have decreased to near 65 mph (100 kph) with higher gusts. The NHC said continued slow weakening is forecast, and Irma is likely to become a tropical depression on Tuesday.
For updated forecasts on Irma, visit: www.nhc.noaa.gov
Rob Gutro
NASA’s Goddard Space Flight Center
Sep. 11, 2017 – (Update #2) Hurricane Irma Turns Caribbean Islands Brown
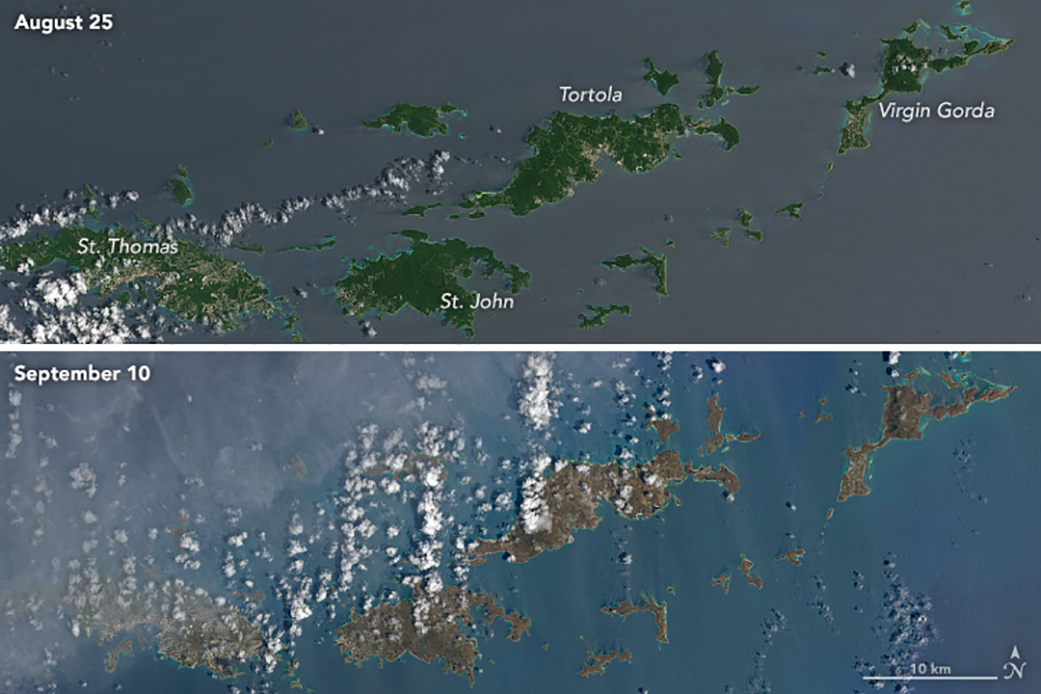
Hurricane Irma churned across the Atlantic Ocean in September 2017, battering several Caribbean islands before moving on to the Florida Keys and the U.S. mainland. As the clouds cleared over places like the Virgin Islands, the destruction became obvious even from space.
These natural-color images, captured by the Operational Land Imager (OLI) on the Landsat 8 satellite, show some of Irma’s effect on the British and U.S. Virgin Islands. The views were acquired on August 25 and September 10, 2017, before and after the storm passed. They are among the few relatively cloud-free satellite images of the area so far.
The most obvious change is the widespread browning of the landscape. There are a number of possible reasons for this. Lush green tropical vegetation can be ripped away by a storm’s strong winds, leaving the satellite with a view of more bare ground. Also, salt spray whipped up by the hurricane can coat and desiccate leaves while they are still on the trees.
Irma passed the northernmost Virgin Islands on the afternoon of September 6. At the time, Irma was a category 5 storm with maximum sustained winds of 185 miles (295 kilometers) per hour. According to news reports, the islands saw “significant devastation.”
For more images and info on this story, please visit: https://earthobservatory.nasa.gov/NaturalHazards/view.php?id=90952
Kathryn Hansen
NASA’s Earth Observatory
Sep. 11, 2017 – (Update #1) Satellite Animation Sees Irma Move Through Florida
Credits: NASA-NOAA GOES Project
Sep. 10. 2017 – NASA Sees Hurricane Irma Affecting South Florida
As Hurricane Irma approached southern Florida, a NASA satellite captured a night-time image of the storm in the Florida Straits and identified where the strongest storms were occurring within Irma’s structure. NOAA’s GOES satellite provided a visible image at the time of Irma’s landfall in the Florida Keys.
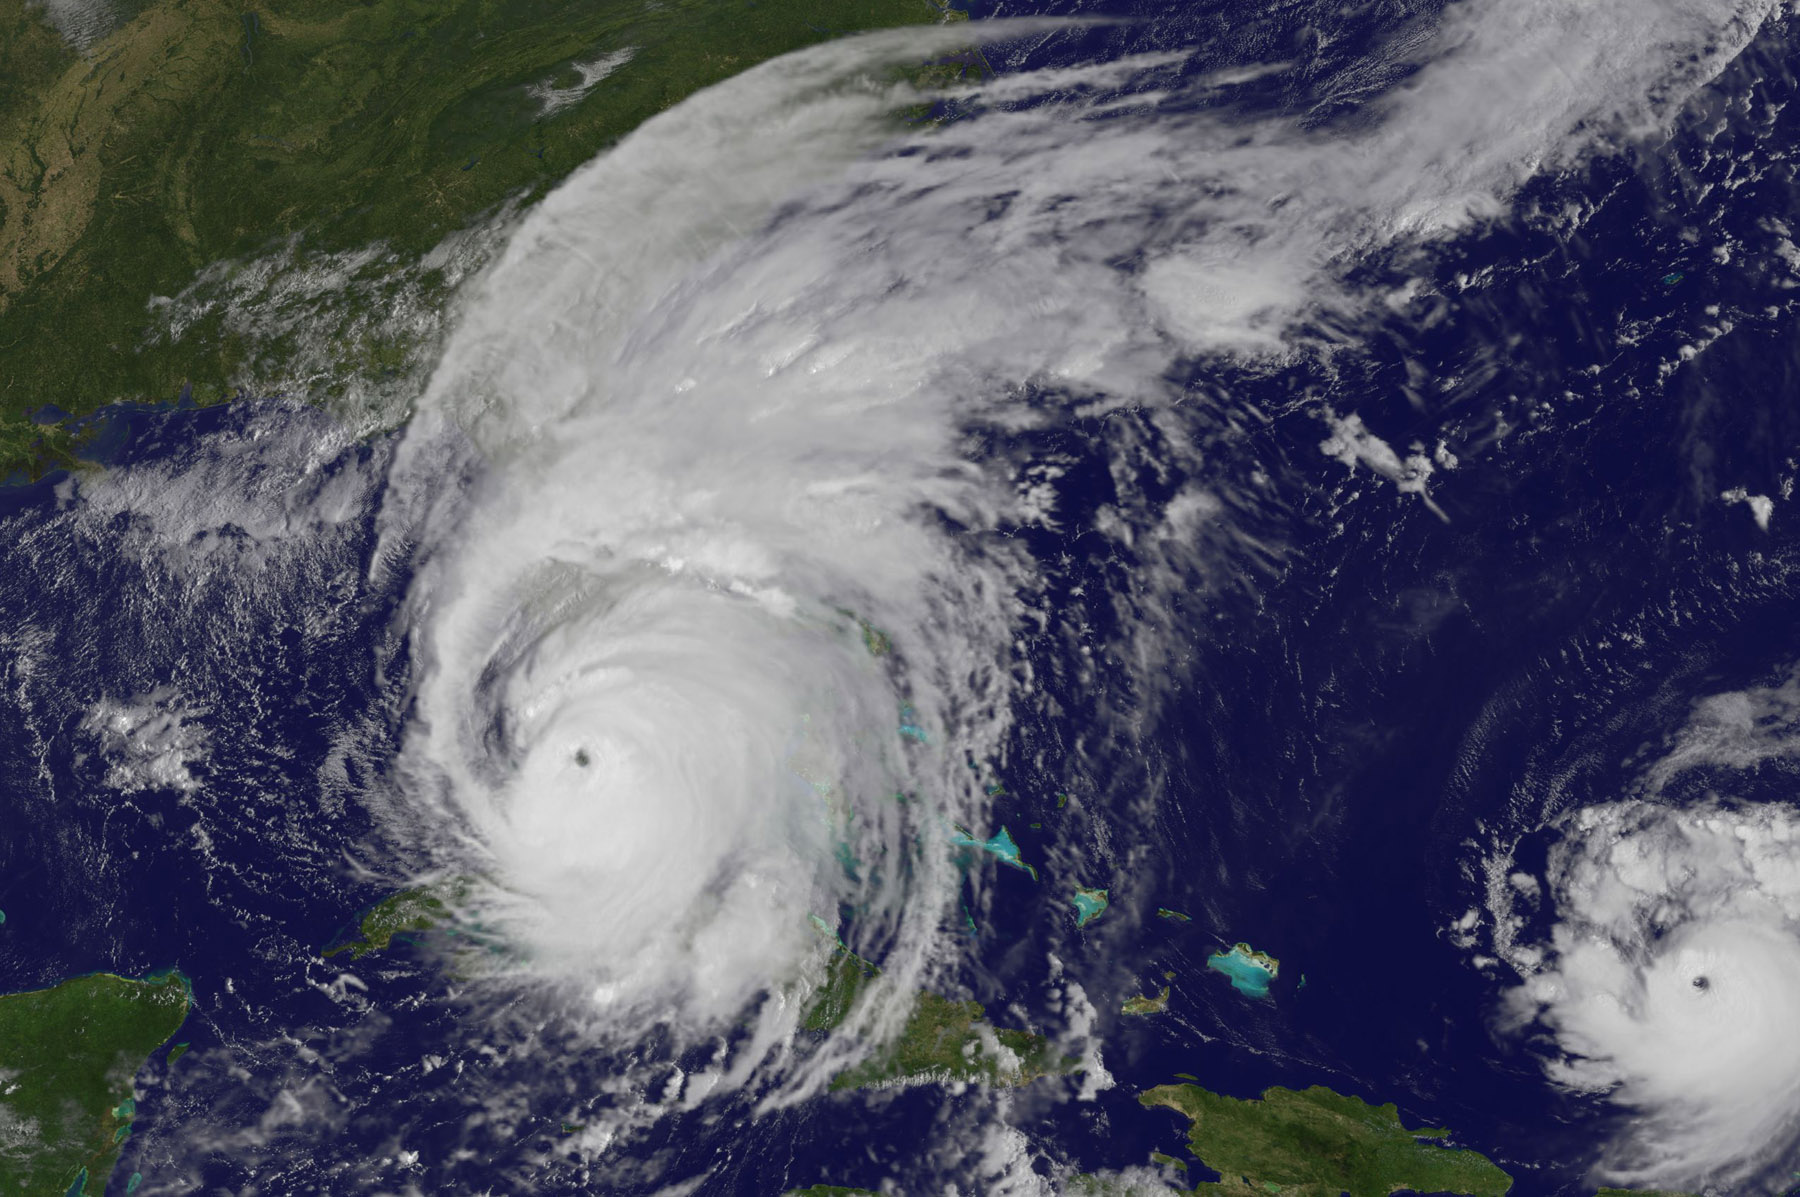
As Irma moved along the coast of Cuba, the storm weakened to a Category 3 Hurricane on the Saffir-Simpson Hurricane Wind Scale. After moving away from the northern coast of Cuba, Irma passed over waters that are warmer than 30 degrees Celsius (86 degrees Fahrenheit). Those warm waters enabled the storm to re-strengthen from a Category 3 hurricane to a Category 4 hurricane.
On Sept. 10, at 3:38 a.m. EDT (0738 UTC) the Visible Infrared Imaging Radiometer Suite (VIIRS) instrument aboard NASA-NOAA’s Suomi NPP satellite captured an infrared view of Irma at night as it moved north from the northern coast of Cuba toward the Florida Keys. The image revealed that Irma’s eye had become clear again. The image also showed the city lights in the southeastern U.S.
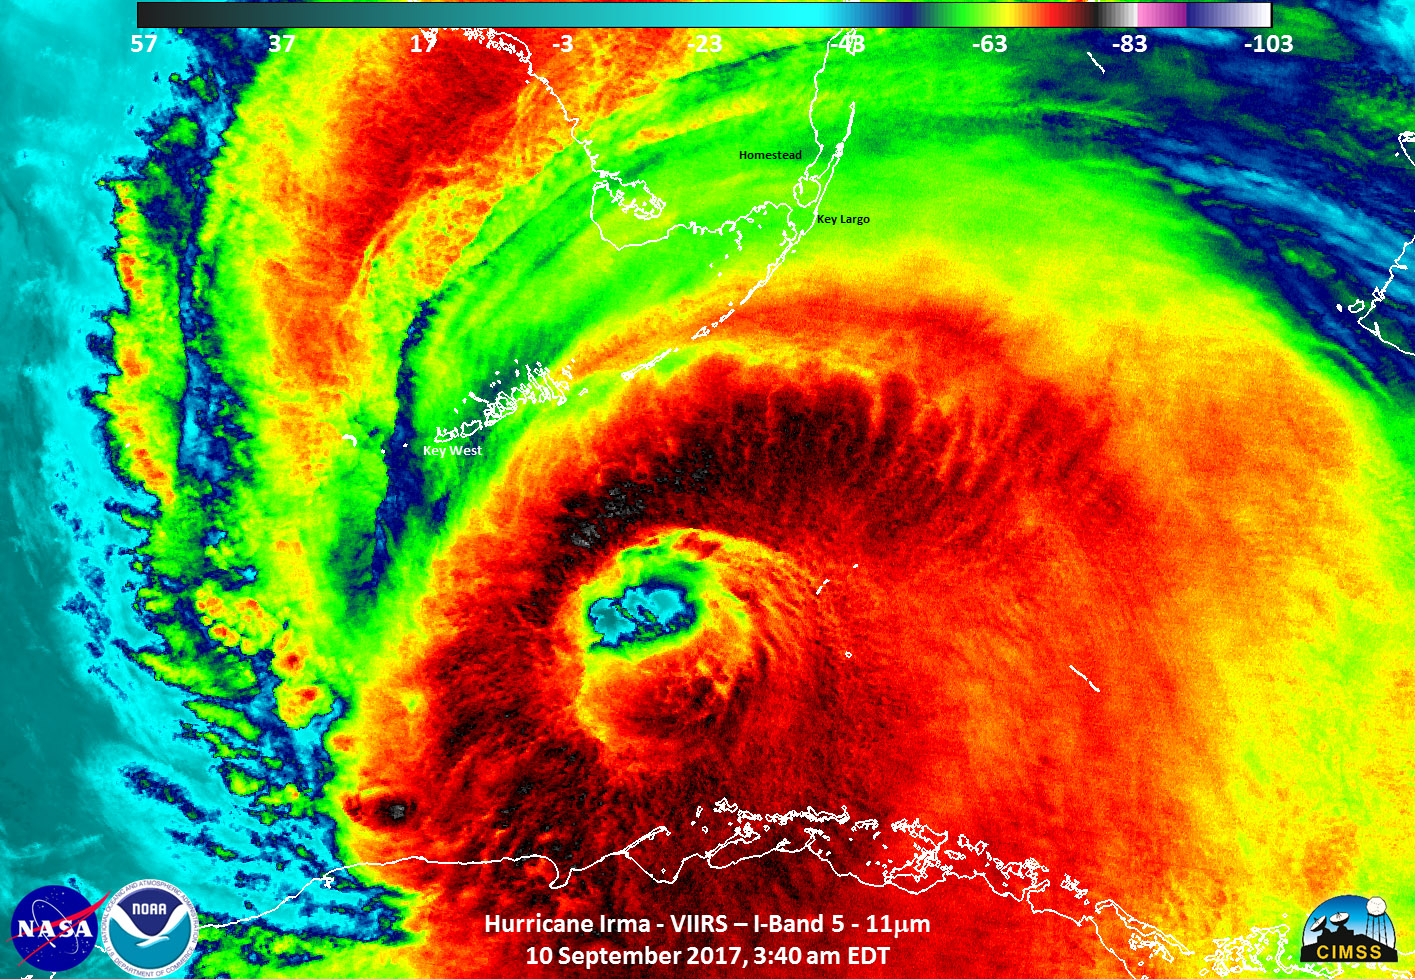
VIIRS also showed temperatures of Irma’s cloud tops to indicate where the strongest part of the hurricane is located. The coldest cloud top temperatures indicate the strongest storms. The VIIRS image showed the well-defined eye of Irma with strong thunderstorms around the eye which is indicative of an intense tropical system. Strongest thunderstorms with coldest cloud tops were as cold as 190.1 Kelvin (minus 83 degrees Celsius/minus 117.4 degrees Fahrenheit).
At 9:10 a.m. EDT on Sept. 10, Irma made landfall at Cudjoe Key in lower Florida Keys.
Fifteen minutes later NOAA’s GOES East satellite captured an image when Irma’s eye was moving over Cudjoe Key, and toward Florida’s southwestern coast. Irma had re-strengthened into a Category 4 hurricane and the GOES satellite image showed that the eye became clear again.
Warnings and Watches in Effect on Sunday, September 10
A Storm Surge Warning is in effect for south Santee River southward to Jupiter Inlet, north Miami Beach southward around the Florida peninsula to the Ochlockonee River, the Florida Keys and Tampa Bay.
A Hurricane Warning is in effect from Fernandina Beach southward around the Florida peninsula to Indian Pass, the Florida Keys, Lake Okeechobee, Florida Bay and the Cuban provinces of Matanzas and La Habana. A Hurricane Watch is in effect from north of Fernandina Beach to Edisto Beach.
A Tropical Storm Warning is in effect from west of Indian Pass to the Okaloosa/Walton County Line and north of Fernandina Beach to South Santee River. A Tropical Storm Watch is in effect for Bimini and Grand Bahama.
Hurricane Irma at 8 a.m. EDT on Sunday, September 10
Credits: NASA-NOAA GOES Project
At 8 a.m. EDT (1200 UTC) on Sept. 10 the center of Hurricane Irma was located about 20 miles (30 km) east-southeast of Key West, Florida near 24.5 degrees north latitude and 81.5 degrees west longitude.
The National Hurricane Center said “Irma is moving toward the north-northwest near 8 mph (13 kph), and an increase in forward speed is expected later today, with that motion continuing through Monday, Sept. 11.
Maximum sustained winds are near 130 mph (215 kph) with higher gusts. Irma is a category 4 hurricane on the Saffir-Simpson Hurricane Wind Scale. Hurricane-force winds extend outward up to 80 miles (130 km) from the center and tropical-storm-force winds extend outward up to 220 miles (350 km). The estimated minimum central pressure is 929 millibars.
For updates on Irma and effects of wind, storm surge and rainfall, visit the National Hurricane Center website: www.nhc.noaa.gov.
Rob Gutro
NASA’s Goddard Space Flight Center
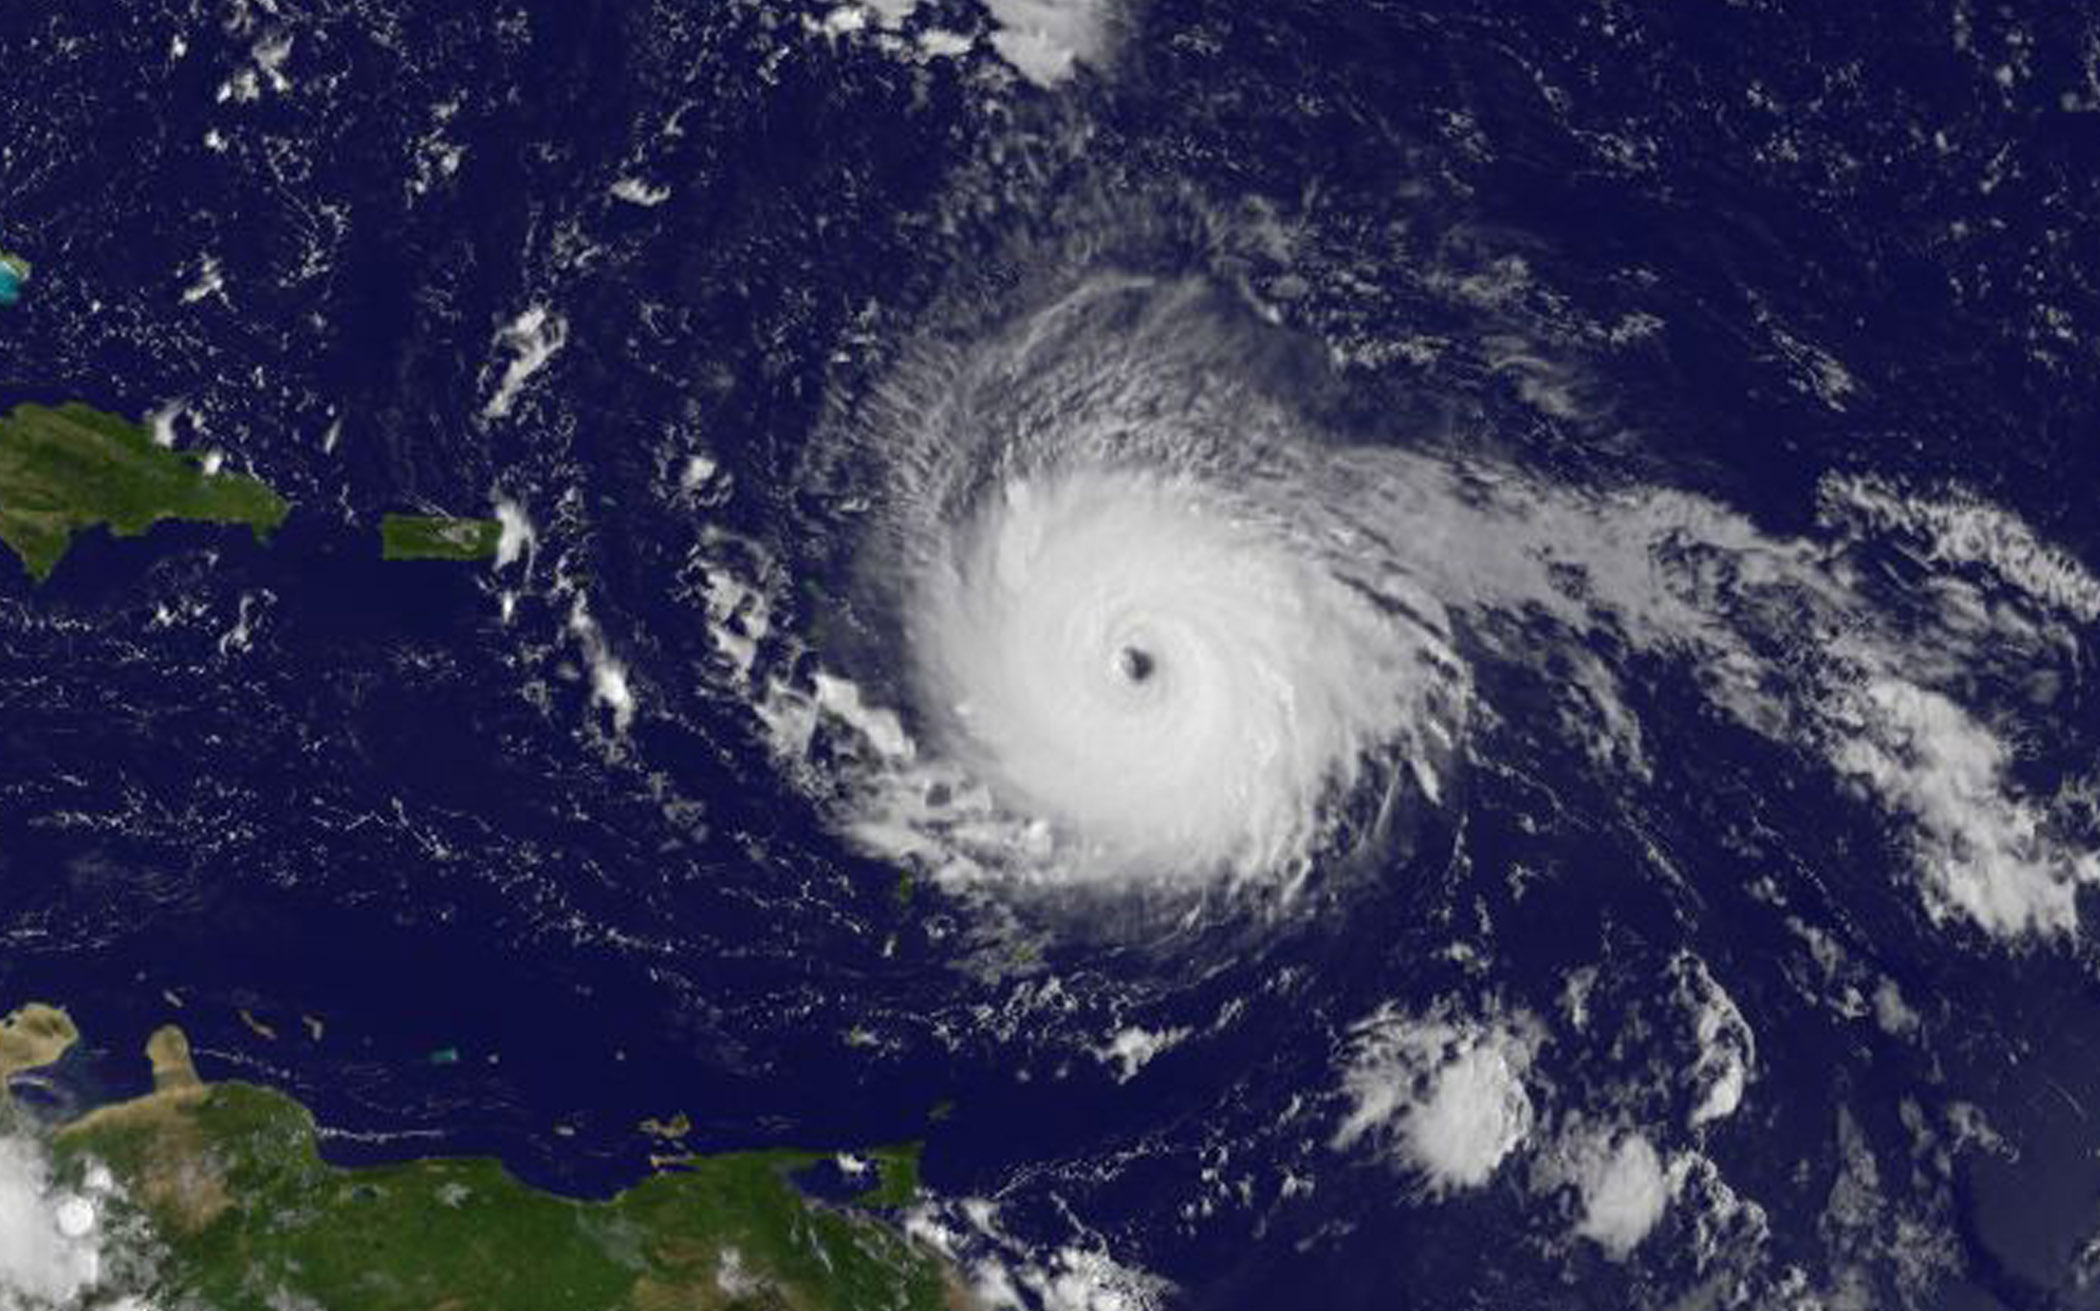
Sep. 09, 2017 – NASA Sees Hurricane Irma’s Eye Along Cuba’s Coast
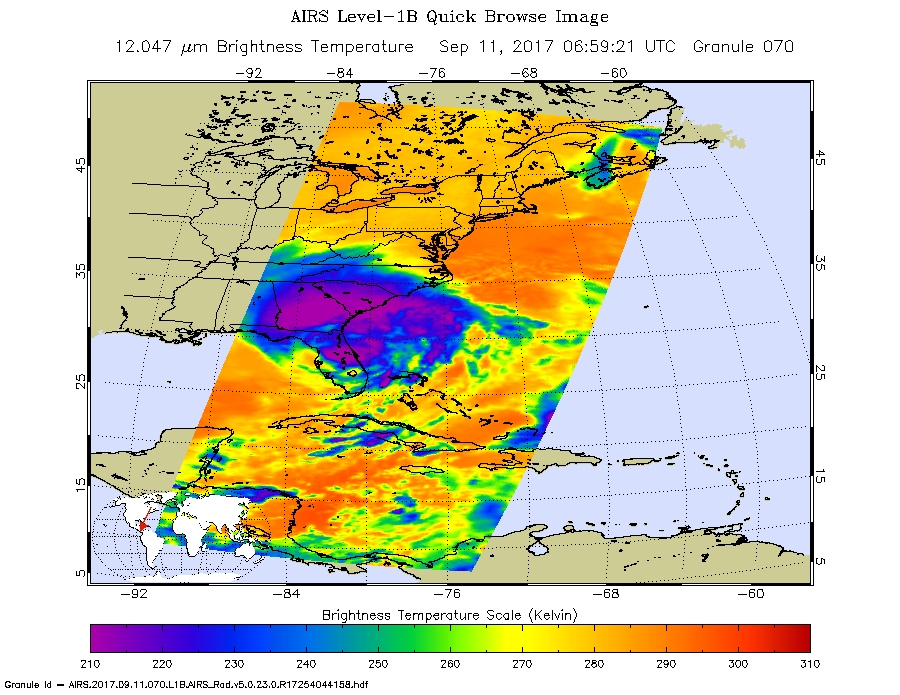
Hurricane Irma was moving up Cuba’s northern coast when NASA’s Aqua satellite passed overhead. A satellite instrument revealed coldest temperatures of powerful thunderstorm tops surrounding Irma’s eye and in a band of thunderstorms over the Florida Keys.
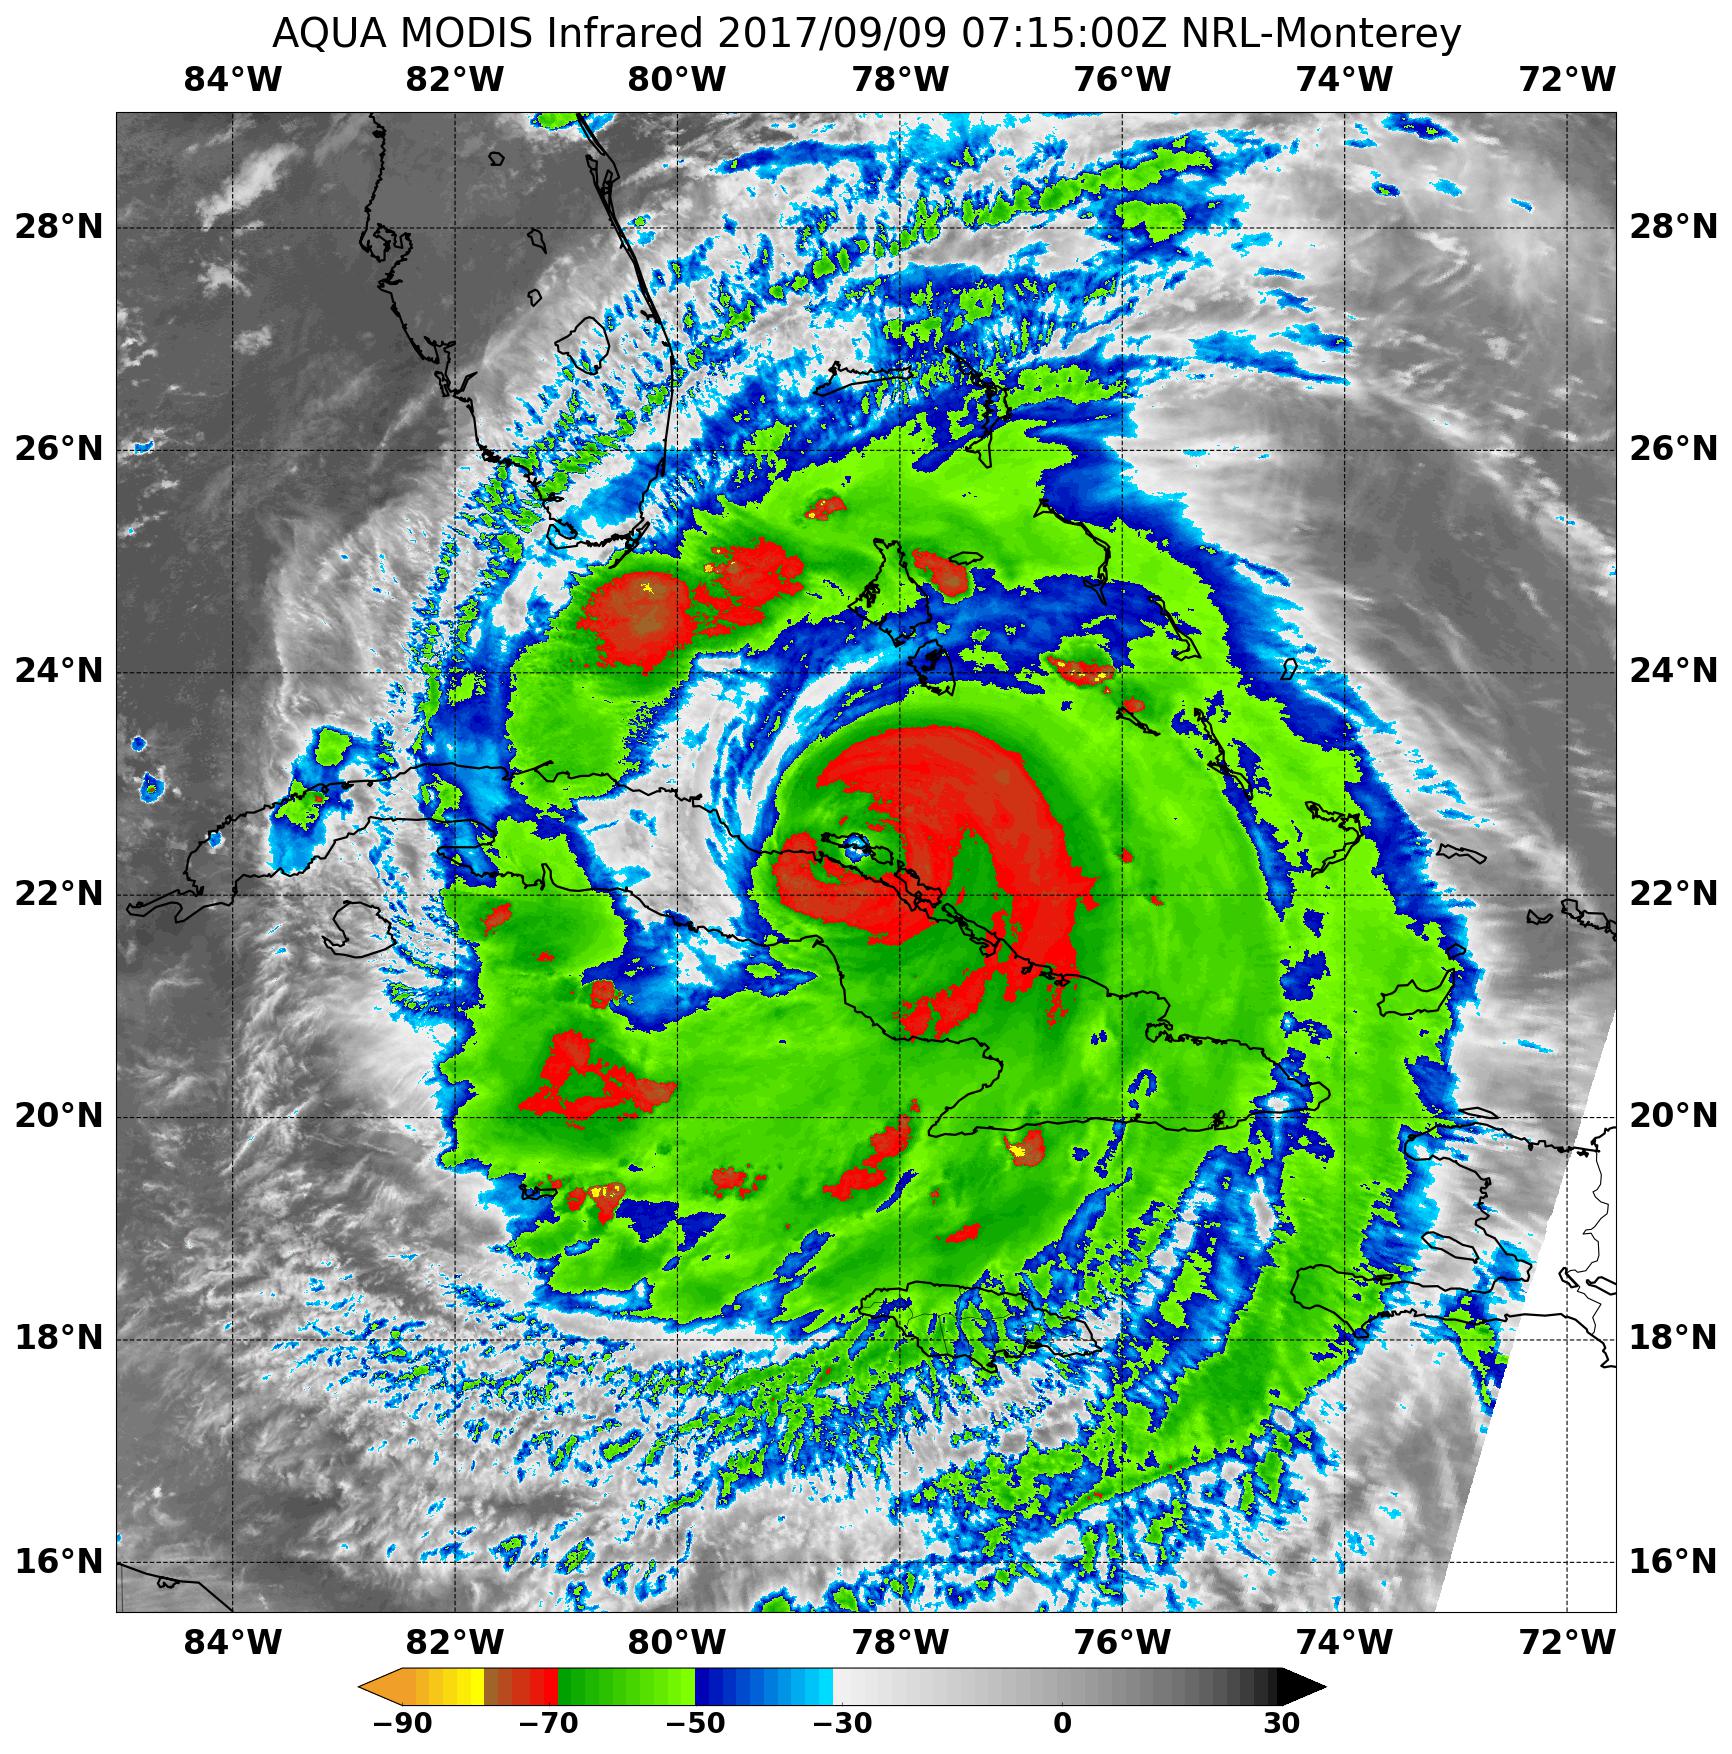
Infrared MODIS data showed two areas with very cold cloud top temperatures of strong thunderstorms. They were around center of circulation and in a band of thunderstorms north of the center, where temperatures were as cold as minus 80 degrees Fahrenheit (minus 62.2 Celsius). Temperatures that cold indicate strong uplift in the storm and cloud tops high into the troposphere. NASA research has shown that storms with cloud tops that cold have the ability to generate heavy rain.
Warnings and Watches
At 11 a.m. EDT the National Hurricane Center noted many warnings and watches in effect.
A Storm Surge Warning is in effect for Volusia/Brevard County line southward around the Florida peninsula to the Suwanee River, the Florida Keys and Tampa Bay. A Storm Surge Watch is in effect from north of the Volusia/Brevard County line to the Isle of Palms, South Carolina, and north of the Suwanee River to Ochlockonee River.
Credits: NASA-NOAA GOES Project
A Hurricane Warning is in effect for Fernandina Beach southward around the Florida peninsula to the Aucilla River, the Florida Keys, Lake Okeechobee, Florida Bay. A Hurricane Warning is also in effect for the Cuban provinces of Camaguey, Ciego de Avila, Sancti Spiritus, Villa Clara, Matanzas, and Havana, Andros Island, Bimini and Grand Bahama. A Hurricane Watch is in effect from north of Fernandina Beach to Edisto Beach, west of the Aucilla River to Indian Pass, Florida. A Hurricane Watch is also in effect for the Cuban provinces of Holguin and Las Tunas.
A Tropical Storm Warning is in effect for Cuban provinces of Holguin, Las Tunas, and a Tropical Storm Watch is in effect from north of Edisto Beach to South Santee River and west of Indian Pass to the Okaloosa/Walton County Line.
Hurricane Irma at 11 a.m. EDT on Saturday, September 9, 2017
At 11 a.m. EDT (1500 UTC), the eye of Hurricane Irma was located by a reconnaissance plane and radar near latitude 22.8 North, longitude 79.8 West. Irma is moving toward the west along the north coast of Cuba at near 9 mph (15 km/h). A northwest motion is expected to begin later today with a turn toward the north-northwest on Sunday.
Maximum sustained winds are near 125 mph (205 km/h) with higher gusts. Irma is a category 3 hurricane on the Saffir-Simpson Hurricane Wind Scale. Irma is forecast to re-strengthen once it moves away from Cuba, and Irma is expected to remain a powerful hurricane as it approaches Florida. Hurricane-force winds extend outward up to 70 miles (110 km) from the center and tropical-storm-force winds extend outward up to 195 miles (315 km). The minimum central pressure reported by an Air Force plane was 941 millibars.
On the forecast track, the core of Irma will continue to move near or over the north coast of Cuba later today, and will reach the Florida Keys Sunday morning. The hurricane is expected to move along or near the southwest coast of Florida Sunday afternoon.
For updates on Irma and effects of wind, storm surge and rainfall, visit the National Hurricane Center website: www.nhc.noaa.gov.
Rob Gutro
NASA’s Goddard Space Flight Center
Sep. 08, 2017 – (Update #3) ISS Pass Over Hurricane Jose and Hurricane Irma 9/8/17
Credits: NASA
Raw footage download
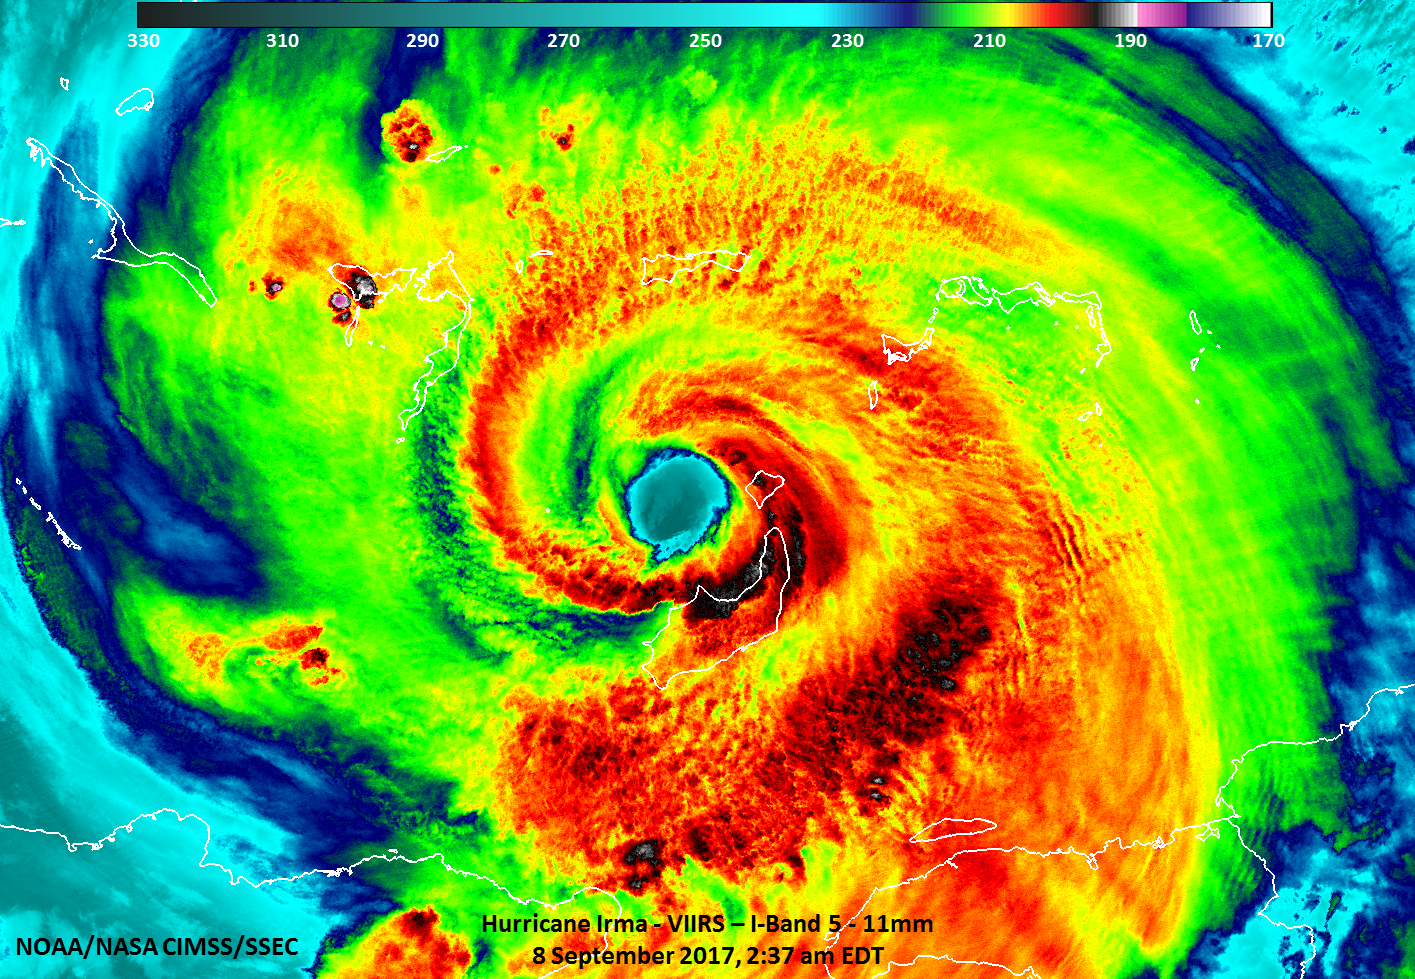
Sep. 08, 2017 – (Update #2) NASA’s Fleet of Satellites Covering Powerful Hurricane Irma
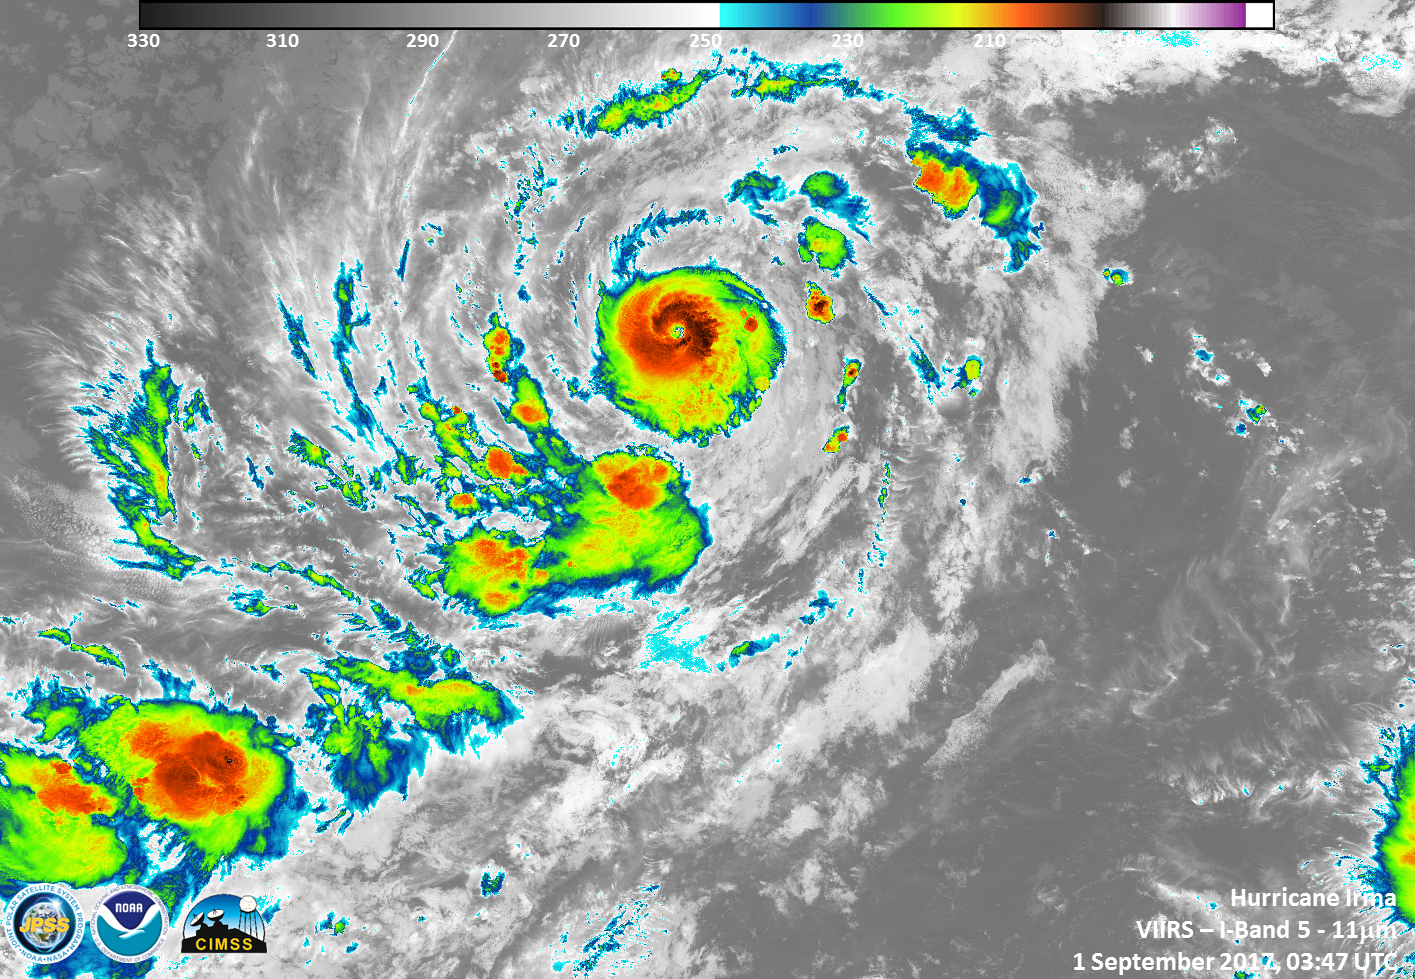
NASA’s fleet of satellites have been continually providing forecasters with data on Hurricane Irma. NASA-NOAA’s Suomi NPP satellite provided a look at the wide-eye of Irma and if you think about the area of maximum sustained winds around the eye, it’s similar to a wide F2 tornado.
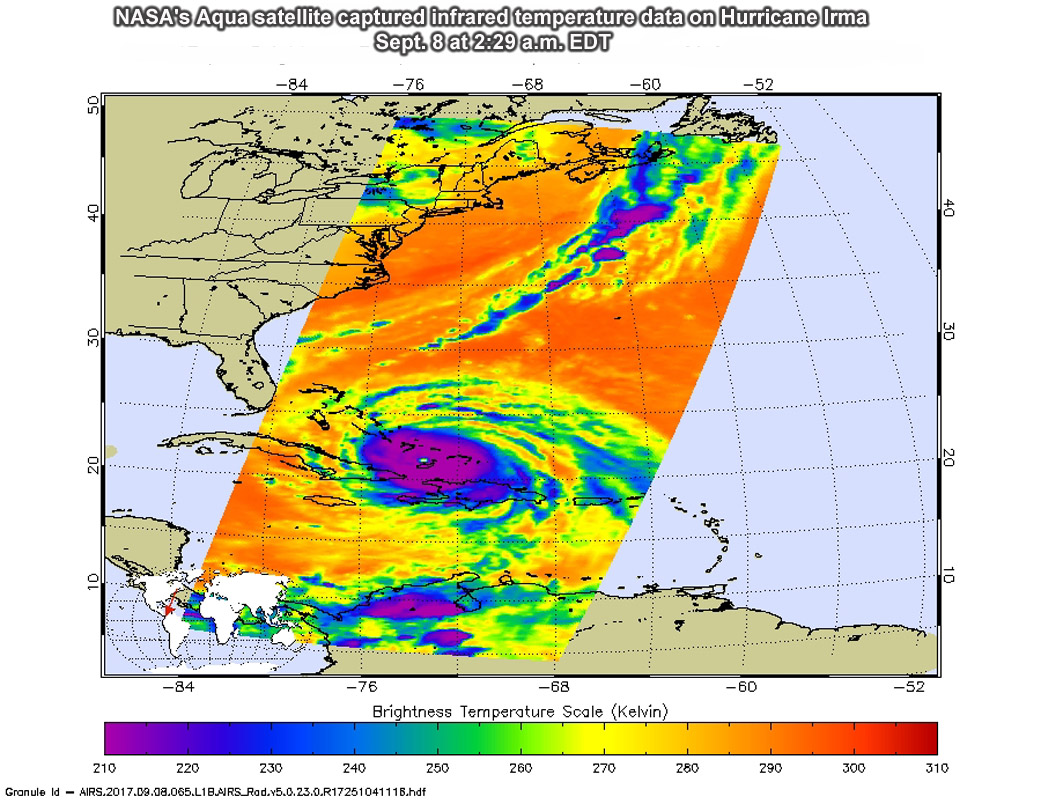
The Atmospheric Infrared Sounder or AIRS instrument aboard NASA’s Aqua satellite captured infrared temperature data on Hurricane Irma on Sept. 8 at 2:29 a.m. EDT (0629 UTC). The image showed very cold cloud top temperatures colder than minus 63 degrees Fahrenheit (minus 53 degrees Celsius) in the storm, stretching over Hispaniola, eastern Cuba and the Bahamas. NASA research has shown that cloud tops that cold are high in the troposphere and have the potential to generate heavy rainfall.
The Visible Infrared Imaging Radiometer Suite (VIIRS) instrument aboard NASA-NOAA’s Suomi NPP satellite provided an infrared look at the thunderstorms throughout Irma on Sept. 9 at 2:39 a.m. EDT. The VIIRS image showed the well-defined eye of Irma with strong thunderstorms around the eye which is indicative of an intense tropical system. Strongest thunderstorms with coldest cloud tops were as cold as 195 Kelvin (minus 78.1 degrees Celsius/minus 108.7 degrees Fahrenheit).
NOAA’s GOES East satellite captured an infrared image of Hurricane Irma in the Bahamas at 4:45 a.m. EDT that showed a clear eye and a symmetrical, powerful Category 4 hurricane. NOAA manages the GOES series of satellites and the NASA/NOAA GOES Project at NASA’s Goddard Space Flight Center in Greenbelt, Maryland produces images and animations from that data.
NASA uses a constellation of domestic and international satellites to better understand the rainfall accumulations of Irma, wind speeds, and impacts as the storm makes landfall.
Irma’s Area of Maximum Sustained Winds Like a Wide Tornado
The National Hurricane Center (NHC) noted that hurricane-force winds extend outward up to 70 miles (110 km) from the center and tropical-storm-force winds extend outward up to 185 miles (295 km). Maximum sustained winds are near 150 mph (240 kph) with higher gusts.
Scott Braun, research meteorologist at NASA Goddard said that “Hurricane force winds mean greater than 64 knots and tropical storm force winds are greater than 34 knots. The actual diameter of hurricane force winds is 120 miles. However, that is just for greater than 64 knots. The area with greater than 150 mph wind will be smaller.”
The area of maximum sustained winds near 150 mph fluctuate but on average have been about 25 miles out from the eye. Using that as average, if you think of the power of these rotating winds compared to a tornado, it would be would be similar to a 50-mile wide F2 tornado on the Fujita Scale (with maximum winds between 113 and 157 mph).
Warnings and Watches on Sept. 9
At 11 a.m. EDT on Sept. 9, the National Hurricane Center (NHC) had a Storm Surge Warning is in effect for Sebastian Inlet southward around the Florida peninsula to Venice, Florida, and the Florida Keys. A Storm Surge Watch is in effect from North of Sebastian Inlet to Ponce Inlet.
A Hurricane Warning is in effect for Jupiter Inlet southward around the Florida peninsula to Bonita Beach, Florida; the Florida Keys; Lake Okeechobee; Florida Bay; the Southeastern Bahamas and the Turks and Caicos Islands; the Cuban provinces of Camaguey, Ciego de Avila, Sancti Spiritus, and Villa Clara; the Central Bahamas and the Northwestern Bahamas.
A Hurricane Watch is in effect from north of Jupiter Inlet to the Flagler/Volusia County Line; north of Bonita Beach to Anclote River and the Cuban provinces of Guantanamo, Holguin, Las Tunas and Matanzas. A Tropical Storm Warning is in effect for the Cuban provinces of Guantanamo, Holguin, and Las Tunas.
Irma’s Location at 11 a.m. EDT on Sept. 8
At 11 a.m. EDT (1500 UTC), the NHC said the distinct eye of Hurricane Irma was located near 22.0 degrees north latitude and 75.3 degrees west longitude. That’s 405 miles (655 km) southeast of Miami, Florida.
Irma was moving toward the west-northwest near 14 mph (22 kph), and this motion is expected to continue for the next day or so with a decrease in forward speed. A turn toward the northwest is expected by late Saturday, Sept. 9. Maximum sustained winds are near 150 mph (240 kph) with higher gusts. Irma is a category 4 hurricane on the Saffir-Simpson Hurricane Wind Scale. Some fluctuations in intensity are likely during the next day or two, but Irma is forecast to remain a powerful category 4 hurricane as it approaches Florida.
Hurricane-force winds extend outward up to 70 miles (110 km) from the center and tropical-storm-force winds extend outward up to 185 miles (295 km). The latest minimum central pressure reported by both Air Force and NOAA Hurricane Hunter planes was 927 millibars.
Key Cautions to Remember
NHC noted several key cautions to keep in mind:
1. Irma is an extremely dangerous Category 4 hurricane and will continue to bring life-threatening wind, storm surge, and rainfall hazards to the Bahamas through Saturday.
2. Irma is likely to make landfall in Florida as a dangerous major hurricane, and will bring life-threatening wind impacts to much of the state regardless of the exact track of the center.
3. There is the danger of life-threatening storm surge inundation in southern Florida and the Florida Keys during the next 36 hours, where a Storm Surge Warning is in effect.
4. Irma is expected to produce very heavy rain and inland flooding. Total rain accumulations of 4 to 12 inches, with isolated amounts of 20 inches are expected over the Florida peninsula Saturday through Monday.
On the NHC forecast track, the eye of Irma should move near the north coast of Cuba and the central Bahamas today and Saturday, and be near the Florida Keys and the southern Florida Peninsula Sunday morning, Sept. 10.
For updates on Irma visit: www.nhc.noaa.gov
Rob Gutro
NASA’s Goddard Space Flight Center
Sep. 08, 2017 – (Update #1) Satellite Animation Sees Hurricanes Katia, Irma and Jose
Credits: NASA-NOAA
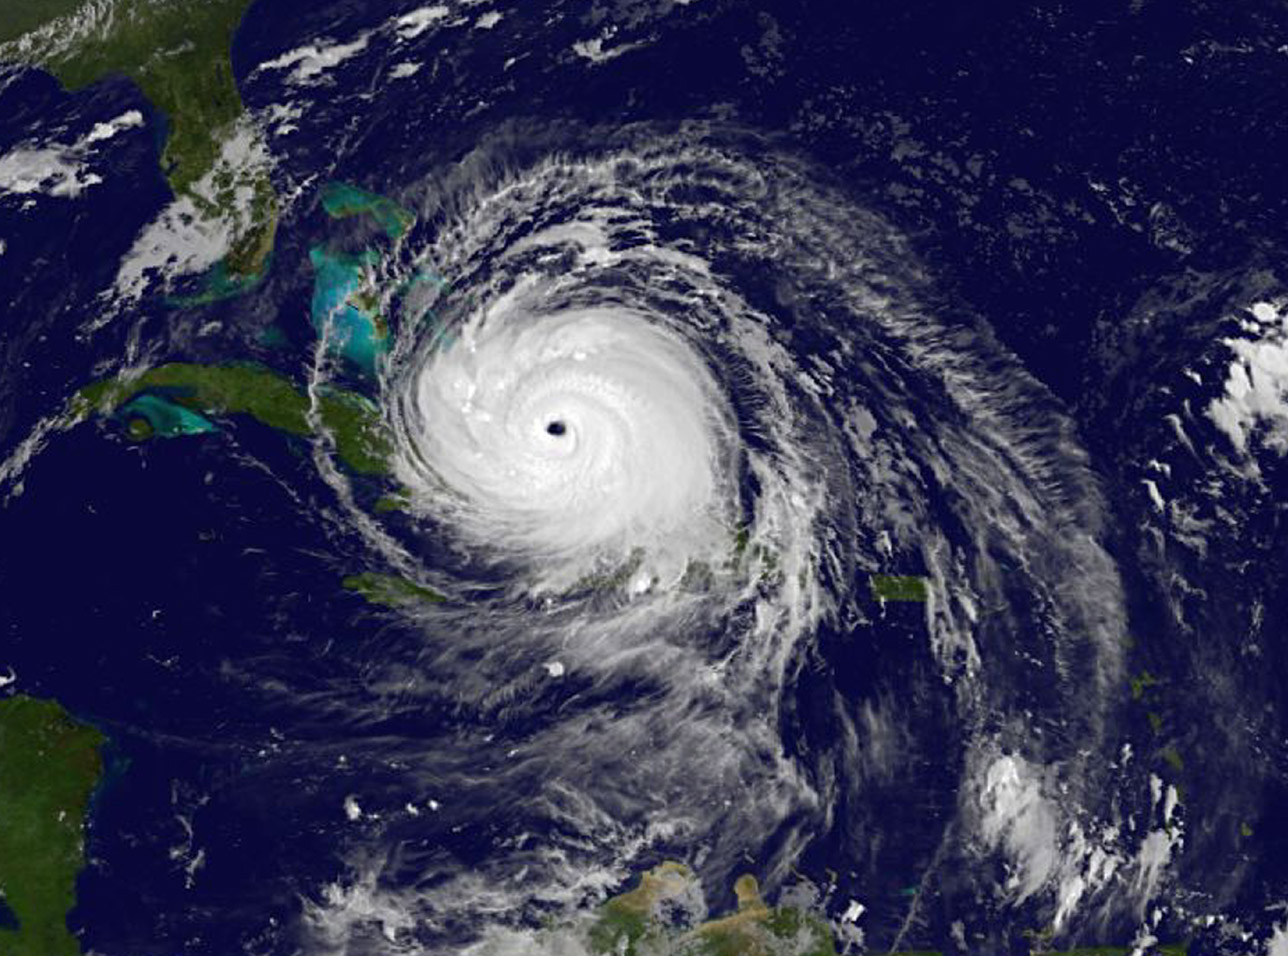
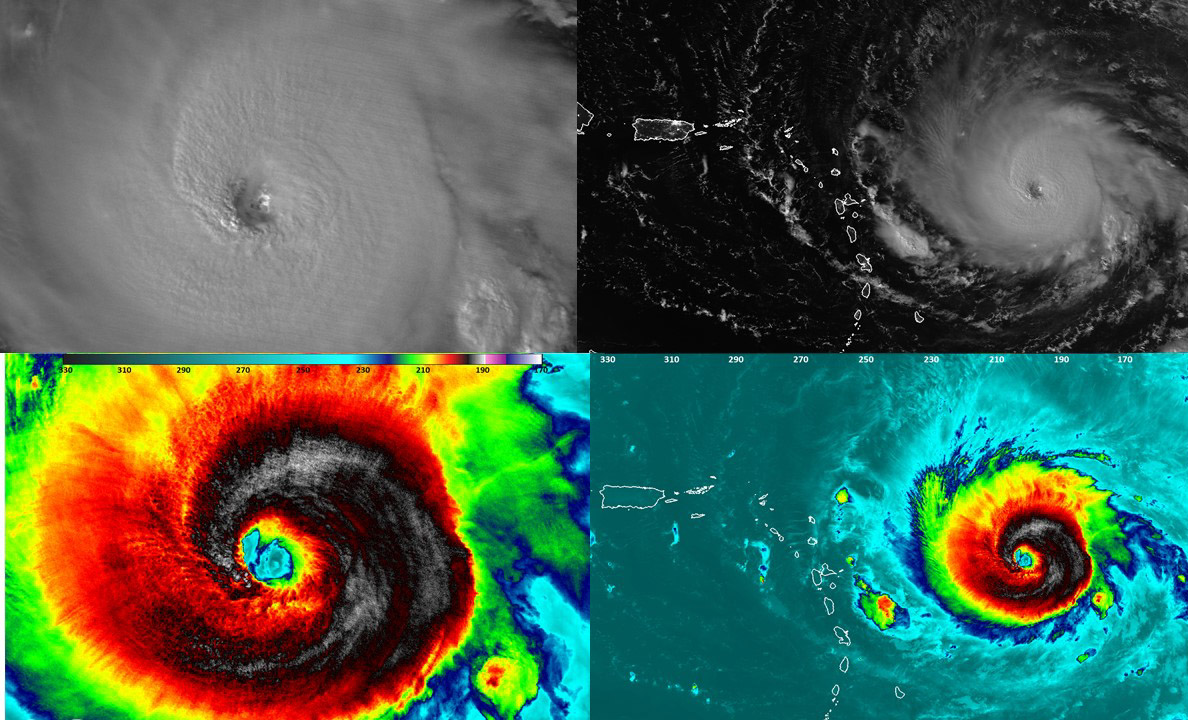
Sep. 07, 2017 – (Update #3) – Satellites Show Different Sides of Hurricane Irma
Satellite imagery from NASA’s Aqua satellite and NASA-NOAA’s Suomi NPP satellite have provided different data on the still Category 5 Hurricane Irma as it headed for the Turks and Caicos Islands.
NASA’s Aqua Satellite Imagery
On Sept. 6 at 1:45 p.m. EDT (1745 UTC) the Moderate Resolution Imaging Spectroradiometer or MODIS instrument aboard NASA’s Aqua satellite captured a visible-light image of Hurricane Irma over the Leeward Islands and Puerto Rico. The image revealed a clear eye with powerful bands of thunderstorms circling the eye.
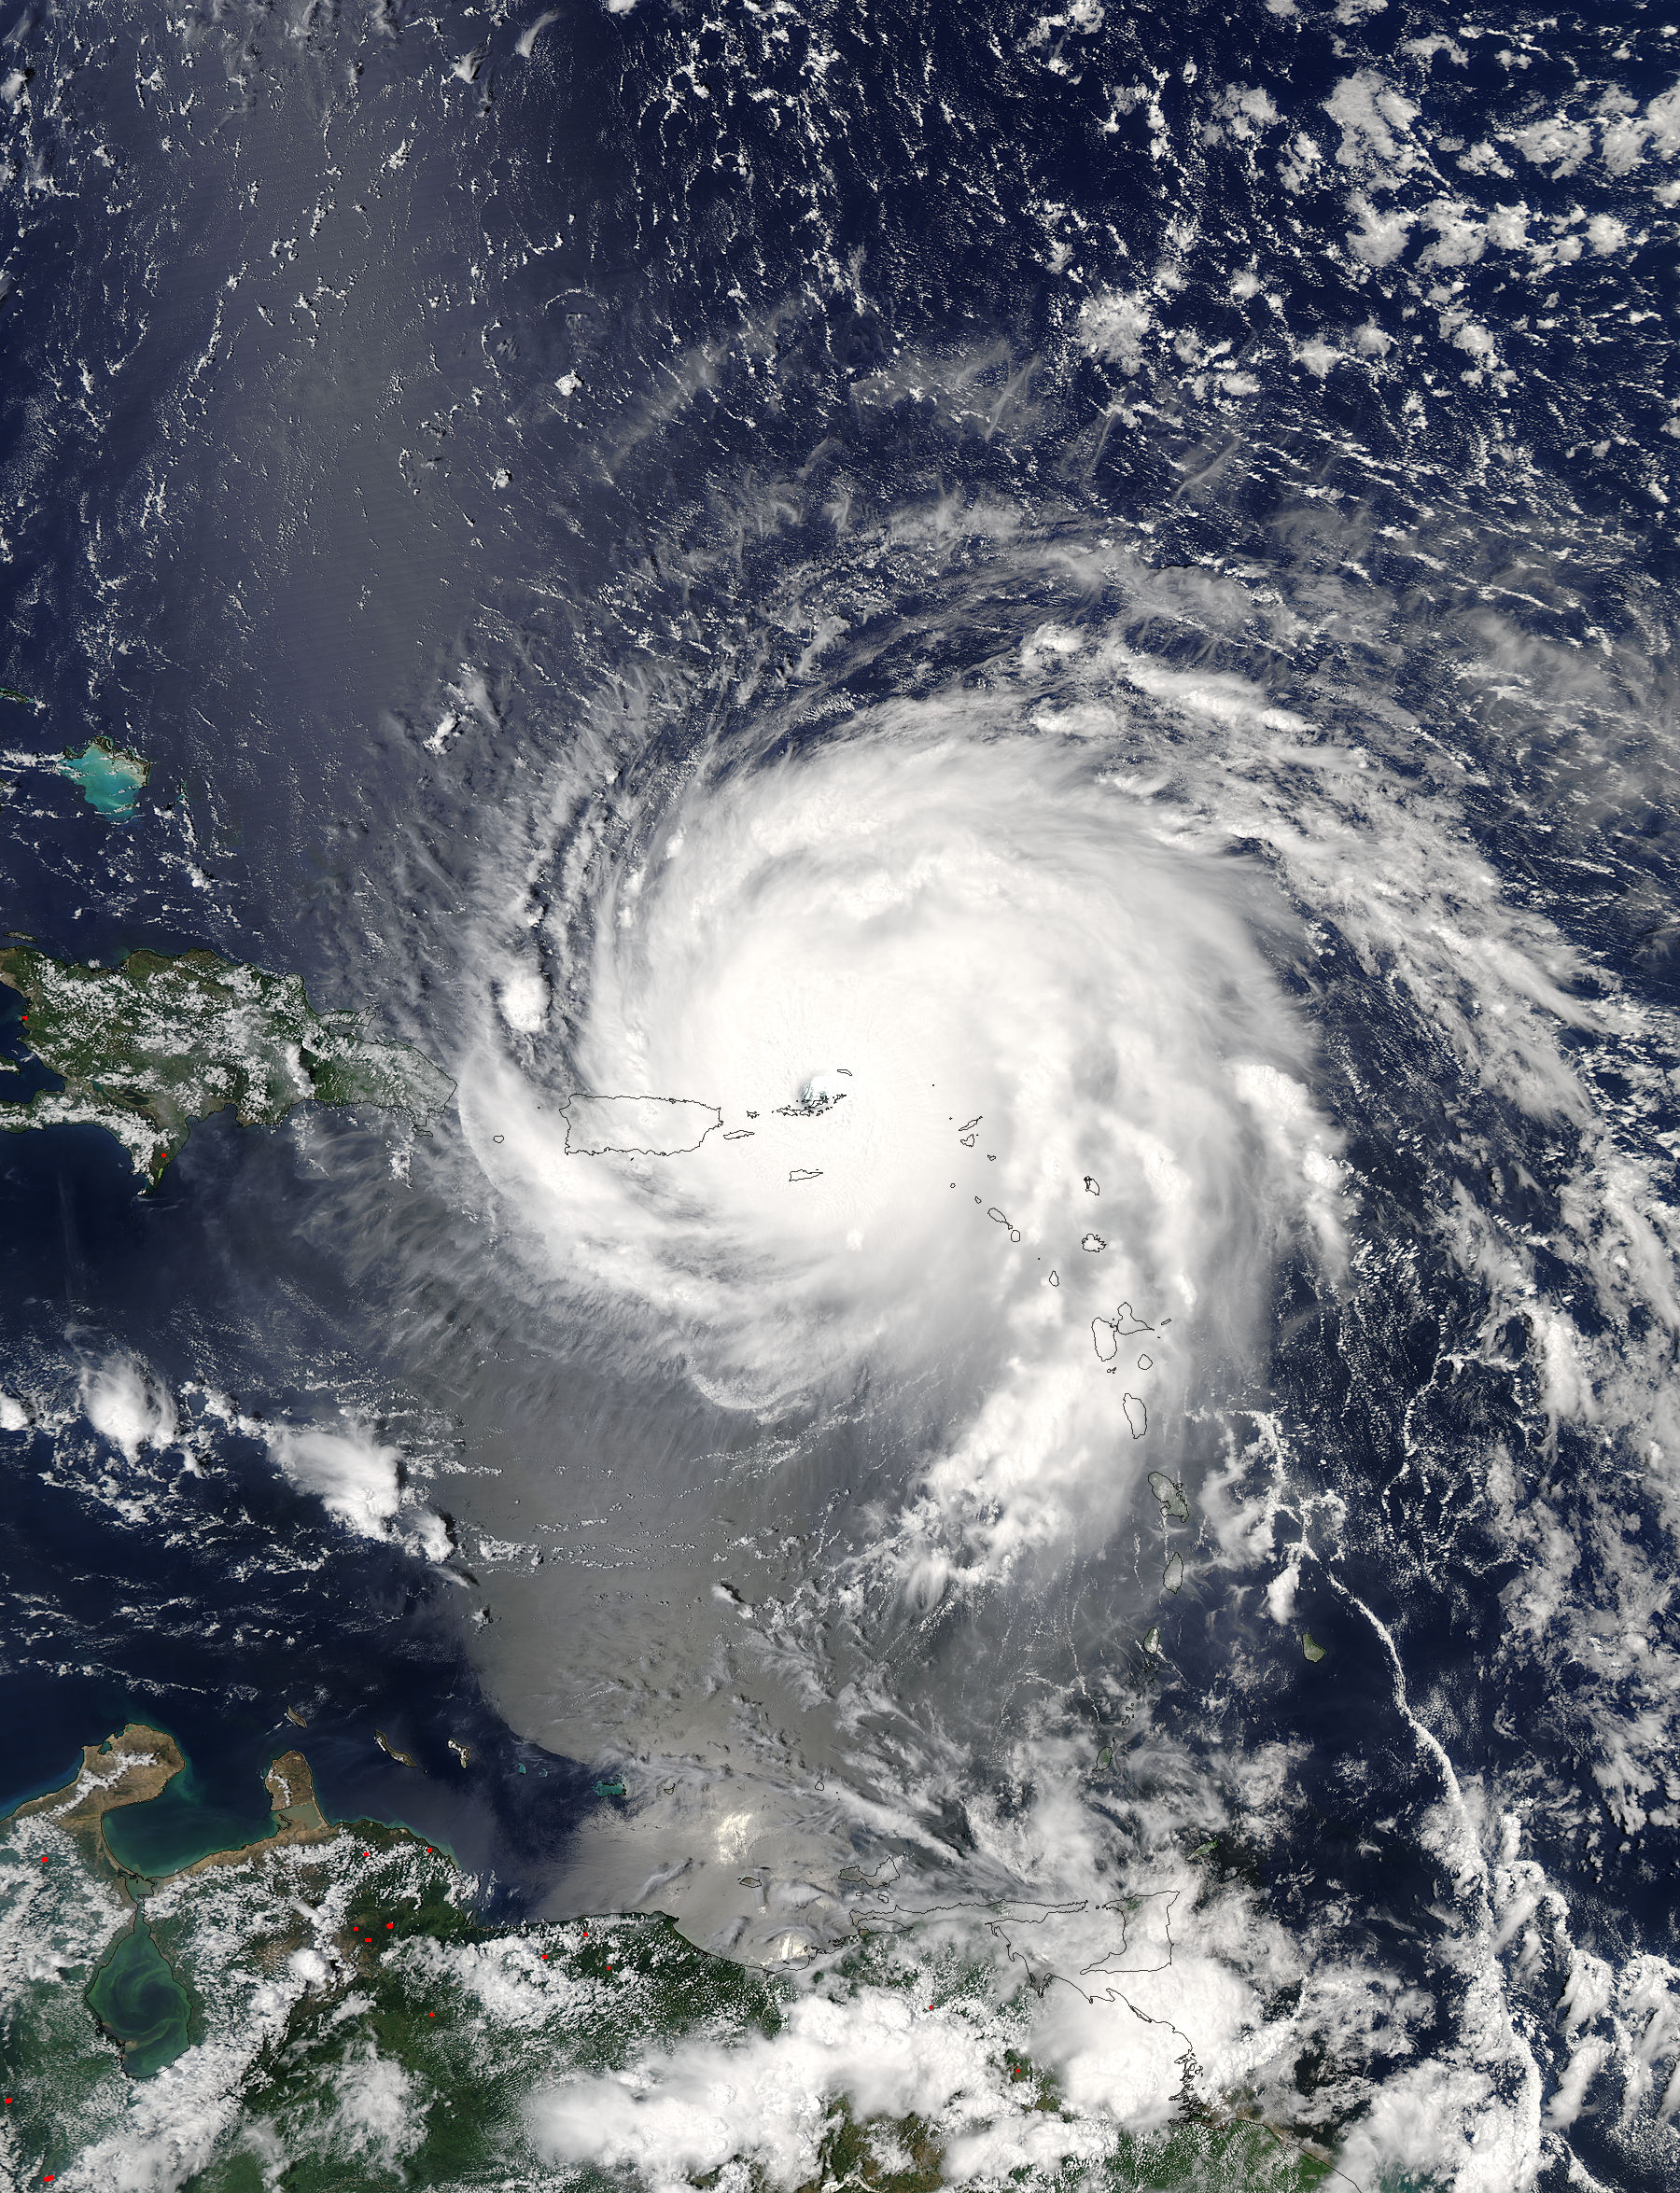
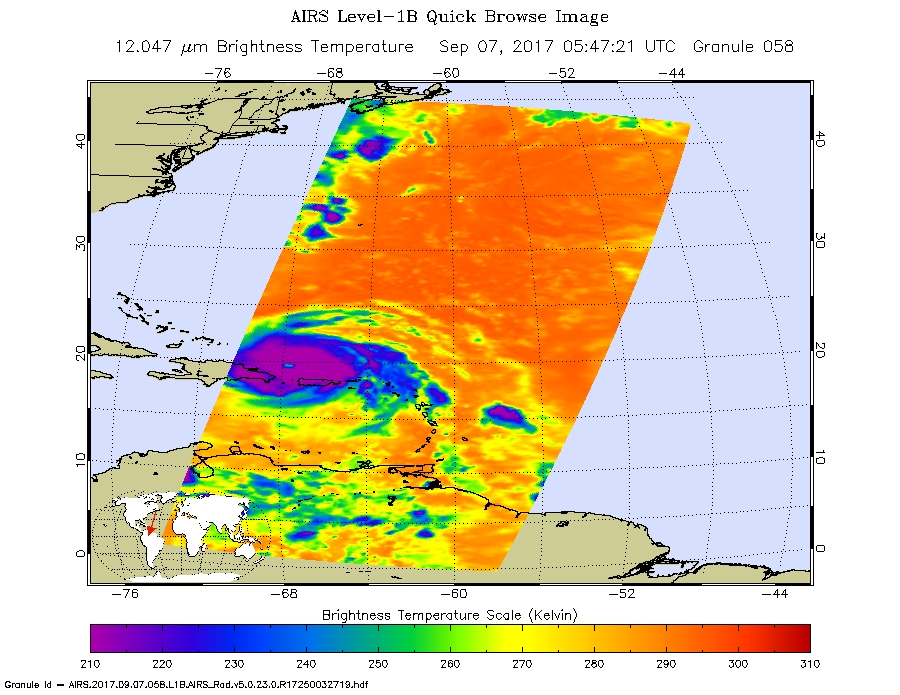
On Sept. 7, when Aqua passed over Irma again, another instrument aboard Aqua gathered temperature data on the storm’s clouds, which tell forecasters where the strongest parts of the hurricane is located. The colder the cloud tops, the higher the storm, and the stronger it is.
The Atmospheric Infrared Sounder or AIRS instrument aboard NASA’s Aqua satellite captured infrared temperature data on Hurricane Irma on Sept. 7 at 1:47 a.m. EDT (0547 UTC). The image showed a clear eye and very cold cloud top temperatures as cold as cold as minus 83.1 degrees Celsius (minus 117.7 degrees Fahrenheit). NASA-NOAA’s Suomi NPP satellite confirmed that data. At that time, the southwestern quadrant of the storm was over Puerto Rico.
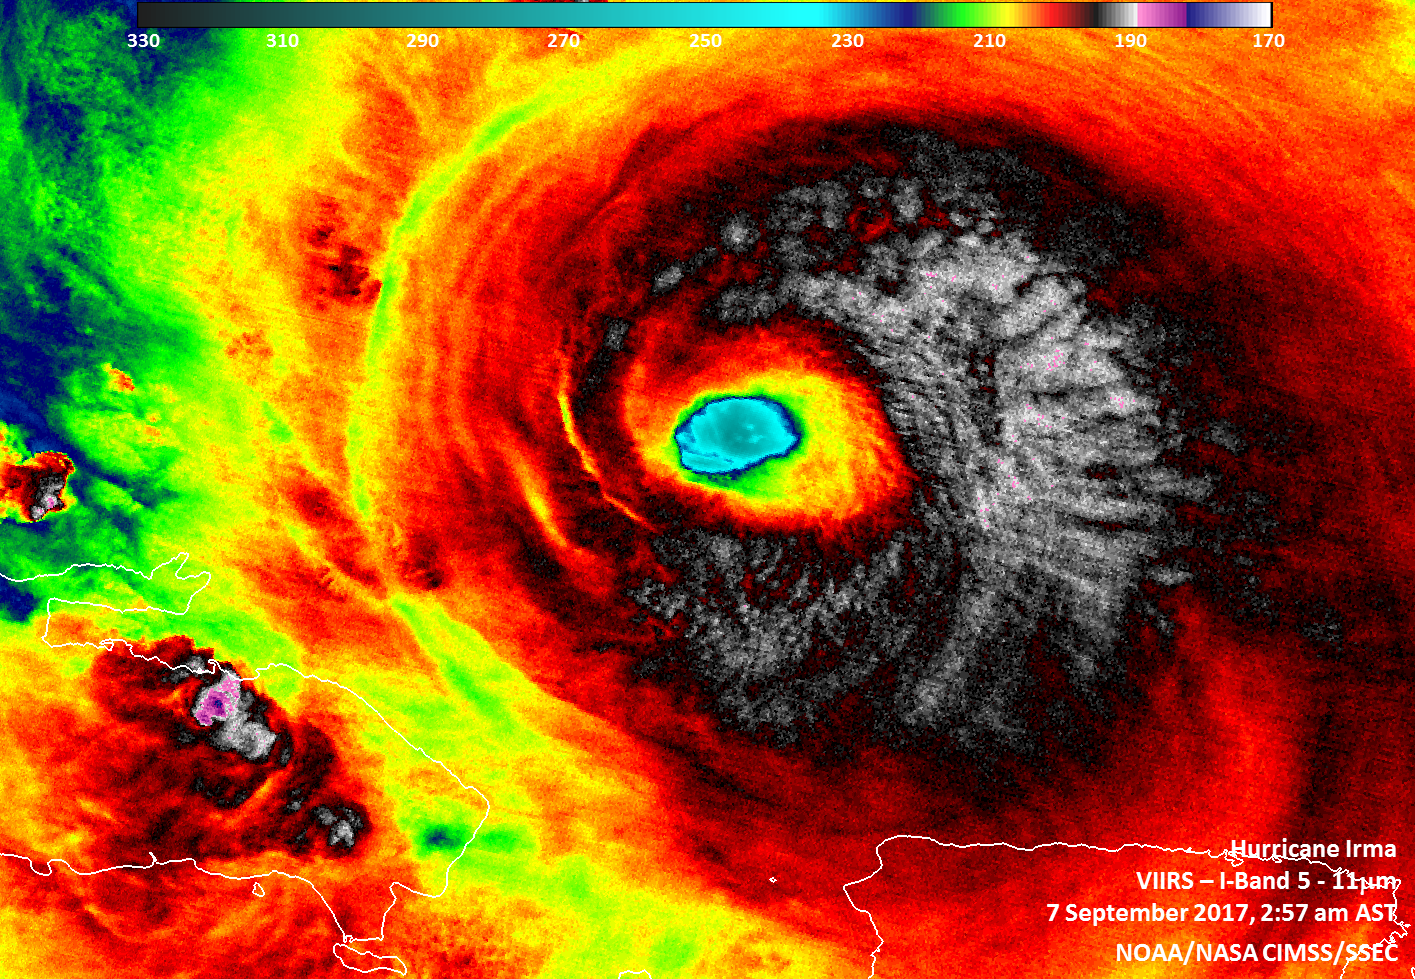
Suomi NPP Satellite Collects Night-Time Data on Irma
At 2:57 a.m. AST/EDT on Sept. 7, the VIIRS instrument on board the NOAA/NASA Suomi NPP satellite captured data on Irma as the storm passed to the northwest of the island of Puerto Rico. In a night-time image created by Suomi NPP’s Day Night Band, the waning gibbous moon highlighted the convection around Irma’s eye and tropospheric gravity waves were present around the well-defined eyewall.
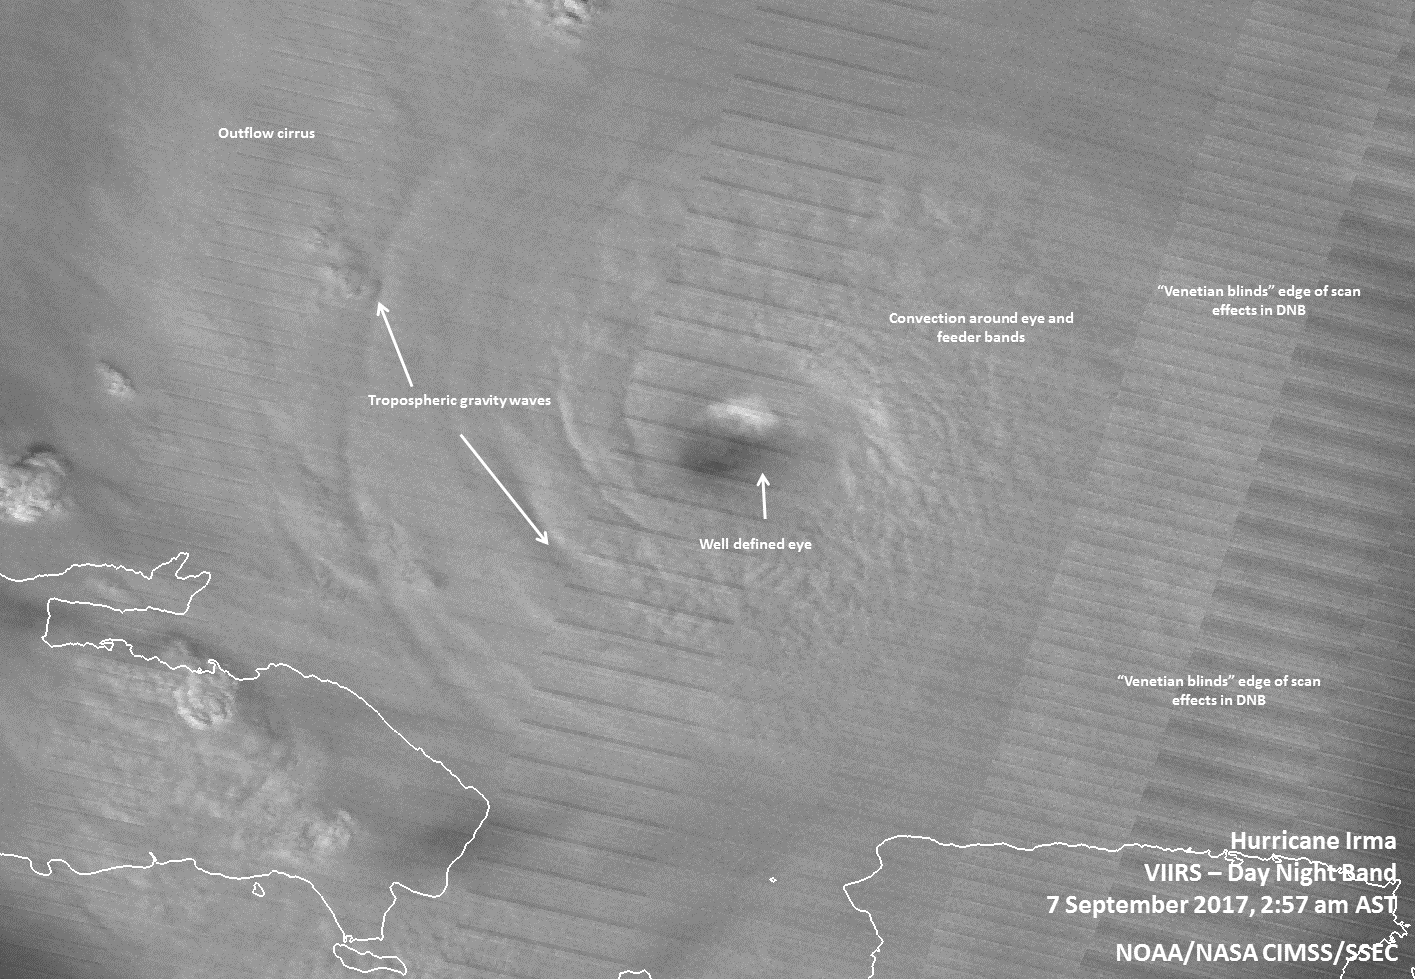
Infrared imagery from Suomi NPP revealed cloud top temperatures as cold as 190 kelvin (minus 83.1 degrees Celsius/minus 117.7 degrees Fahrenheit) from Irma’s northern quadrant, stretching through the eastern side to the south of the eye. Those cloud top temperatures indicated the most powerful storms in Irma, stretching high into the troposphere. NASA research has shown that cloud top temperatures that cold can generate very heavy rain.
Watches and Warnings in Effect on Sept. 7
On Sept. 7, hurricane and storm surge watches are now in effect for portions of south Florida and the Florida Keys. There are many warnings and watches in effect.
A Storm Surge Watch is in effect from Jupiter Inlet southward around the Florida peninsula to Bonita Beach, Florida, and for the Florida Keys.
A Hurricane Warning is in effect for the Dominican Republic from Cabo Engano to the northern border with Haiti; Haiti from the northern border with the Dominican Republic to Le Mole St. Nicholas; the southeastern Bahamas and the Turks and Caicos Islands; the central Bahamas and the northwestern Bahamas.
A Hurricane Watch is in effect from Jupiter Inlet southward around the Florida peninsula to Bonita Beach, Florida, the Florida Keys, Lake Okeechobee, Florida Bay, and for Cuba from Matanzas province eastward to Guantanamo province. A Tropical Storm Warning is in effect for the Dominican Republic from south of Cabo Engano westward to the southern border with Haiti; Haiti from south of Le Mole St. Nicholas to Port-Au-Prince; Cuba provinces of Guantanamo, Holguin, Las Tunas, Camaguey, Ciego de Avila, Sancti Spiritus and Villa Clara.
NHC Official Location for Irma on Sept. 7
At 11 a.m. EDT (1500 UTC) the National Hurricane Center (NHC) said that the distinct eye of Hurricane Irma was located near 20.4 degrees north latitude and 69.7 degrees west longitude.
Irma was moving toward the west-northwest near 16 mph (26 kph), and this general motion is expected to continue with some decrease in forward speed for the next couple of days. On the forecast track, the eye of Irma should continue to move just north of the coast of Hispaniola today, be near the Turks and Caicos and southeastern Bahamas by this evening, and then be near the central Bahamas by Friday, Sept. 8.
Maximum sustained winds are near 175 mph (280 kph) with higher gusts. Irma is a category 5 hurricane on the Saffir-Simpson Hurricane Wind Scale. Some fluctuations in intensity are likely during the next day or two, but Irma is forecast to remain a powerful category 4 or 5 hurricane during the next couple of days. The minimum central pressure reported by an Air Force plane was 921 millibars.
NHC forecaster Lixion Avila noted “There are no obvious reasons why Irma will not remain a powerful hurricane for the next 3 days while approaching Florida. Thereafter, an increase in the wind shear could lead to gradual weakening, but Irma is expected to remain a major hurricane until landfall occurs.”Lixion Avila noted “There are no obvious reasons why Irma will not remain a powerful hurricane for the next 3 days while approaching Florida. Thereafter, an increase in the wind shear could lead to gradual weakening, but Irma is expected to remain a major hurricane until landfall occurs.”
For updated forecasts on Irma, visit: www.nhc.noaa.gov.
Rob Gutro
NASA’s Goddard Space Flight Center
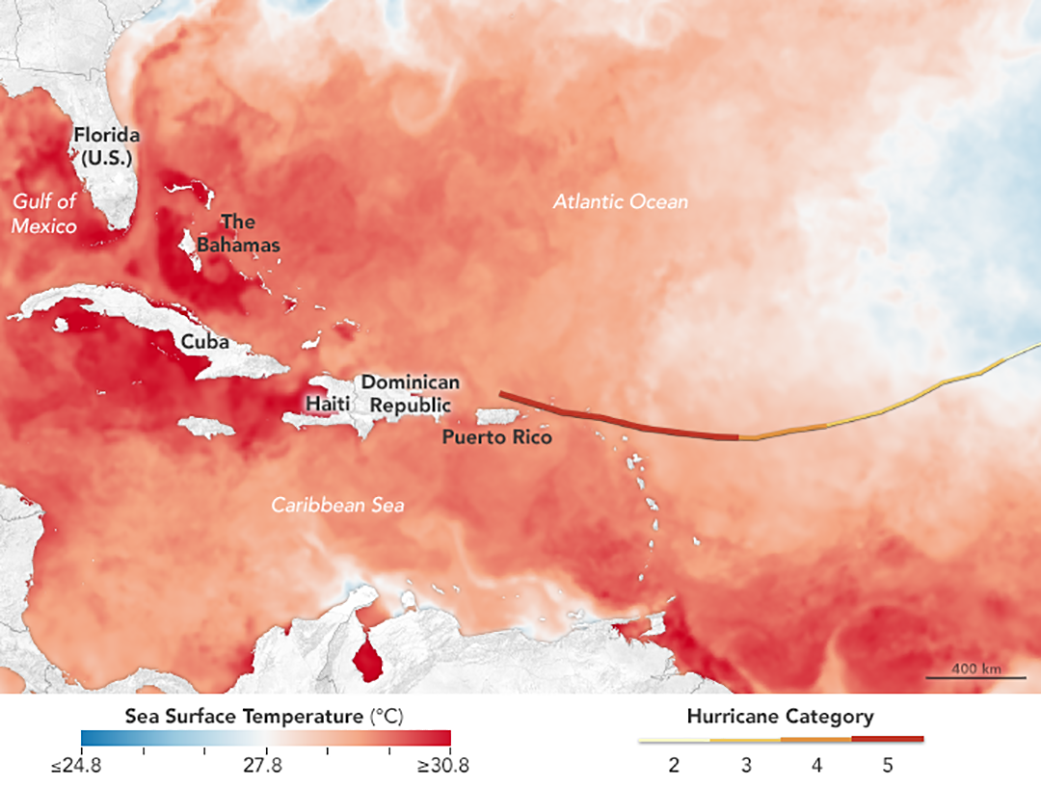
Sep. 07, 2017 – (Update #2) Hot Water Ahead for Irma
On September 6, 2017, Hurricane Irma slammed into the Leeward Islands on its way toward Puerto Rico, Cuba, and the U.S. mainland. As the category 5 storm approaches the Bahamas and Florida in the coming days, it will be passing over waters that are warmer than 30 degrees Celsius (86 degrees Fahrenheit)—hot enough to sustain a category 5 storm. Warm oceans, along with low wind shear, are two key ingredients that fuel and sustain hurricanes. For the full story go to the Earth Observatory story: Hot Water Ahead for Irma
Sep. 07, 2017 – (Update #1) Satellite Animation Sees Category 5 Hurricane Irma and Tropical Storm Katia
Credits: NASA-NOAA GOES Project
Sep. 06, 2017 – (Update #5) – GPM Satellite Probes Dangerous Category Five Hurricane Irma
The GPM core observatory satellite had an exceptional view of hurricane Irma’s eye and found extreme rainfall within the Category 5 storm’s eyewall.
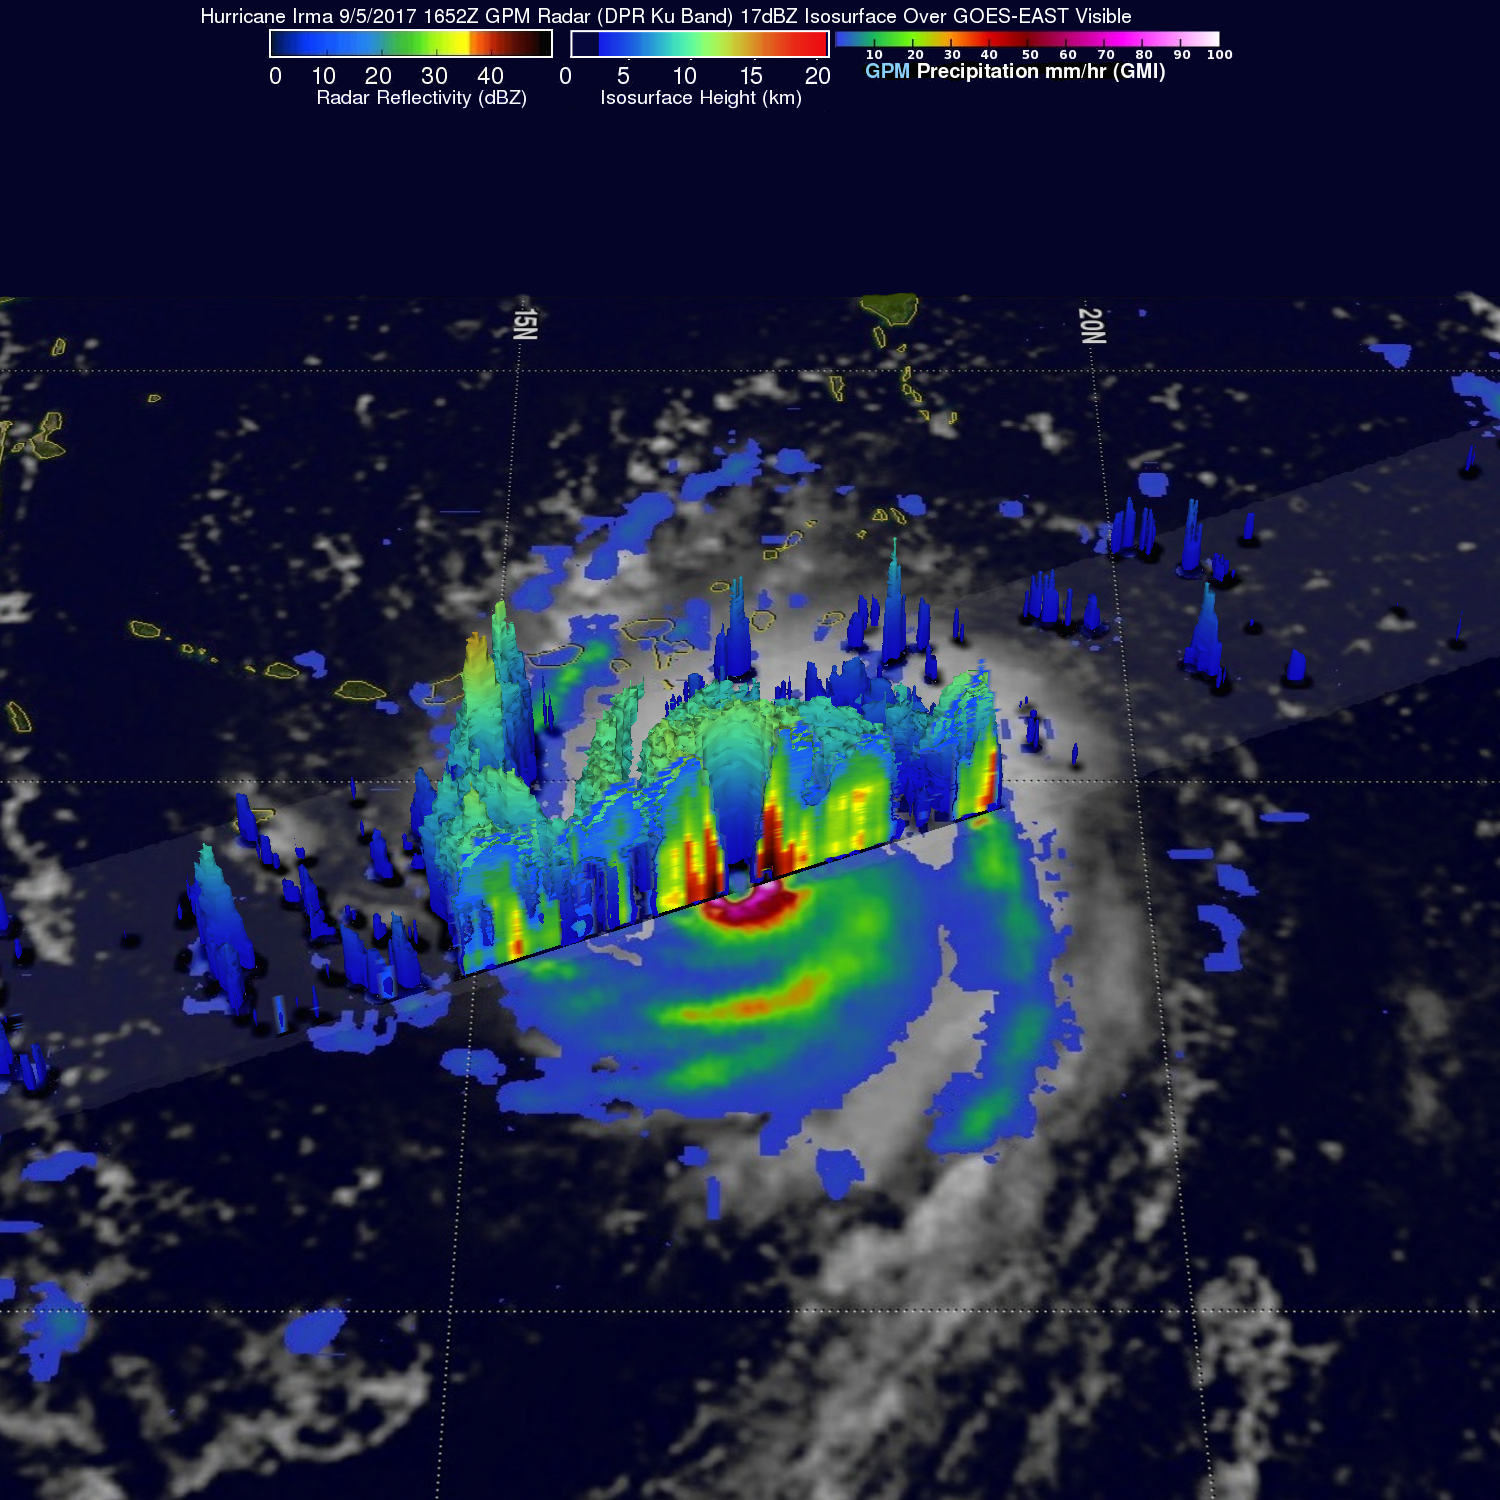
The Global Precipitation Measurement mission or GPM core satellite passed over Irma on September 5, 2017 at 12:52 p.m. EDT (1652 UTC). At NASA’s Goddard Space Flight Center in Greenbelt, Maryland a rainfall analysis was created using data from GPM’s Microwave Imager (GMI) and Dual-Frequency Precipitation Radar (DPR) data. At the time, Irma was approaching the Leeward Islands with maximum sustained winds of about 178 mph (155 knots). This made Irma a dangerous category five hurricane on the Saffir-Simpson hurricane wind scale. Intense rainfall is shown within Irma’s nearly circular eye. GPM’s DPR uncloaked precipitation that was falling at a rate of more than 10.8 inches (274 mm) per hour in the solid ring of powerful storms within Irma’s eye wall.
At NASA a 3-D image was created using GPM’s radar (DPR Ku band) data. GPM’s radar revealed that the extremely powerful storms rotating around the eye were reaching altitudes greater than 7.75 miles (12.5 km). The tallest thunderstorms were found by GPM’s radar in a feeder band that was located to the southwest of Irma’s eye. These extreme storms were reaching heights of over 10.0 miles (16.2 km).
GPM is a joint mission between NASA and the Japanese space agency JAXA.
Warnings and Watches on Sept. 6
A Hurricane Warning is in effect for Antigua, Barbuda, Anguilla, Montserrat, St. Kitts, and Nevis, Saba, St. Eustatius, and Saint Maarten, Saint Martin and Saint Barthelemy, British Virgin Islands, U.S. Virgin Islands, Puerto Rico, Vieques, and Culebra, Dominican Republic from Cabo Engano to the northern border with
Haiti, Guadeloupe, Southeastern Bahamas and the Turks and Caicos Islands.
A Hurricane Watch is in effect for Haiti from the northern border with the Dominican Republic to Le Mole St. Nicholas, Turks and Caicos Islands, Southeastern Bahamas, Cuba from Matanzas province eastward to Guantanamo province, and the Central Bahamas.
A Tropical Storm Warning is in effect for the Dominican Republic from south of Cabo Engano westward to the southern border with Haiti, and a Tropical Storm Watch is in effect for Haiti from south of Le Mole St. Nicholas to Port-Au-Prince.
Irma’s Location at 8 a.m. EDT on Sept. 6
At 8 a.m. EDT on Sept. 6, the National Hurricane Center said that the eye of potentially catastrophic category 5 Hurricane Irma was passing over St. Martin and the northern eyewall was pounding the island of Anguilla.
The eye of Hurricane Irma was located near latitude 18.1 degrees north latitude and 63.3 degrees west longitude. Irma was moving toward the west-northwest near 16 mph (26 kph), and this general motion is expected to continue for the next couple of days.
The National Hurricane Center said on the forecast track, the extremely dangerous core of Irma will move over portions of the northern Virgin Islands today, pass near or just north of Puerto Rico this afternoon or tonight, and pass near or just north of the coast of the Dominican Republic Thursday, Sept. 7.
Credits: NASA/JAXA, Hal Pierce
Maximum sustained winds remain near 185 mph (295 kph) with higher gusts. Irma is a category 5 hurricane on the Saffir-Simpson Hurricane Wind Scale. Some fluctuations in intensity are likely during the next day or two, but Irma is forecast to remain a powerful category 4 or 5 hurricane during the next couple of days. Hurricane-force winds extend outward up to 50 miles (85 km) from the center and tropical-storm-force winds extend outward up to 175 miles (280 km). A NOAA National Ocean Service station on Barbuda reported a minimum pressure of 916.1 millibars earlier this morning.
For updated forecasts, visit: www.nhc.noaa.gov
Hal Pierce/Rob Gutro
NASA’s Goddard Space Flight Center
Sep. 06, 2017 – (Update #4) – ISS Passes Over Hurricane Irma – 9/6/2017
Credits: NASA
Sep. 06, 2017 – (Update #3) NASA Satellite Sees Barbuda in the Eye of Hurricane Irma
In a unique image, NASA-NOAA’s Suomi NPP satellite passed over Hurricane Irma when the island of Barbuda was in the center of the storm’s eye.
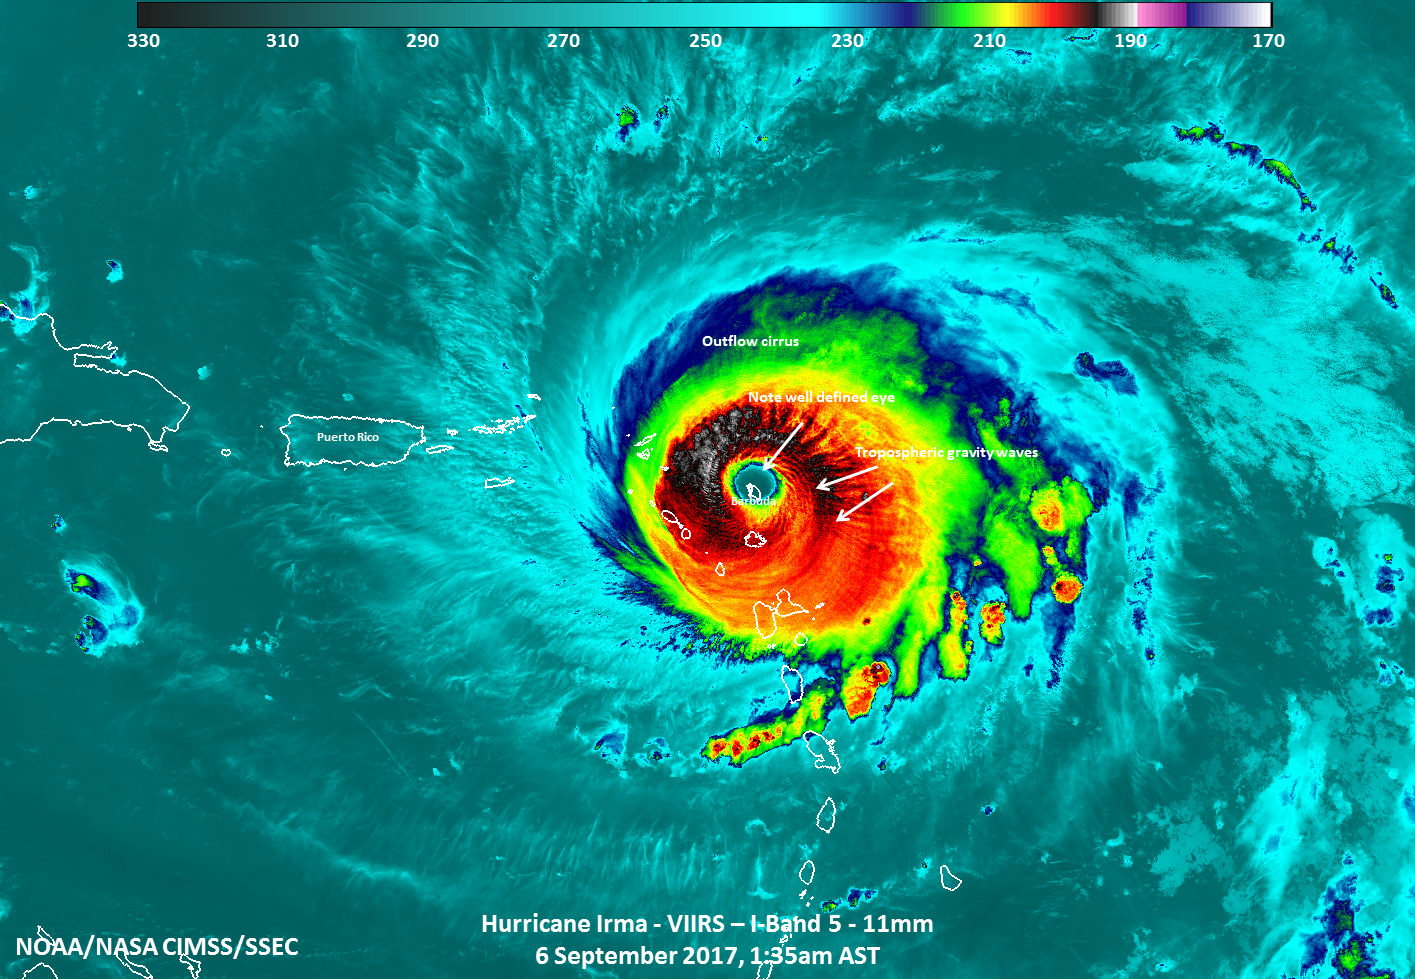
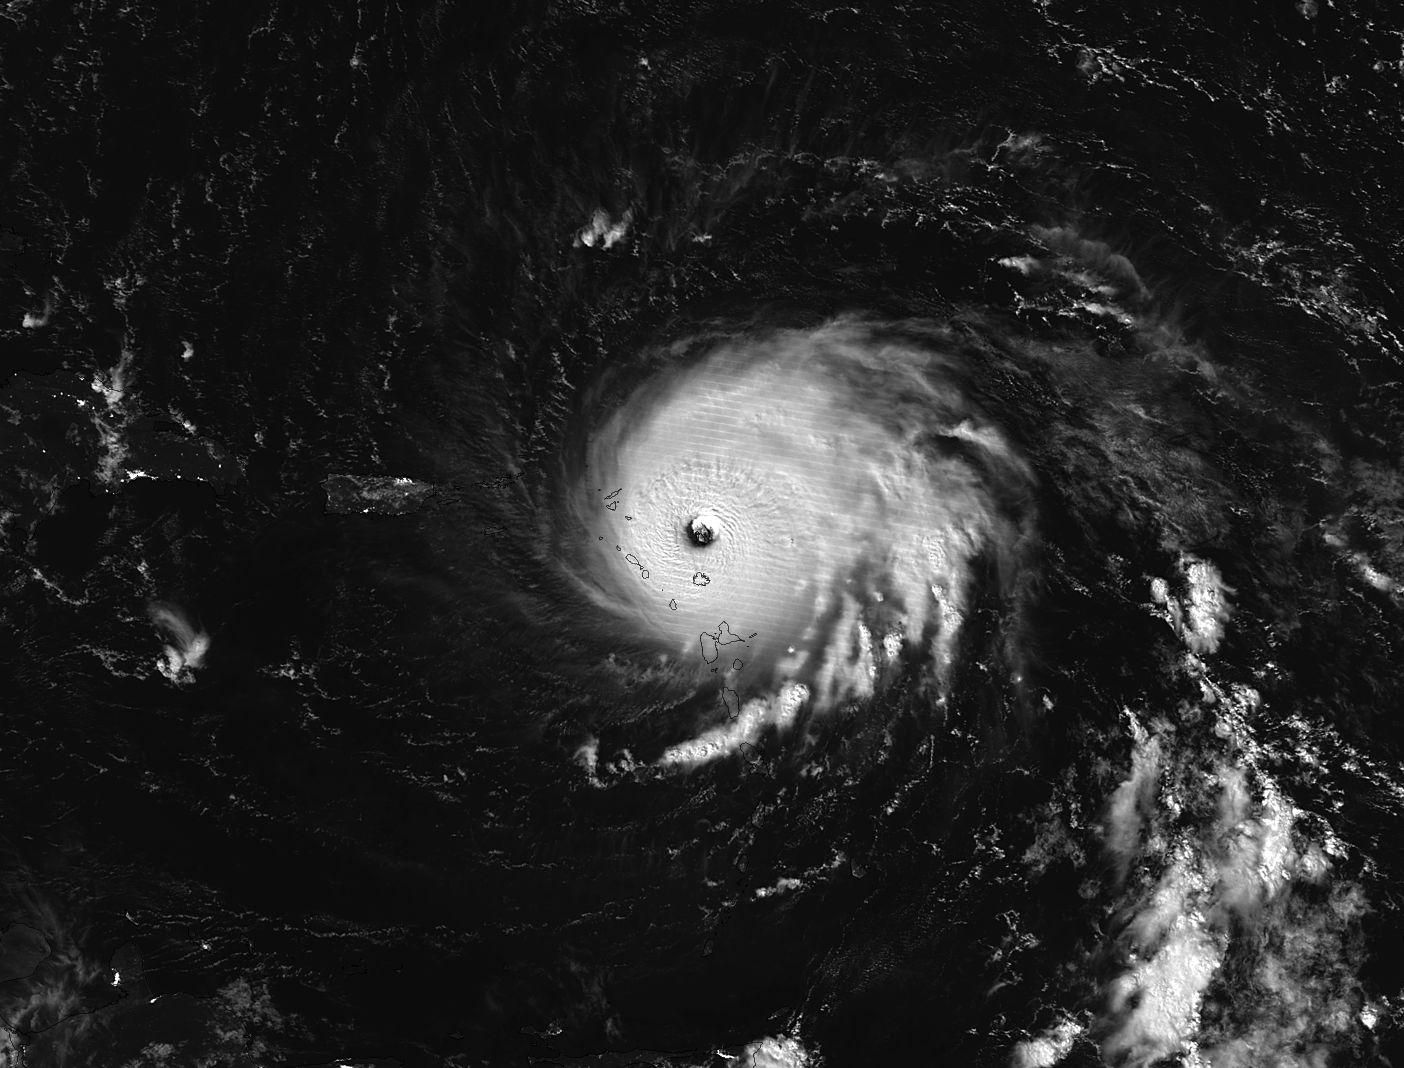
At 1:35 a.m. AST/EDT on Sept. 6 , the Visible Infrared Imaging Radiometer Suite (VIIRS) instrument aboard the Suomi NPP satellite captured Category 5 Hurricane Irma as hit the island of Barbuda in the eastern Caribbean Sea, which is just north of the island of St. Johns. Barbuda is one of the two major islands in the Caribbean nation of Antigua and Barbuda.
In the VIIRS image, the eye of the storm appeared well-defined with powerful thunderstorms around it, indicative of an intense tropical system. Visible tropospheric gravity waves, which are indicative of upward convection (rising air that forms the thunderstorms that make up a tropical cyclone) within the storm and can impact aviation were also seen.
In an infrared close-up of the storm there was some evidence of the mesovorticies, which are also indicative of an intense tropical cyclone. The full moon provided visiblity at night that clearly showed mesovorticies over Barbuda as well as tropospheric gravity waves.
William Straka III / Rob Gutro
University of Wisconsin-Madison/CIMSS
NASA’s Goddard Space Flight Center
Sep. 06, 2017 – (Update #2) NASA Looks at Hurricane Irma’s Heat Engine
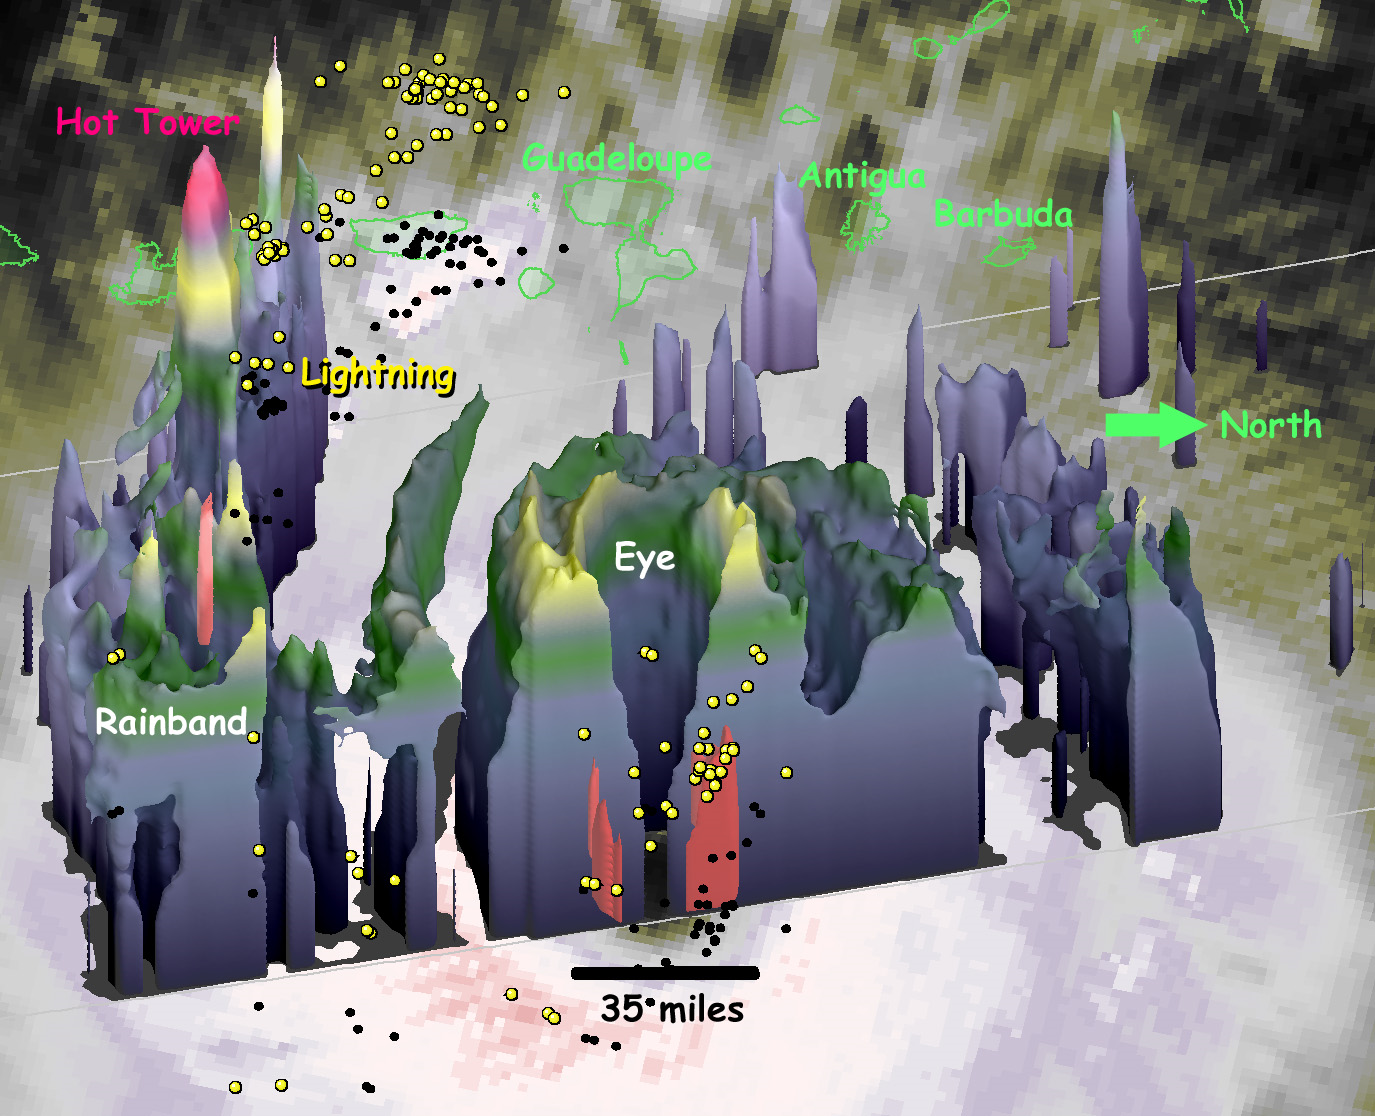
On September 5, 2017 at 1 p.m. EDT (1700 UTC) the radar on the Global Precipitation Measuring Mission (GPM) satellite captured a 3-D view of the heat engine inside of category-5 Hurricane Irma.
Under the central ring of clouds that circles the eye, water that had evaporated from the ocean surface condenses, releases heat, and powers the circling winds of the hurricane. The radar on the GPM satellite is able to estimate how much water is falling as precipitation inside of the hurricane, which serves as a guide to how much energy is being released inside the hurricane’s central “heat engine.”
The blue-gray 3-D shape contains the light precipitation (corresponding to an observed 20-dBZ radar reflectivity), while the small, red 3-D shapes at the base of the storm contain the heaviest precipitation (corresponding to an observed 50-dBZ radar reflectivity). A ring of updrafts just outside of the hurricane’s eye lifts this precipitation to approximately a 12 kilometer (7.4 mile) altitude (yellow portion of the shaded volume).
A hot-tower storm cell in a rainband further from the eye has stronger updrafts that lift precipitation 14.5 km (9 mile) high (the bright violet portion of the 3-D shape to the left of the eye in this image). This hot tower consumes some water vapor that would otherwise have helped to fuel the hurricane’s winds. A single, hot tower is too small and short lived to have a noticeable effect on the hurricane’s maximum sustained winds.
Confirming this radar analysis are lightning flashes observed by the World Wide Lightning Location Network (WWLLN). The lightning flashes were observed within 1 hour of the satellite radar observations. Each flash is indicated by a yellow sphere plotted at 5 km (3.1 mile) altitude. There is lightning in the ring of convection surrounding the eye, which indicates that Hurricane Irma’s heat-engine is in high-gear. Lightning is also seen in the rainband that contains the hot tower (on the left side of the image).
To the west of Hurricane Irma (toward the top of the image) one can see some of the Leeward Islands, whose coastlines are indicates by green outlines. The GPM data in this image were provided by NASA and the Japan Aerospace Exploration Agency (JAXA).
Owen Kelley
NASA Goddard Space Flight Center
Sep. 06, 2017 – (Update #1) Satellite Animation Tracking Category 5 Hurricane Irma
Credits: NASA/NOAA GOES Project
Sep. 05, 2017 – (Update #2) – NASA Sees Irma Strengthen to a Category 5 Hurricane
NASA and NOAA satellites have been providing valuable satellite imagery to forecasters at the National Hurricane Center, and revealed that Hurricane Irma has strengthened to a Category 5 hurricane on Sept. 5 around 8 a.m. EDT (1200 UTC).
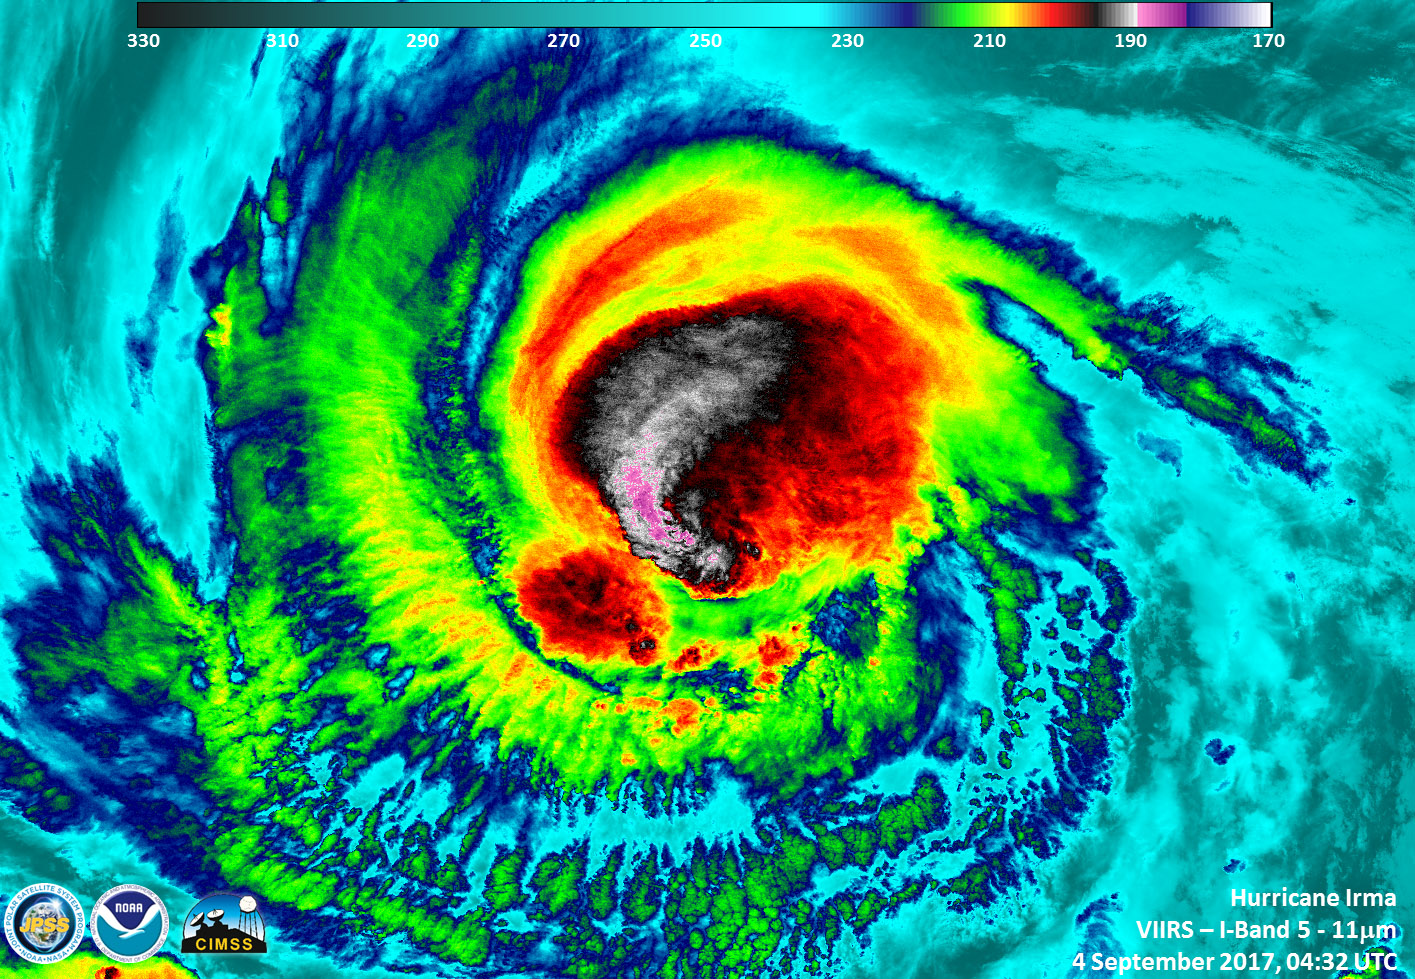
On Sept. 4 at (1:24 p.m. EDT) 17:24 UTC, NASA-NOAA’s Suomi NPP satellite captured this view of Hurricane Irma as a Category 4 hurricane approaching the Leeward Islands. The VIIRS instrument on the Suomi NPP satellite flew over Hurricane Irma on Sept. 4 at 04:32 UTC (12:32 a.m. EDT) when it was a Category 3 hurricane. VIIRS infrared data revealed very cold, very high, powerful thunderstorms on Irma’s western side. Cloud top temperatures in that area were near minus 117.7 degrees Fahrenheit or minus 83.5 degrees Celsius. Storms with cloud tops that cold have the capability to generate very heavy rainfall.
Credits: NASA-NOAA GOES Project
An animation of NOAA’s GOES East satellite imagery from Sept. 2 at 7:45 a.m. EDT (1145 UTC) to Sept. 5 ending at 7:15 a.m. CDT (1115 UTC) tracked Irma’s movements and change in intensity. Over the couse of the three days, Hurricane Irma moved west toward the Leeward Islands and strengthened from a Category 3 to a Category 5 storm on Sept. 5.
At 8 a.m. EDT (1200 UTC) on Sept. 5, many warnings and watches were in effect. A Hurricane Warning is in effect for Antigua, Barbuda, Anguilla, Montserrat, St. Kitts, and Nevis, Saba, St. Eustatius, and Sint Maarten, Saint Martin and Saint Barthelemy, British Virgin Islands, U.S. Virgin Islands and Puerto Rico, Vieques, and Culebra. A Hurricane Watch is in effect for Guadeloupe, Dominican Republic from Cabo Engano to the northern border with, Haiti. A Tropical Storm Warning is in effect for Guadeloupe and Dominica. A Tropical Storm Watch is in effect for Dominican Republic from south of Cabo Engao to Isla Saona.
At 8 a.m. EDT (1200 UTC), the National Hurricane Center said the distinct eye center of Hurricane Irma was located near 16.7 degrees north latitude and 57.7 degrees west longitude. That’s about 270 miles (440 km) east of Antigua and about 280 miles (445 km) east-southeast of Barbuda.
Irma was moving toward the west near 14 mph (22 kph), and this general motion is expected to continue today, followed by a turn toward the west-northwest tonight. On the forecast track, the dangerous core of Irma will move near or over portions of the northern Leeward Islands tonight and early Wednesday, Sept. 6.
NHC noted that reports from NOAA and U.S. Air Force Hurricane Hunter aircraft indicate Irma continues to strengthen and maximum sustained winds have increased to near 175 mph (280 kph) with higher gusts. Irma is an extremely dangerous category 5 hurricane on the Saffir-Simpson Hurricane Wind Scale. Some fluctuations in intensity are likely during the next day or two, but Irma is forecast to remain a powerful category 4 or 5 hurricane during the next couple of days. The latest estimated minimum central pressure from aircraft data is 929 millibars.
The National Hurricane Center expects Irma to maintain Major hurricane status (Category 3 or greater) through the forecast period (Sunday, Sept. 10).
For forecast updates, and expected rainfall, winds and storm surge for Irma, visit: www.nhc.noaa.gov.
Rob Gutro
NASA’s Goddard Space Flight Center
Sep. 05, 2017 – (Update #1) ISS Passes Over Irma on September 5, 2017
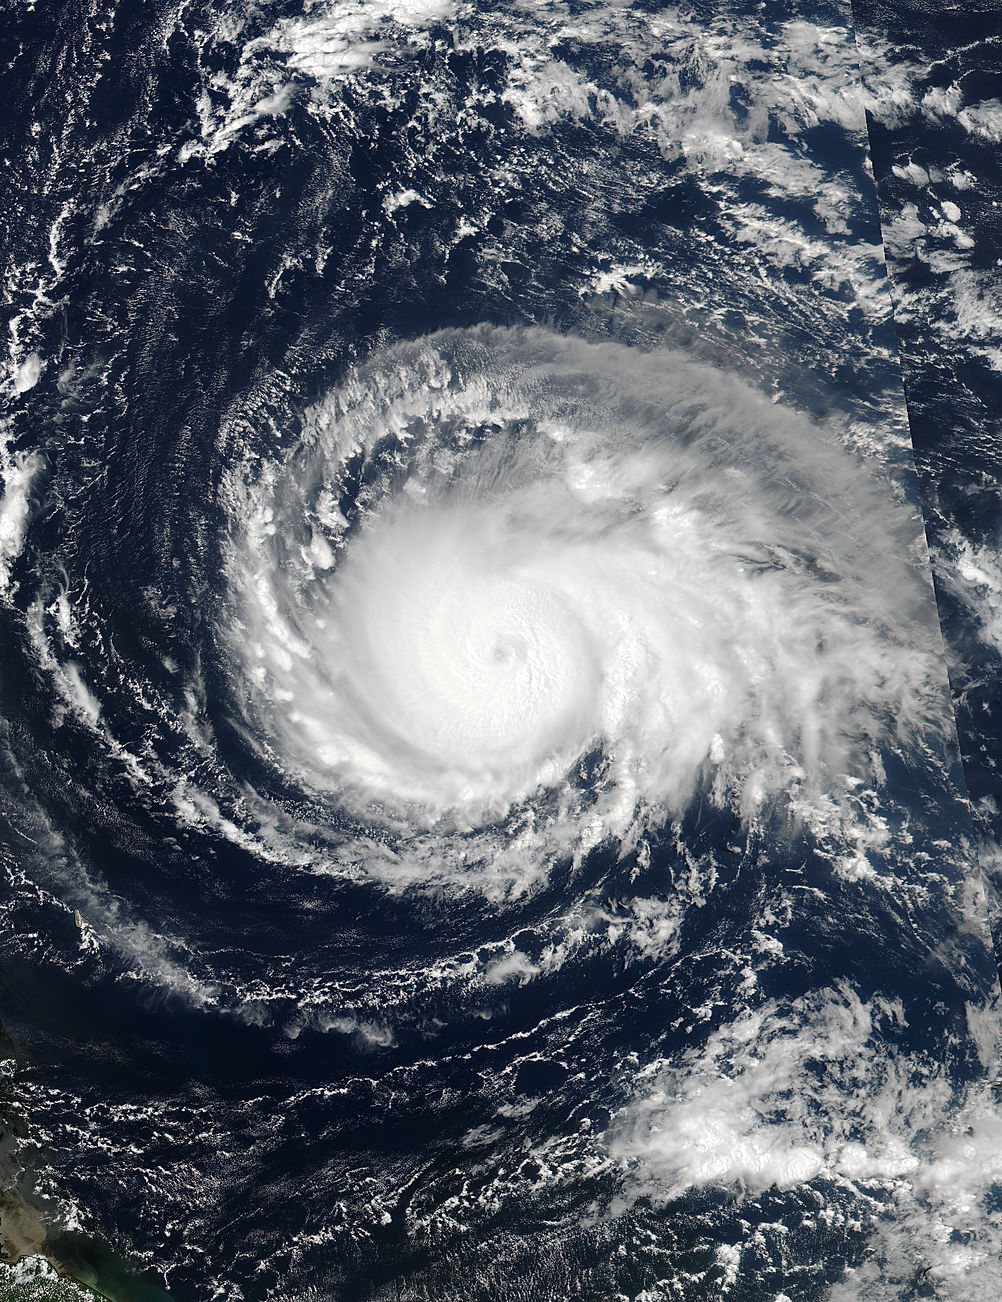
Sep. 01, 2017 – NASA Gets a Night-time and Under-the-Hood Look at Hurricane Irma
NASA-NOAA’s Suomi NPP Satellite provided a night-time and infrared look at the Atlantic’s latest hurricane that revealed the power under the clouds. NASA’s GPM also provided a look at the rainfall being generated by Hurricane Irma.
After forming in the eastern Atlantic Ocean on Wednesday tropical storm Irma strengthened and became a powerful category three hurricane on Thursday August 31, 2017.
Two Suomi NPP Satellite Views
On Sept. 1 at 0347 UTC (Aug. 31 at 11:47 p.m. EDT) the Visible Infrared Imaging Radiometer Suite (VIIRS) instrument aboard NASA-NOAA’s Suomi NPP satellite captured a night-time image of Harvey that showed the center of circulation had moved back into the Gulf of Mexico.
Infrared data from the VIIRS instrument aboard showed powerful thunderstorms around the eye were cloud top temperatures were as cold as 190 kelvin.
The colder the cloud tops, the higher they are in the troposphere, and the more powerful the storms. NASA research has shown that storms with cloud top temperatures that cold have the potential to generate heavy rainfall.
Finding Irma’s Heaviest Rainfall
That heavy rainfall was confirmed by the Global Precipitation Measurement mission or GPM core satellite.
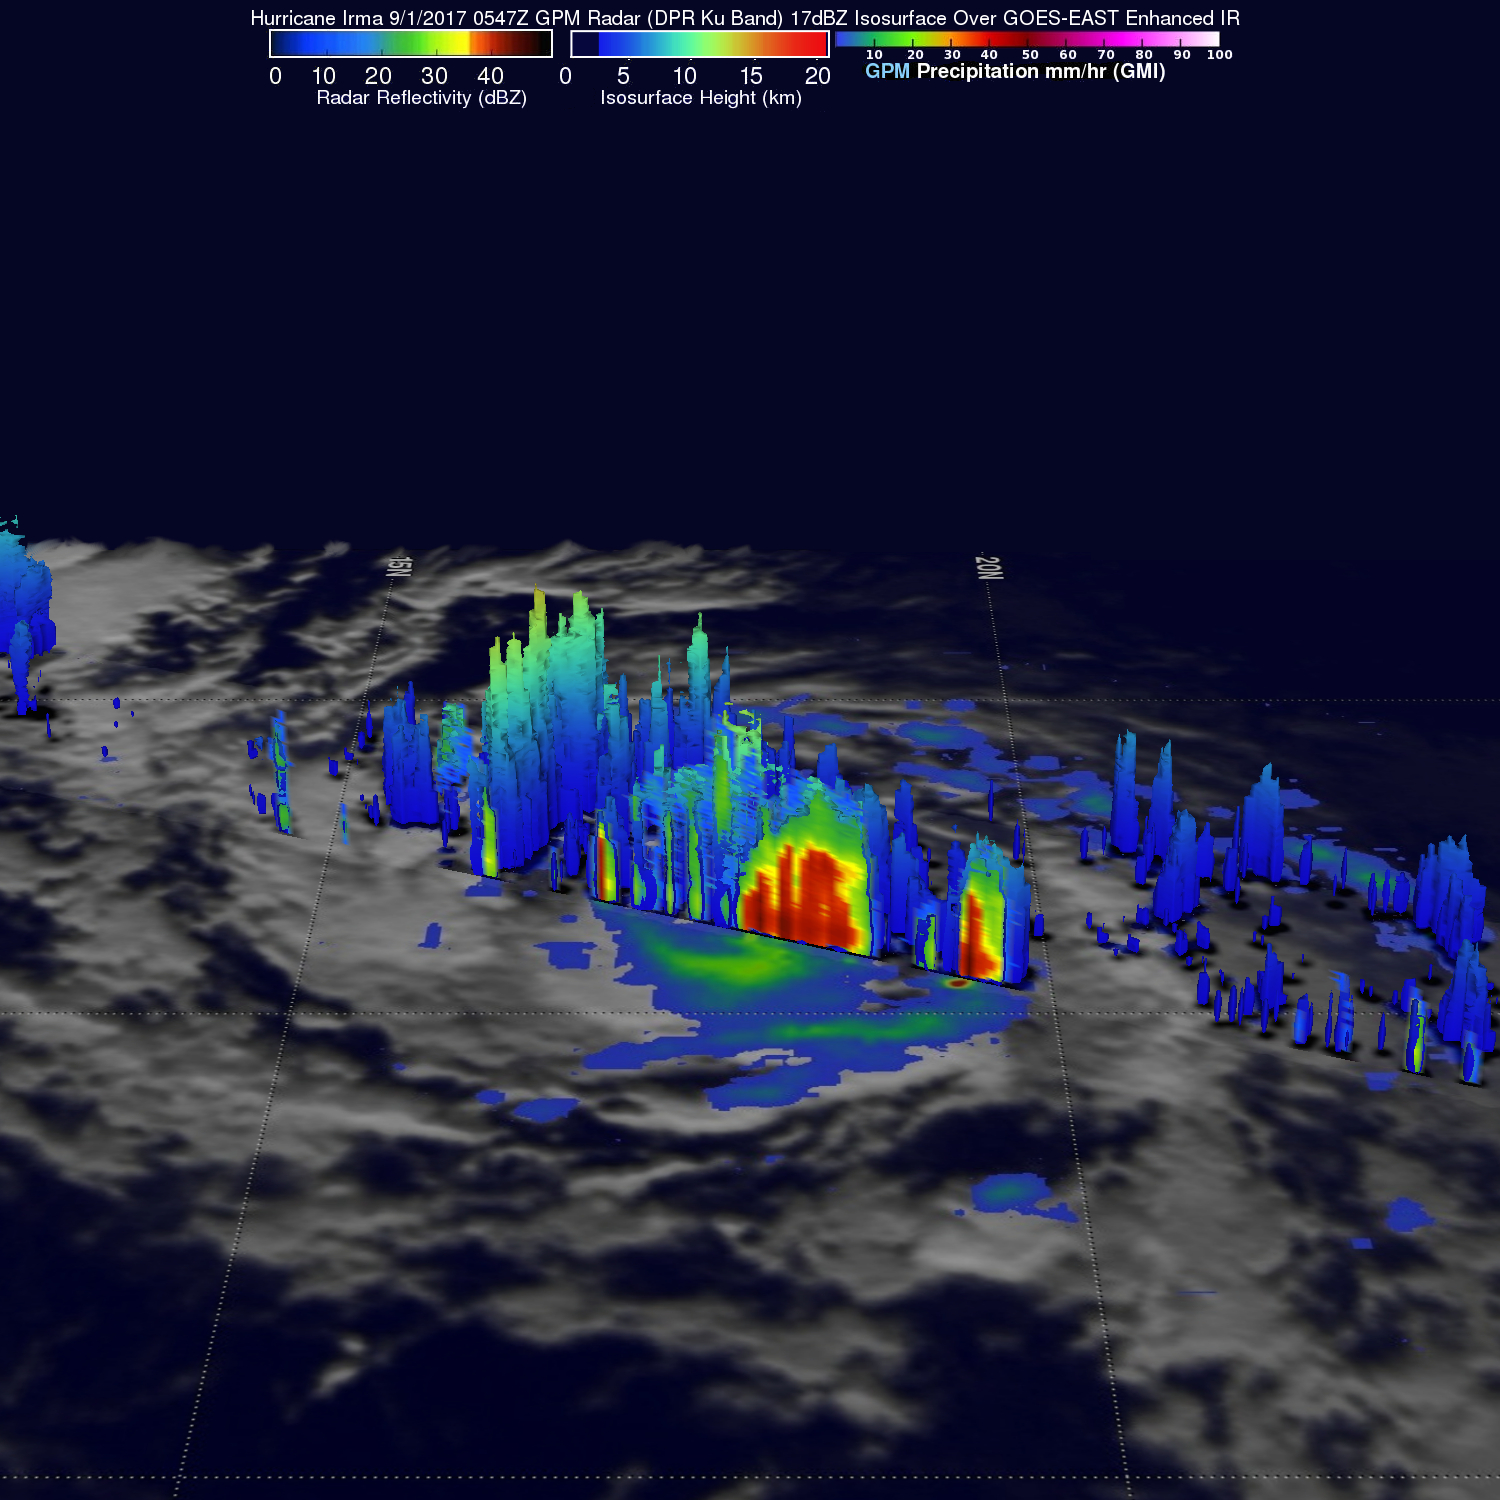
Hurricane Irma was moving west-northwestward with winds of about 115 mph (100 knots) when the GPM core Observatory satellite saw it on September 1 at 1:47 a.m. EDT (0547 UTC). Data collected by GPM’s Microwave Imager (GMI) and Dual-Frequency Precipitation Radar (DPR) instruments showed the locations and intensity of heavy precipitation within the hurricane. GPM’s Radar (DPR Ku band) found that a powerful convective storm in a band of rain on Irma’s northern side was dropping rain at a rate of almost 6.3 inches (159 mm) per hour.
GPM’s radar (DPR Ku Band) showed the height and the 3-D rainfall structure of powerful storms spiraling around hurricane Irma. DPR showed that storm tops were reaching heights of over 9.6 miles (15.5 km) in the band of powerful convective storms north of the hurricane’s center. GPM is a joint mission between NASA and the Japanese space agency JAXA.
Irma’s Location and Strength on Sept. 1
The National Hurricane Center (NHC) said that at 11 a.m. EDT (1500 UTC) on Sept. 1 that Irma was undergoing an eyewall replacement cycle. The small eye was becoming less distinct, with both microwave and visible imagery indicating the presence of a forming outer eyewall.
The center of Hurricane Irma was located near 18.5 degrees north latitude and 27.8 degrees west longitude. That’s about 1,580 miles (2,540 km) east of the Leeward Islands. Irma was moving toward the west-northwest near 13 mph (20 kph). A turn toward the west is expected by tonight, followed by a turn toward the west-southwest on Saturday, Sept. 2.
Maximum sustained winds are near 110 mph (175 kph) with higher gusts. Fluctuations in strength, up or down, are possible during the next few days, but Irma is expected to remain a powerful hurricane through the weekend. Hurricane-force winds extend outward up to 15 miles (30 km) from the center and tropical-storm-force winds extend outward up to 90 miles (150 km).
The estimated minimum central pressure is 972 millibars.
The NHC predicts that hurricane Irma will slowly intensify while heading toward the west-northwest. Irma is predicted to have winds of over 123 mph (110 knots) within the next five days. This would make Irma a strong category 3 hurricane on the Saffir-Simpson hurricane wind scale. There is some uncertainty about the long term direction of Irma’s movement.
For updates on Irma, visit: www.nhc.noaa.gov
Rob Gutro / Hal Pierce
NASA’s Goddard Space Flight Center
Aug. 31, 2017 – Satellite Eyes Tropical Storm Irma Swirling in Eastern Atlantic
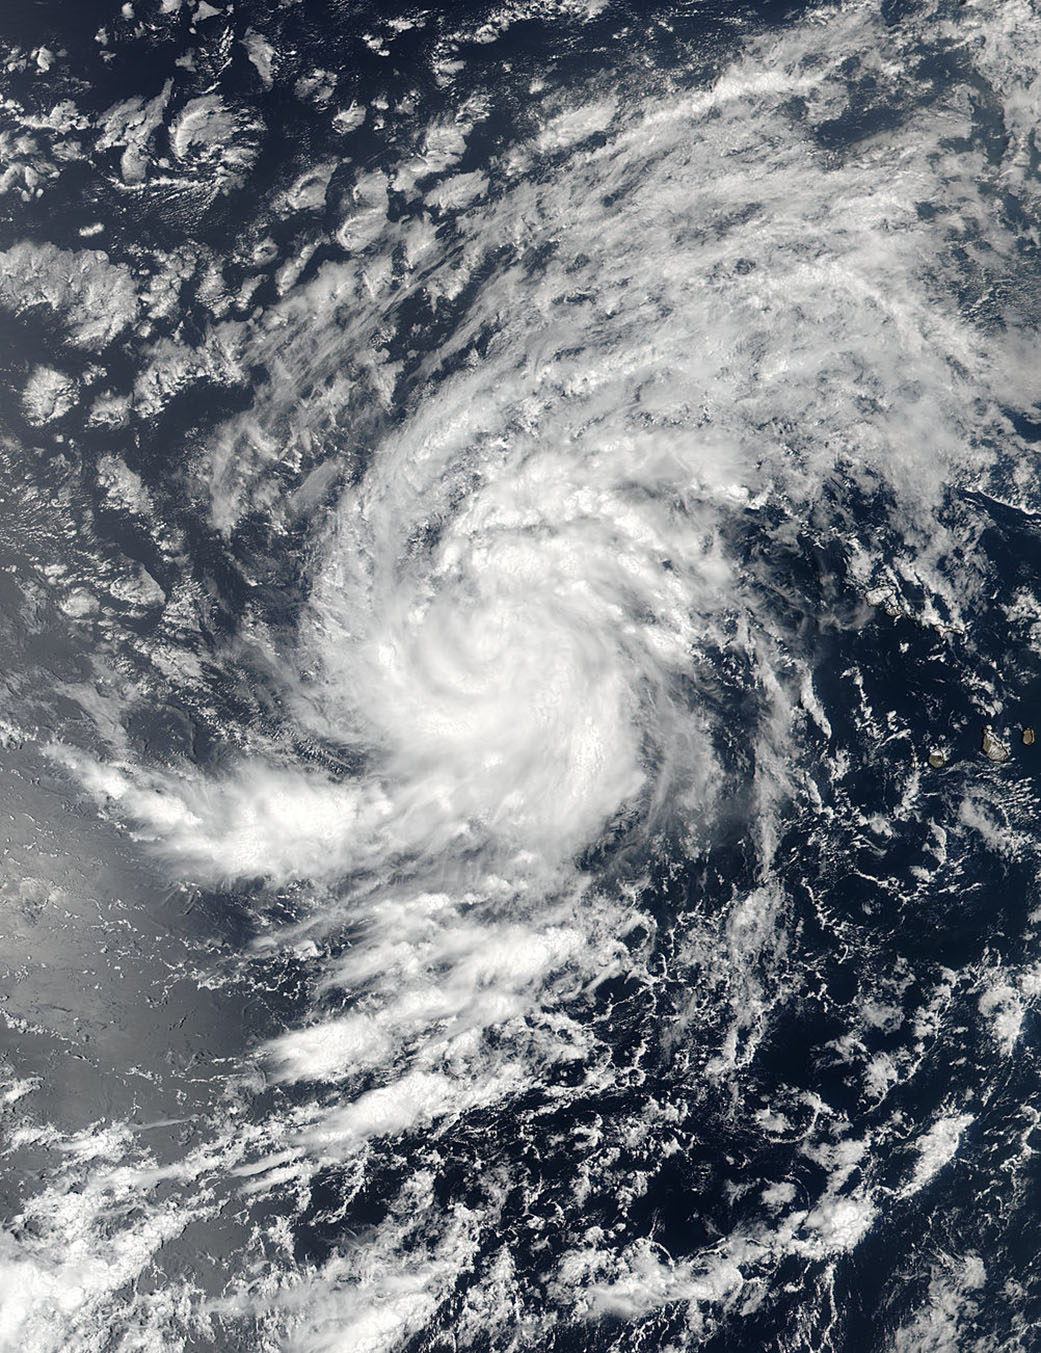
NASA-NOAA’s Suomi NPP satellite passed over Tropical Storm Irma in the eastern Atlantic Ocean and captured a visible image of the storm on the move.
Since Irma developed on Aug. 30 at 11 a.m. EDT it has been steadily strengthening. Just 24 hours later, the National Hurricane Center noted that the storm was approaching hurricane strength.
On Aug. 30 at 11:36 a.m. EDT (1536 UTC) the Visible Infrared Imaging Radiometer Suite (VIIRS) instrument aboard Suomi NPP satellite captured a visible image of Irma that showed many curved bands of thunderstorms around the center. Bands of thunderstorms were wrapping into Irma’s low level center from the west and south.
At 5 a.m. EDT (0900 UTC) on Aug. 31 the center of Tropical Storm Irma was located near 16.5 degrees north latitude and 32.9 degrees west longitude. Irma is far from land areas. It’s about 590 miles (950 km) west of the Cabo Verde Islands.
Irma was moving toward the west near 12 mph (19 kph). The National Hurricane Center said that a west-northwestward motion is expected today and tonight, followed by a generally westward motion on Friday, Sept. 1. Maximum sustained winds have increased to near 70 mph (110 kph) with higher gusts. The estimated minimum central pressure is 997 millibars.
Satellite imagery showed that Irma continued to become better organized with a developing central dense overcast and a few thunderstorm banding features. The storm appears fairly symmetric. Irma is moving over warm waters and an area where wind shear is expected to remain low, so the storm is expected to continue intensifying.
NHC said Irma is likely to become a hurricane later in the day on Thursday, Aug. 31.
For updated forecasts on Irma, visit: www.nhc.noaa.gov
Rob Gutro
NASA’s Goddard Space Flight Center
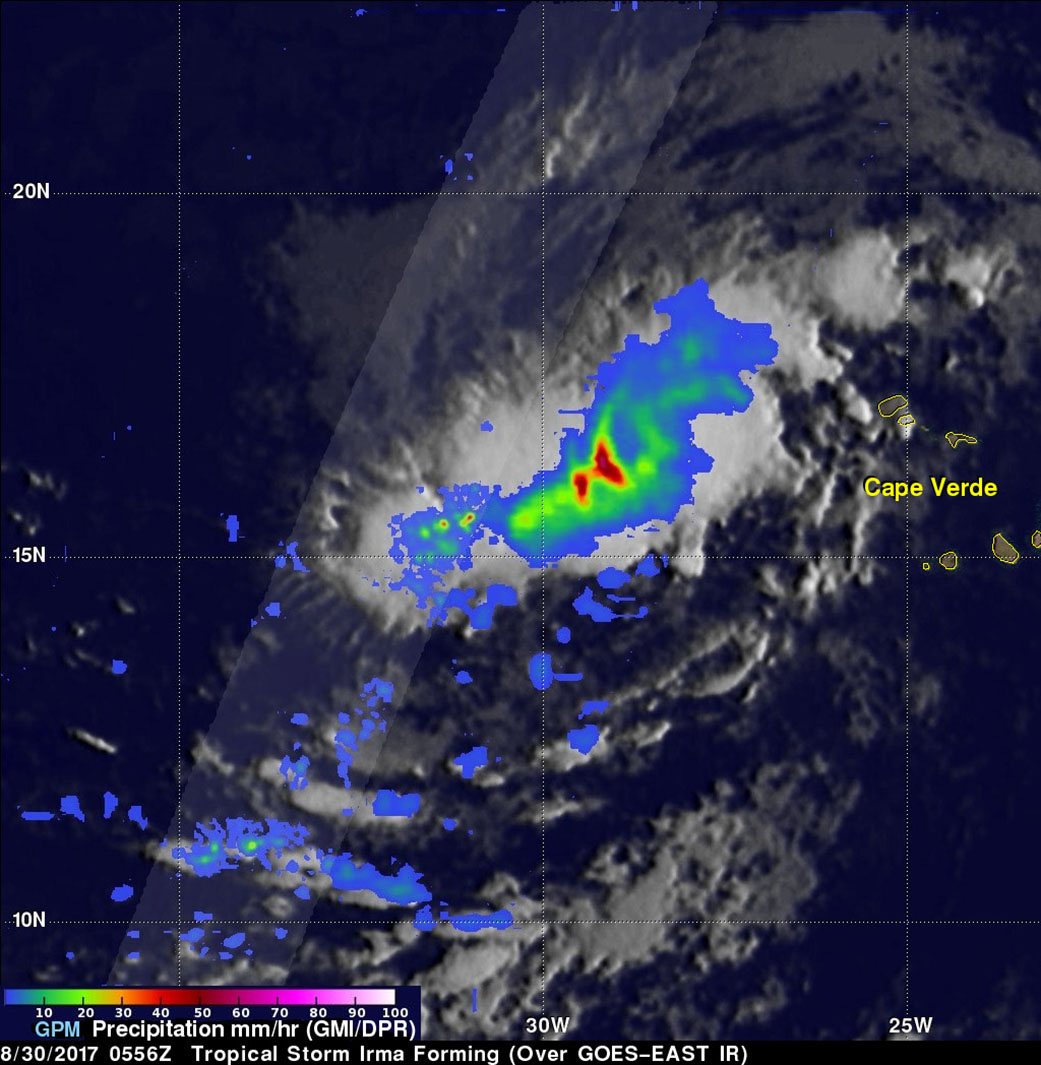
Aug. 30, 2017 – GPM Satellite Sees Tropical Storm Irma Forming Near Cape Verde Islands
The National Hurricane Center (NHC) upgraded a low pressure area in the far eastern Atlantic Ocean to tropical storm Irma on August 30, 2017 at 11 a.m. EDT (1500 UTC).
Tropical cyclones that form in that part of the Atlantic Ocean are often the largest and most powerful hurricanes of the season. Hurricanes Ivan (2004), Isabel (2003), Hugo (1989) and Allen (1980) are examples of past powerful hurricanes that formed near the Cape Verde islands.
The Global Precipitation Measurement mission or GPM core observatory satellite flew above forming tropical storm Irma on August 30, 2017 at 1:56 a.m. EDT (0556 UTC). This new tropical cyclone was forming from a tropical wave that was passing to the east of the Cape Verde islands.
Scans by GPM’s Microwave Imager (GMI) and Dual-Frequency Precipitation
Radar (DPR) instruments (shown in lighter shades) revealed that heavy rain was falling in this area of strong convective storms. Rain falling at a rate of over 2.6 inches (66 mm) per hour was indicated by GPM’s GMI. DPR scanned storms to the west of the center of circulation and found rain dropping at rate of over 4.96 inches (126 mm) per hour. GPM’s radar (DPR Ku band) showed that heights of convective storm tops located to the west of the forming tropical storm were reaching altitudes above 8.2 miles (13.2 km). GPM is a joint mission between NASA and the Japan Aerospace Exploration Agency, JAXA.
At 11 a.m. EDT (1500 UTC), the center of Tropical Storm Irma was located near 16.4 degrees north latitude and 30.3 degrees west longitude. That’s about 420 miles (675 km) west of the Cabo Verde Islands. Irma was moving toward the west near 13 mph (20 kph) and this general motion is expected to continue for the next couple of days.
Satellite wind data indicate that the maximum sustained winds are near 50 mph (85 kph) with higher gusts. Some strengthening is forecast during the next 48 hours and Irma could become a hurricane on Friday, Sept.1.
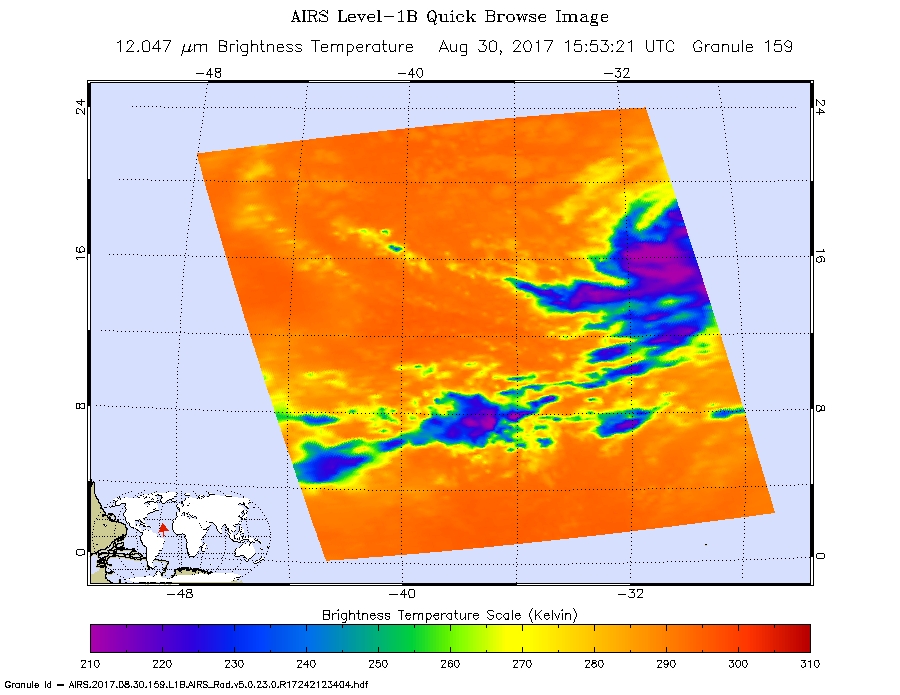
Infrared image of Irma’s western side confirmed the data from GPM. An infrared image was taken from the AIRS instrument aboard NASA’s Aqua satellite on Aug. 30 at 11:53 a.m. EDT (1553 UTC). AIRS found powerful storms with very cold cloud top temperatures as cold as minus 63 degrees Fahrenheit (minus 53 degrees Celsius). Storms with cloud tops that cold extend high into the troposphere and have the ability to generate heavy rainfall.
The National Hurricane Center (NHC) indicates that Irma is moving toward the west-northwest. Irma is then expected to stay at low latitudes next week while approaching the Lesser Antilles.
For updated forecasts, visit: www.nhc.noaa.gov
Hal Pierce/Rob Gutro
NASA’s Goddard Space Flight Center