


New NASA Maps Show Flooding Changes In Aftermath of Hurricane Harvey
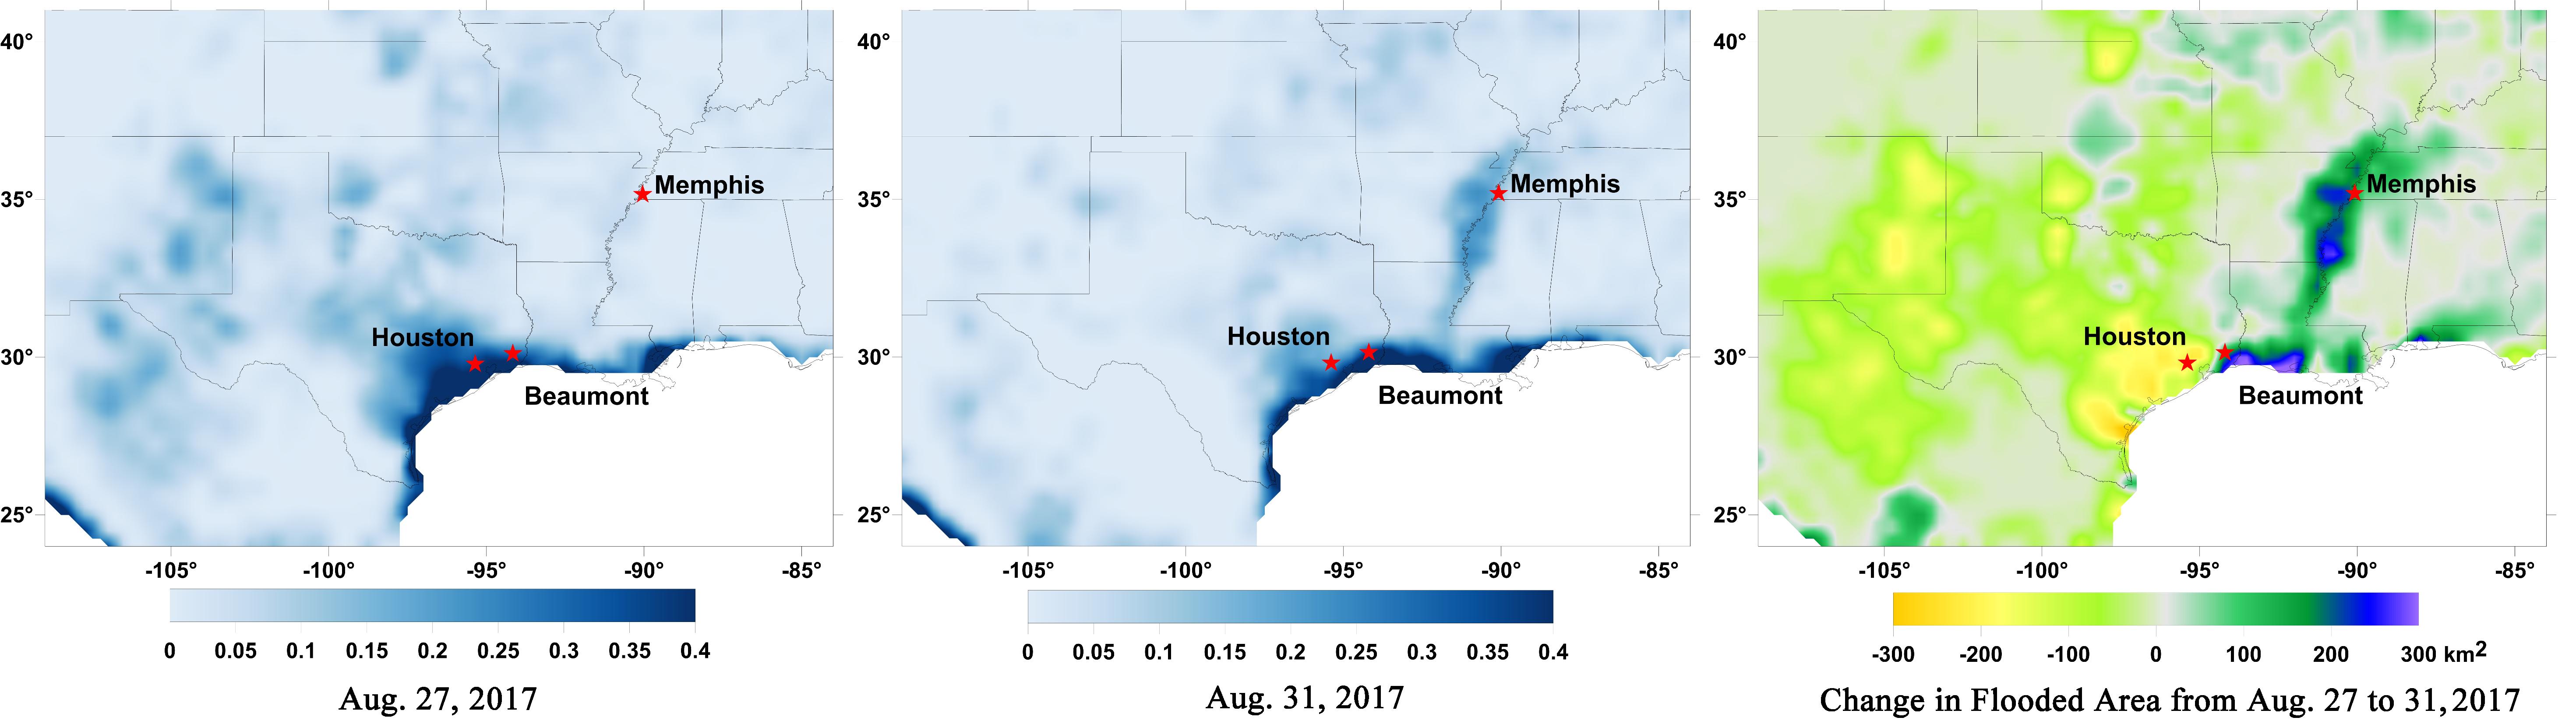
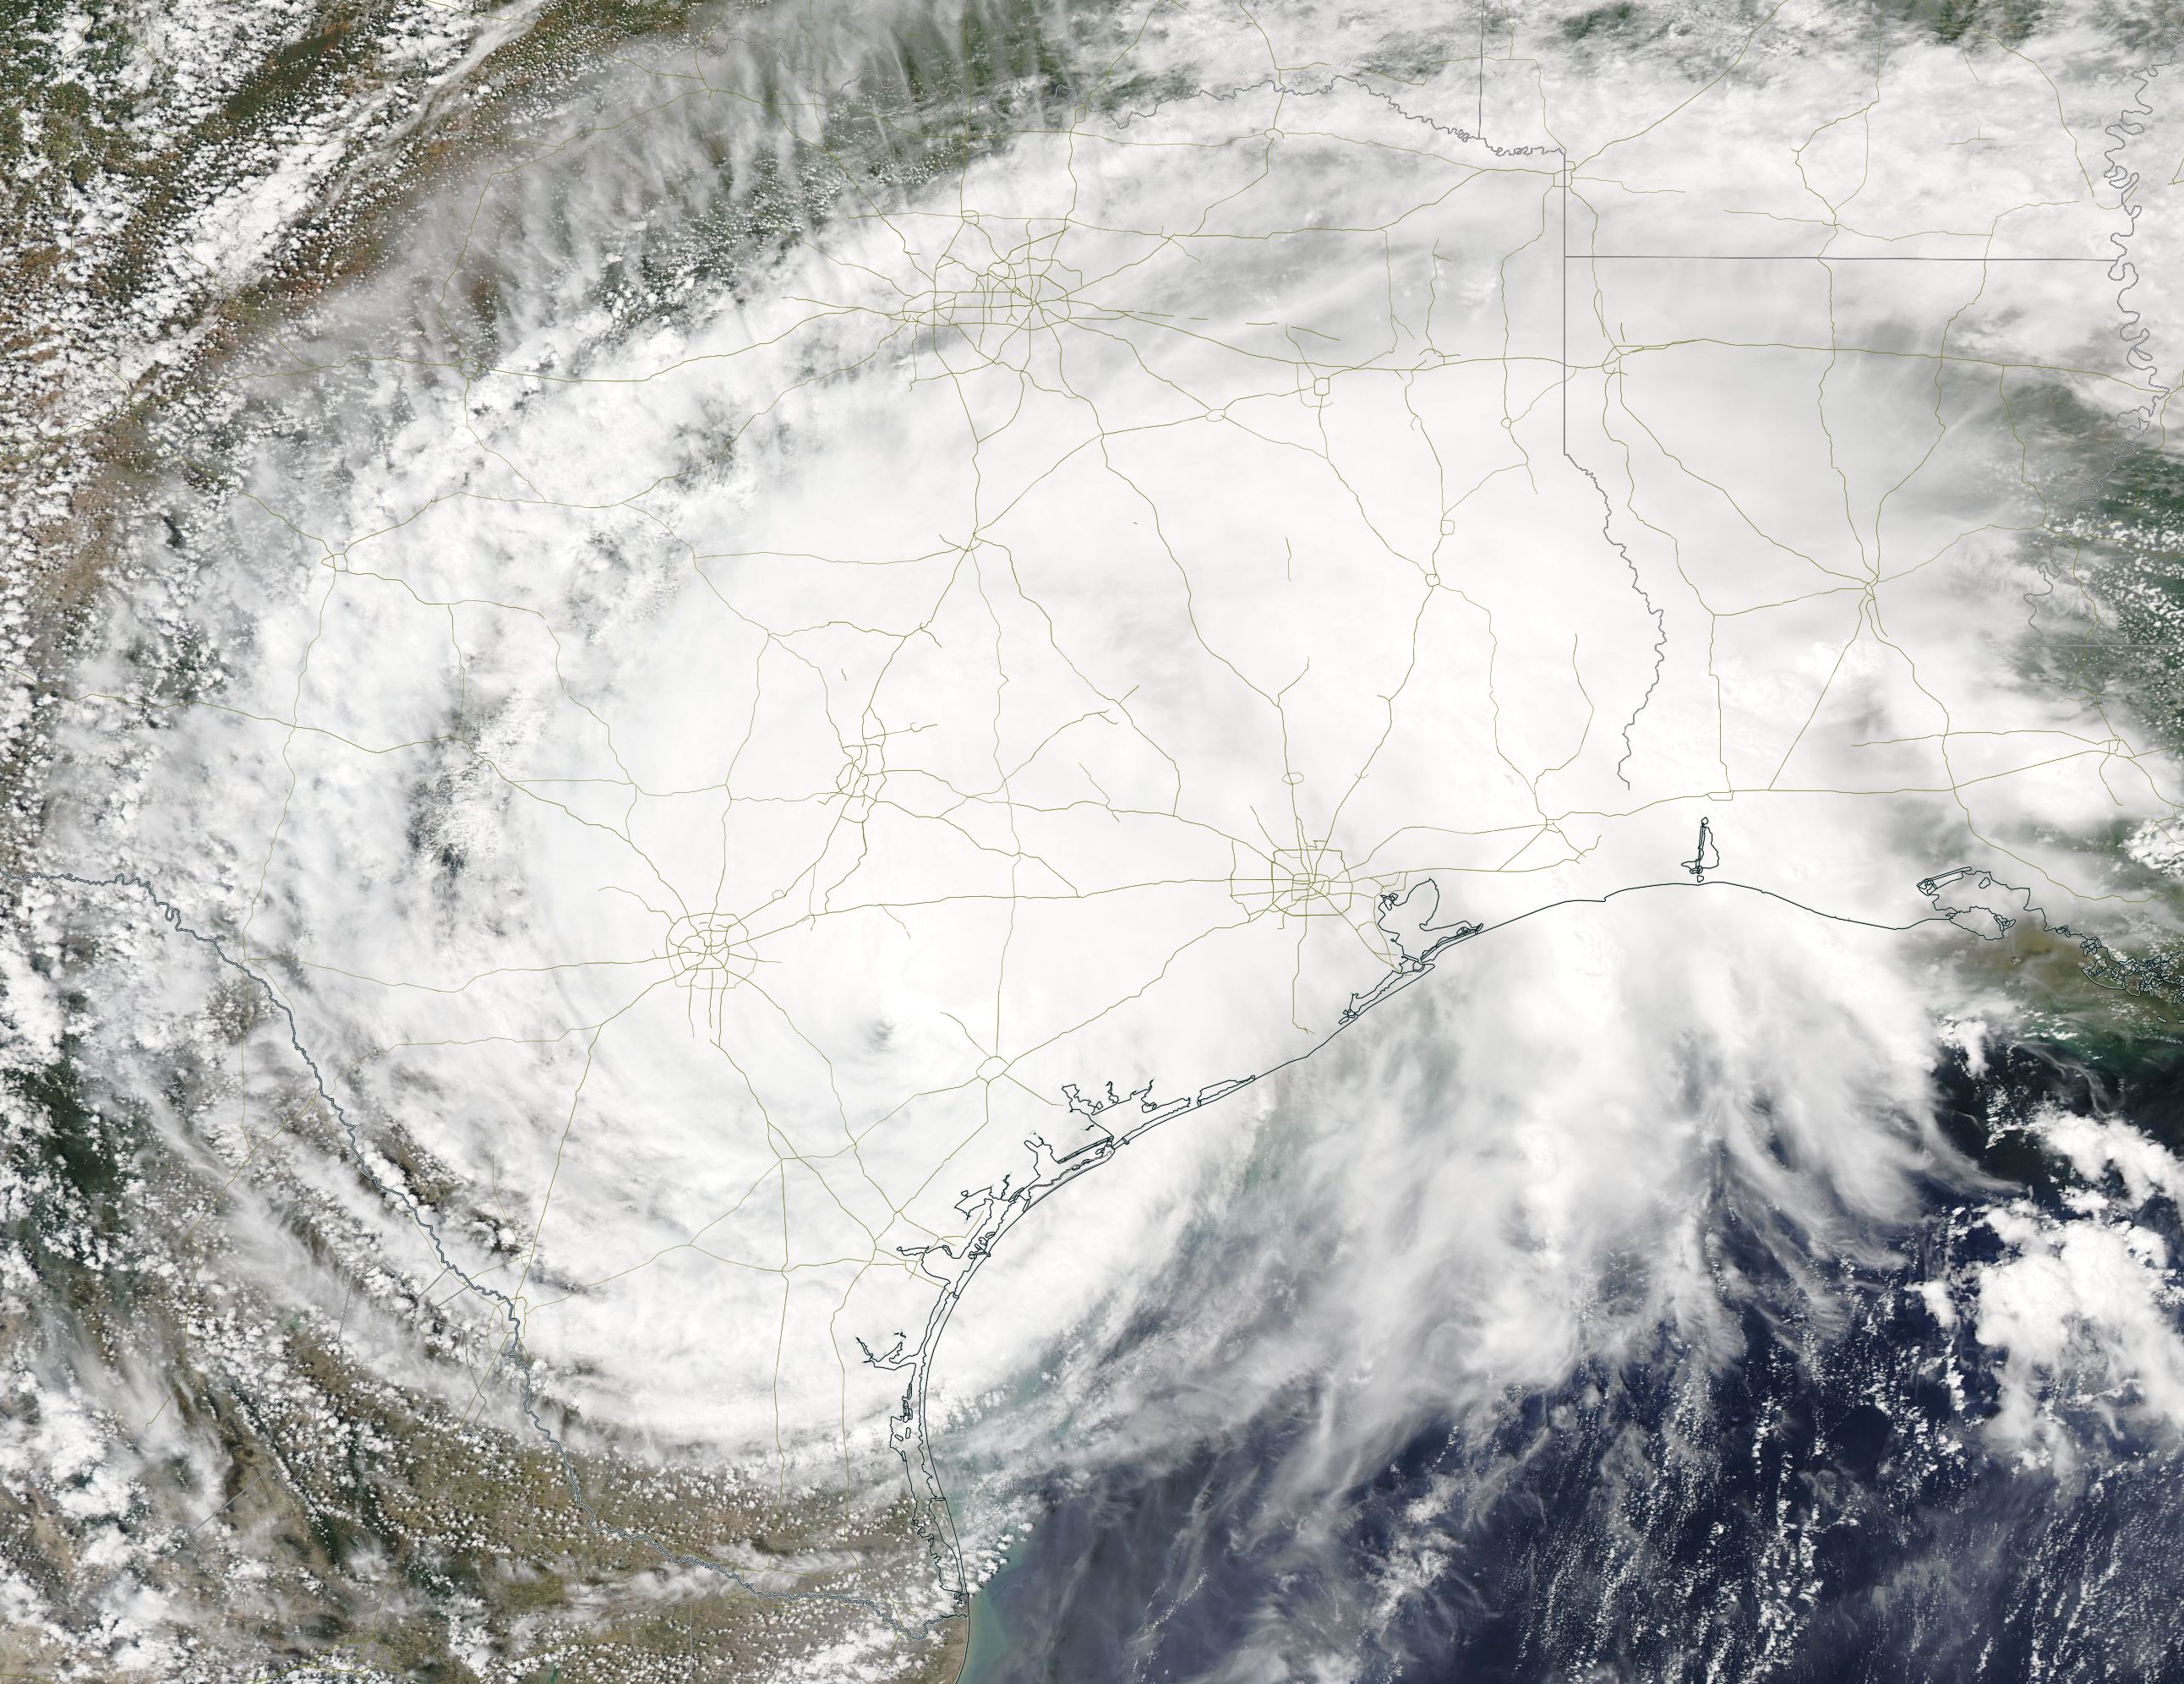
Data from NASA’s Soil Moisture Active Passive (SMAP) satellite have been used to create new surface flooding maps of Southeast Texas and the Tennessee Valley following Hurricane Harvey. The SMAP observations detect the proportional cover of surface water within the satellite sensor’s field of view. This sequence of images shows changes in the extent of surface flooding from successive five-day SMAP observation composite images. Widespread flooding can be seen in the Houston metropolitan area on Aug. 27 following record rainfall from the Category 4 hurricane, which made landfall on Aug. 25th, 2017 (left image). Flood waters around Houston had substantially receded by Aug. 31 (middle image), while flooding had increased across Louisiana, eastern Arkansas, and western Tennessee as then Tropical Storm Harvey passed over the area. The far right image shows the change in flooded area between Aug. 27 and Aug. 31, with regions showing the most flooding recession depicted in yellow and orange shades and those where flooding had increased depicted in blue shades. The SMAP satellite has a low-frequency (L-band) microwave radiometer with enhanced capabilities for detecting surface water changes in nearly all weather conditions and under low-to-moderate vegetation cover. SMAP provides global coverage with one-to-three-day repeat sampling that is well suited for global monitoring of inland surface water cover dynamics.
SMAP is managed for NASA’s Science Mission Directorate by NASA’s Jet Propulsion Laboratory in Pasadena, California, and NASA’s Goddard Space Flight Center in Greenbelt, Maryland. JPL is managed for NASA by Caltech. A consortium of researchers from other universities participate on the SMAP mission science team, including the Massachusetts Institute of Technology, Princeton University and the University of Montana, which provided the SMAP surface water imagery.
NASA-JPL/Caltech/GSFC/University of Montana
Sep. 06, 2017 – Hurricane Harvey Flooding Seen in New NASA Satellite Image
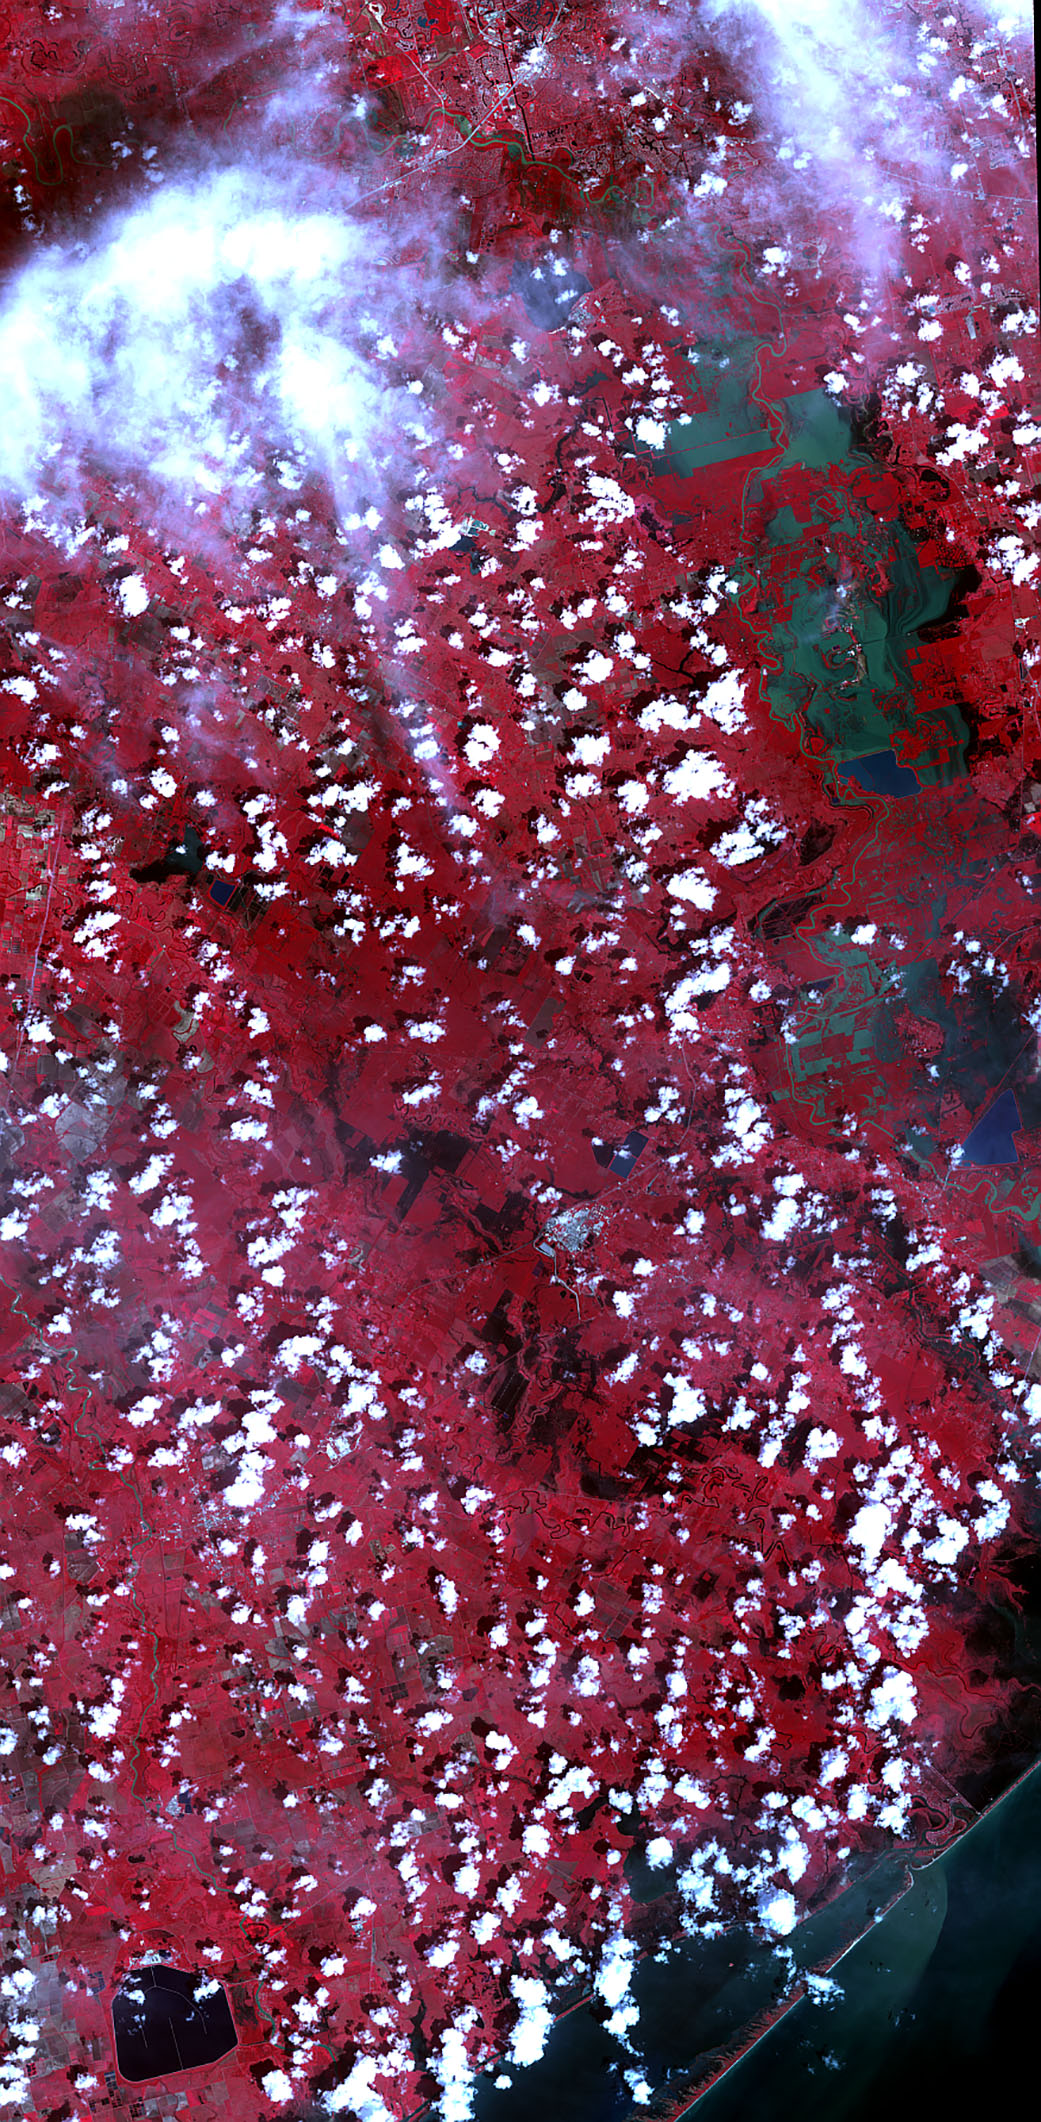
On Sept. 5, 2017, the Advanced Spaceborne Thermal Emission and Reflection Radiometer (ASTER) instrument on NASA’s Terra spacecraft captured this image of the area around Bay City, Texas, about 50 miles (80 kilometers) southwest of Houston. Hurricane Harvey caused extensive inland flooding, seen as dark blue areas where the water is relatively clear, and green-grey where the water carries sediment. The image covers an area of 32 by 65 miles (52 by 105 kilometers), and is centered at 29.2 degrees north, 95.8 degrees west.
With its 14 spectral bands from the visible to the thermal infrared wavelength region and its high spatial resolution of 15 to 90 meters (about 50 to 300 feet), ASTER images Earth to map and monitor the changing surface of our planet. ASTER is one of five Earth-observing instruments launched Dec. 18, 1999, on Terra. The instrument was built by Japan’s Ministry of Economy, Trade and Industry. A joint U.S./Japan science team is responsible for validation and calibration of the instrument and data products.
The broad spectral coverage and high spectral resolution of ASTER provides scientists in numerous disciplines with critical information for surface mapping and monitoring of dynamic conditions and temporal change. Example applications are: monitoring glacial advances and retreats; monitoring potentially active volcanoes; identifying crop stress; determining cloud morphology and physical properties; wetlands evaluation; thermal pollution monitoring; coral reef degradation; surface temperature mapping of soils and geology; and measuring surface heat balance.
The U.S. science team is located at NASA’s Jet Propulsion Laboratory, Pasadena, Calif. The Terra mission is part of NASA’s Science Mission Directorate, Washington, D.C.
More information about ASTER is available at http://asterweb.jpl.nasa.gov/.
NASA’s Jet Propulsion Lab
Pasadena, Ca.
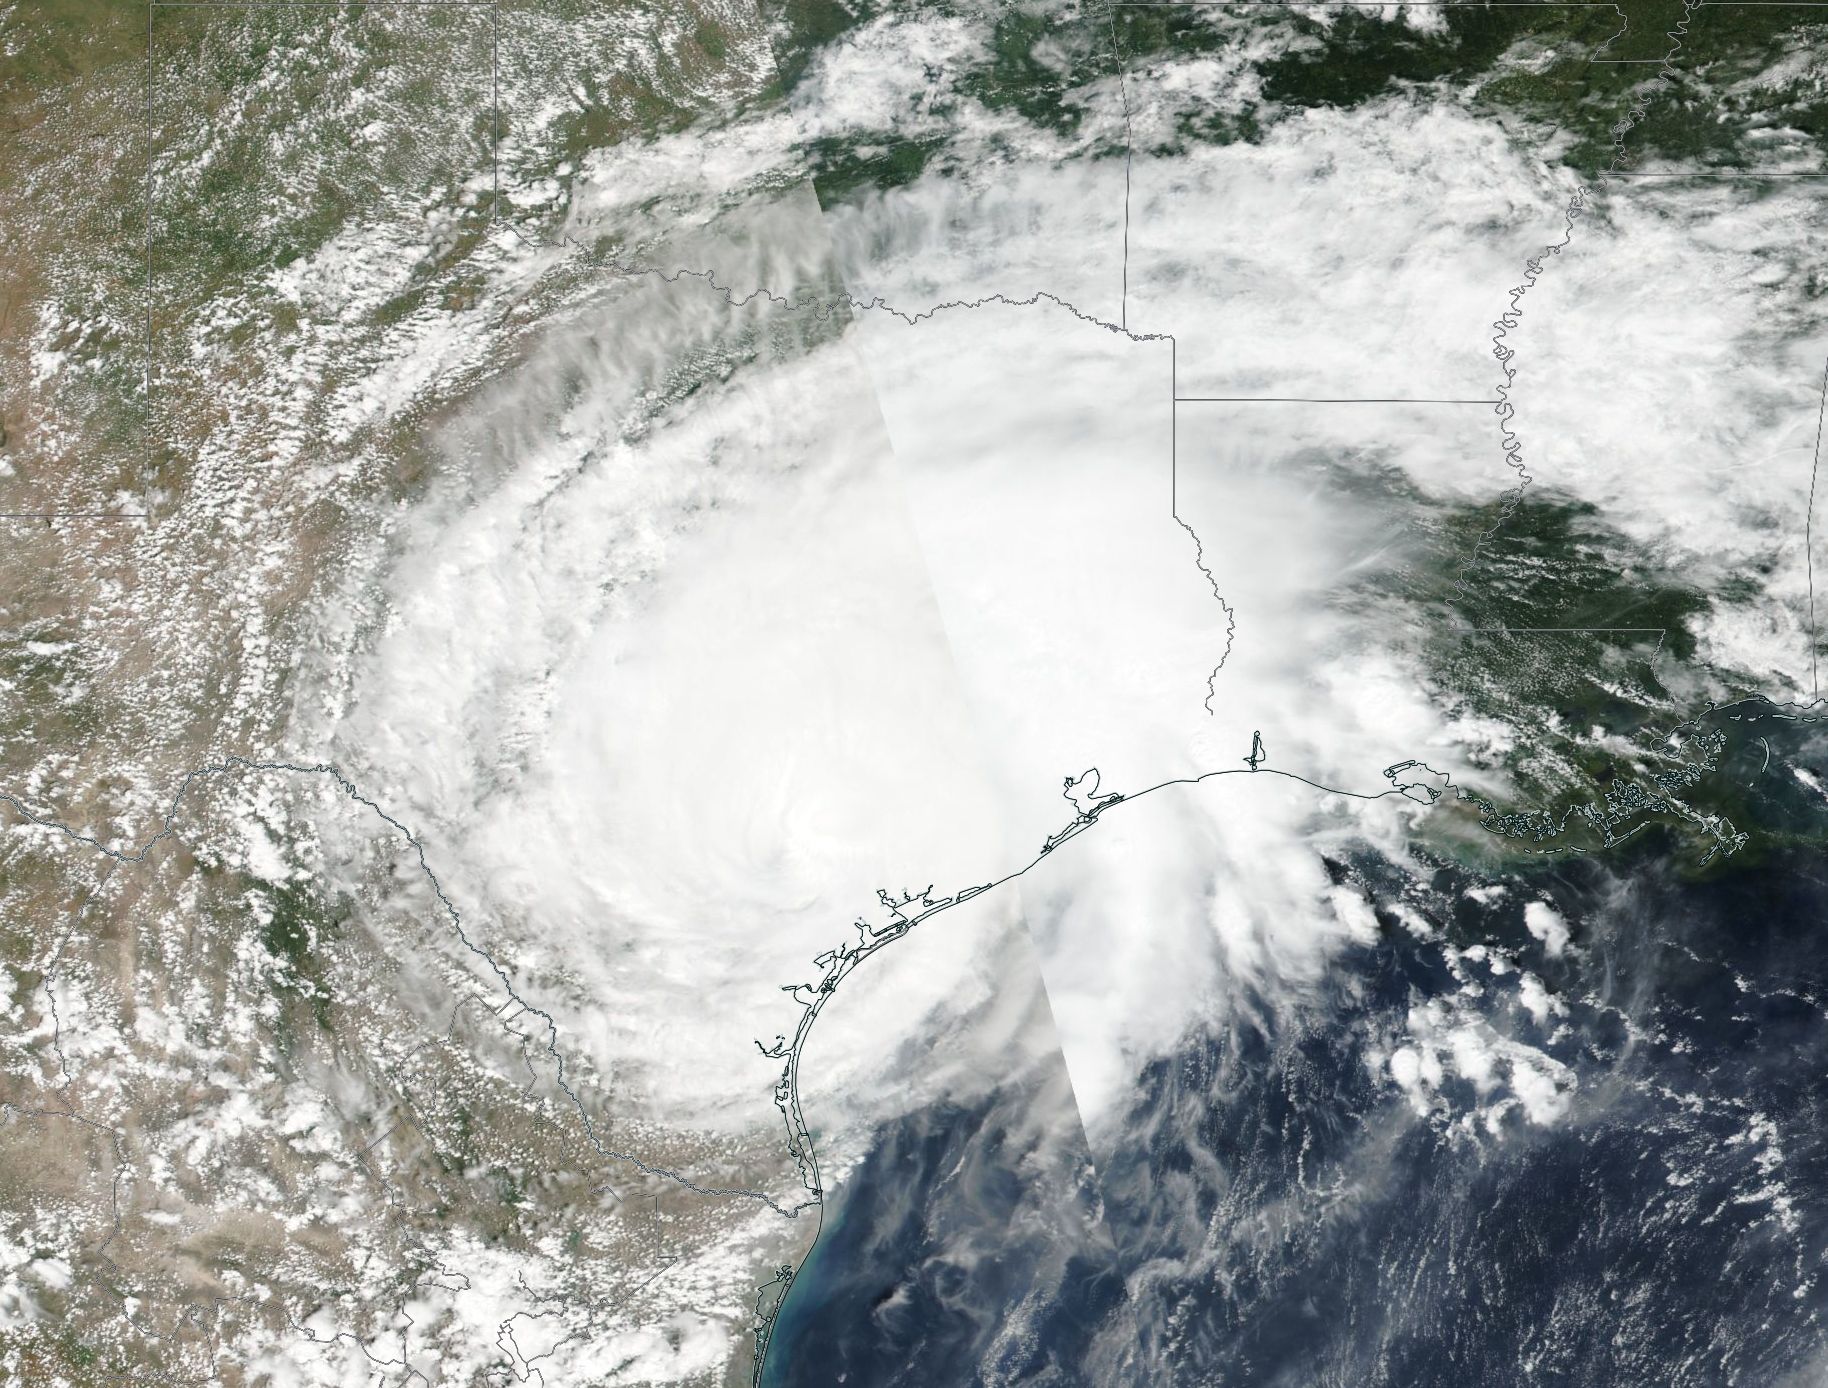
Sep. 01, 2017 – (Update #3) – Satellite Tracks Post-Tropical Cyclone Harvey Spreading into Ohio Valley
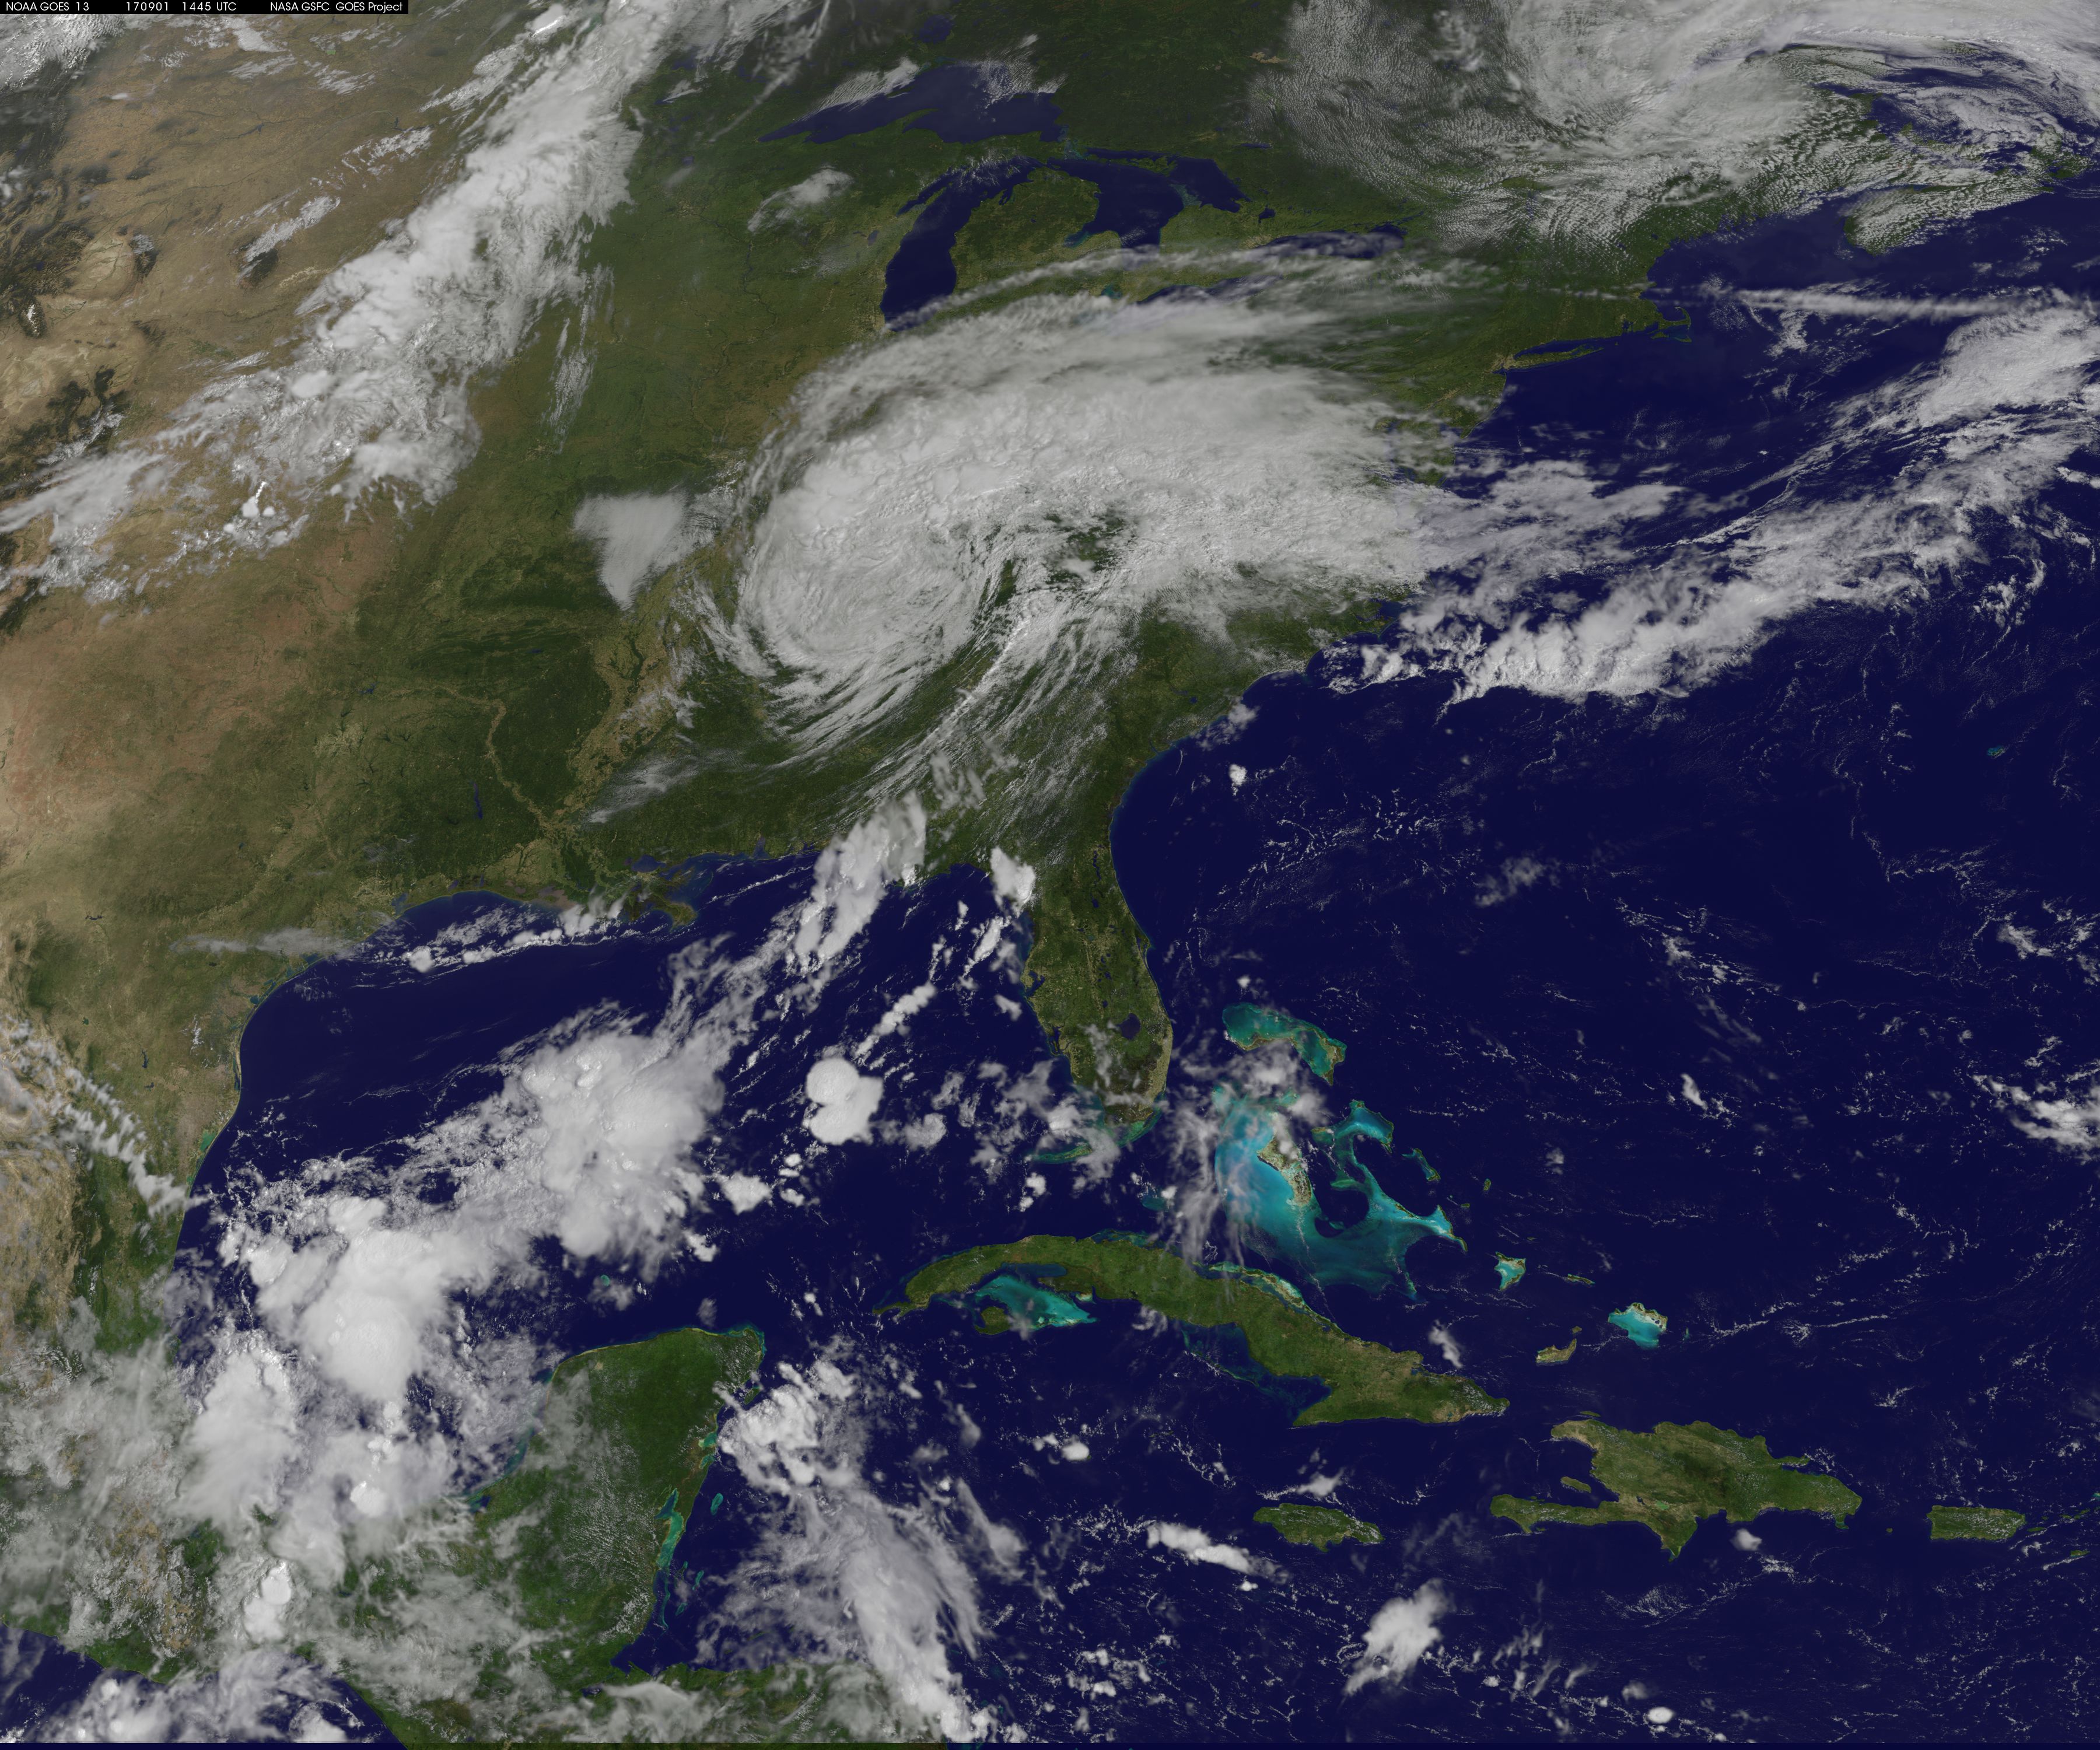
Harvey is beginning to lose tropical characteristics as heavy rain spread toward the Ohio valley on Sept. 1. NOAA’s GOES East satellite provided a visible image of the clouds associated with the depression. Although Harvey has moved north and east, severe flooding continues across far eastern Texas and western Louisiana today, Sept. 1.
On Sept. 1, 2017 at 10:45 a.m. EDT (1445 UTC) NOAA’s GOES East satellite captured this visible image of the clouds associated with Post-Tropical Cyclone Harvey blanketing the Tennessee and Ohio Valleys and extending into the Mid-Atlantic region.
The NASA/NOAA GOES Project at NASA’s Goddard Space Flight Center in Greenbelt, Maryland created an image. NOAA manages the GOES series of satellites and the NASA/NOAA GOES Project creates images and animations from the data.
Flood and Flash Flood Warnings and Watches in Effect
Flash flood watches and warnings are in effect from parts of Northern Mississippi across western Tennessee, Kentucky, southern Indiana and southwestern Ohio. Flood warnings remain in effect for parts of eastern Texas including the Houston metropolitan area and into western Louisiana.
NOAA’s Weather Prediction Center said Post-Tropical Cyclone Harvey is expected to produce an additional 1 to 3 inches of rain from western Kentucky into southeastern Indiana, southern Ohio and western West Virginia. Locally higher totals of 4 to 6 inches are possible around northern Kentucky. These rains will enhance the flash flooding risk across these areas. Meanwhile, widespread severe flooding will continue in and around Houston, Beaumont/Port Arthur/Orange, and eastward around the Louisiana border through the weekend.
Harvey’s Location on Friday, September 1, 2017
Credits: NASA-NOAA GOES Project
On Sept. 1 at 11 a.m. EDT (1500 UTC) the center of Post-Tropical Cyclone Harvey was located near 36.4 degrees north latitude and 87.1 degrees west longitude. That puts the center about 30 miles (50 km) northwest of Nashville, Tennessee and about 111 miles (175 km) east-southeast of Paducah, Kentucky.
NOAA’s Weather Prediction Center noted that radar and satellite imagery show a loss of most tropical characteristics. Much of the moderate to heavy rains are organized to the north of the circulation center ahead of a warm front.
Harvey is moving northeastward toward the Ohio Valley and is expected to weaken Into Saturday, Sept. 2. An upper-level trough (elongated area of low pressure) arriving from the great lakes should begin to interact with the Harvey in Ohio on Sept. 2 and this is expected to support a secondary extratropical low over New England on Sept. 3. Minimum central pressure is 1002 millibars.
Public Advisories from the Weather Prediction Center will provide updates as long as the system remains a flood threat.
Rob Gutro
NASA’s Goddard Space Flight Center
Sep. 01, 2017 – (Update #2) – Harvey’s Rainfall Chills the Gulf
Hurricane Harvey dropped unfathomable amounts of rainwater on Houston and southern Texas from August 25–30, 2017. The potent category 4 hurricane and long-lived tropical storm also churned up the Gulf of Mexico with its winds and storm surges, dispersing warm surface water and mixing up cooler water from the depths.
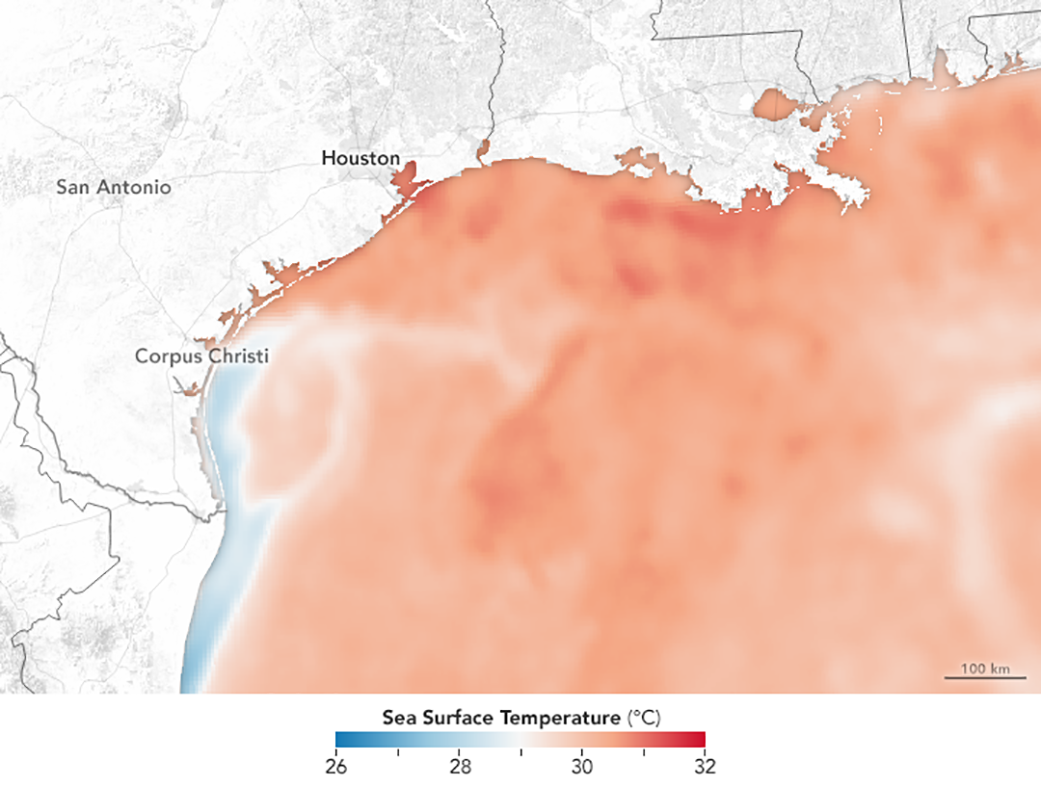
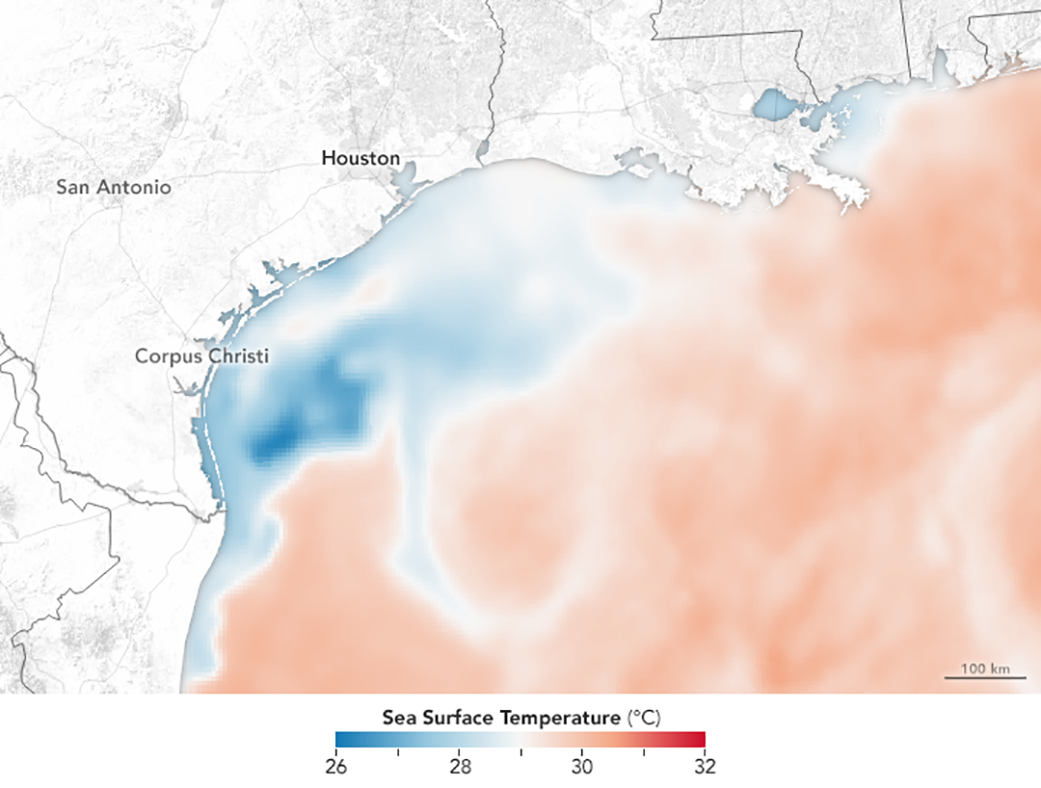
All of that falling fresh water and ocean mixing had the combined effect of drastically cooling off the surface waters in the Gulf of Mexico. The maps above show sea surface temperatures in the northern Gulf on August 23 and August 30, 2017. The data were compiled by Coral Reef Watch, which blends observations from the Suomi NPP, MTSAT, Meteosat, and GOES satellites with computer models.
NASA Earth Observatory images by Joshua Stevens, using data from Coral Reef Watch. Story by Mike Carlowicz.
Link to original Earth Observatory story with full sized images – https://earthobservatory.nasa.gov/NaturalHazards/view.php?id=90870
- Instrument(s):
- Model
- Suomi NPP – VIIRS
Sep. 01, 2017 – (Update #1) Texas Waters Run Brown After Harvey
On August 31, 2017, the Moderate Resolution Imaging Spectroradiometer (MODIS) on NASA’s Terra satellite captured this image of the Texas coast and the Houston metropolitan area. Note the brown rivers and bays, full of flood water from Hurricane Harvey. Along the coast, muddy, sediment-laden waters from inland pour into a Gulf of Mexico that also was churned up by the relentless storm.
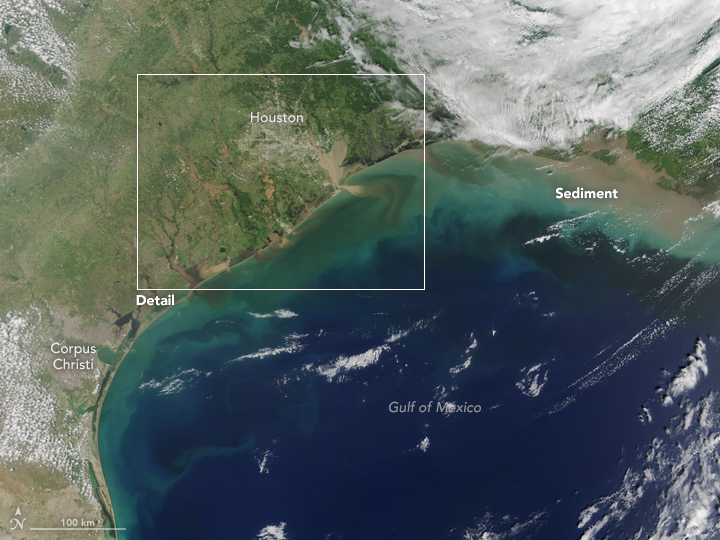
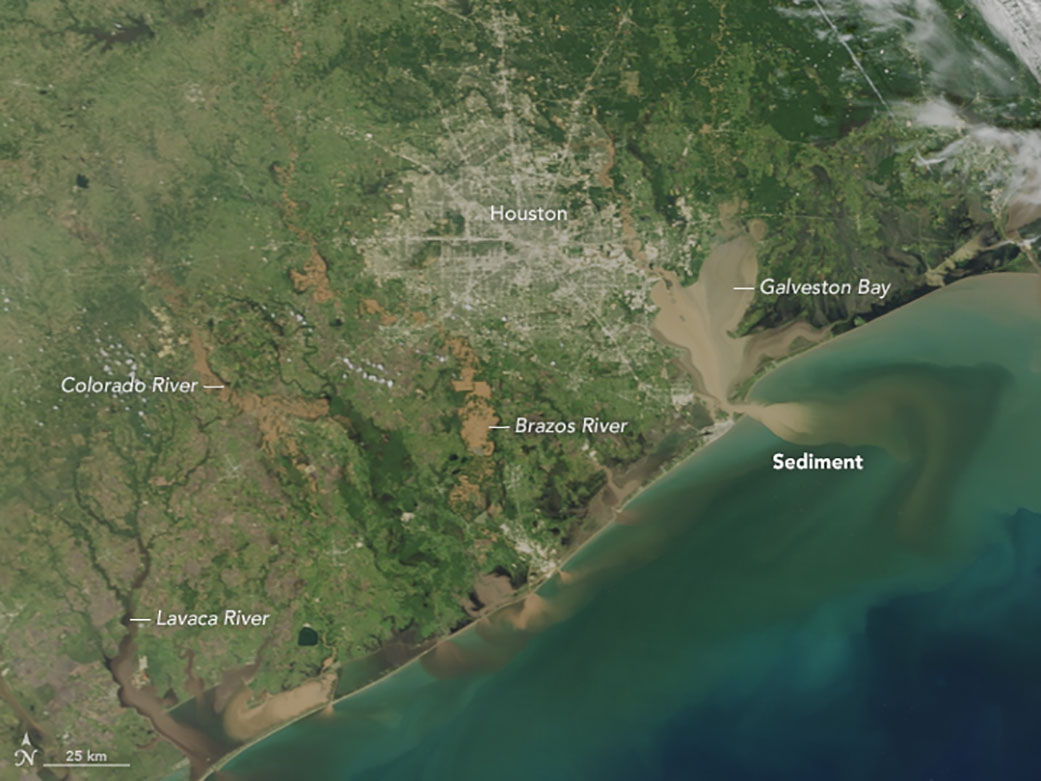
NASA Earth Observatory image by Jesse Allen, using data from the Land Atmosphere Near real-time Capability for EOS (LANCE). Caption by Michael Carlowicz.
Link to original story on Earth Observatory and link to original images: https://earthobservatory.nasa.gov/NaturalHazards/view.php?id=90866
Instrument(s): Terra – MODIS
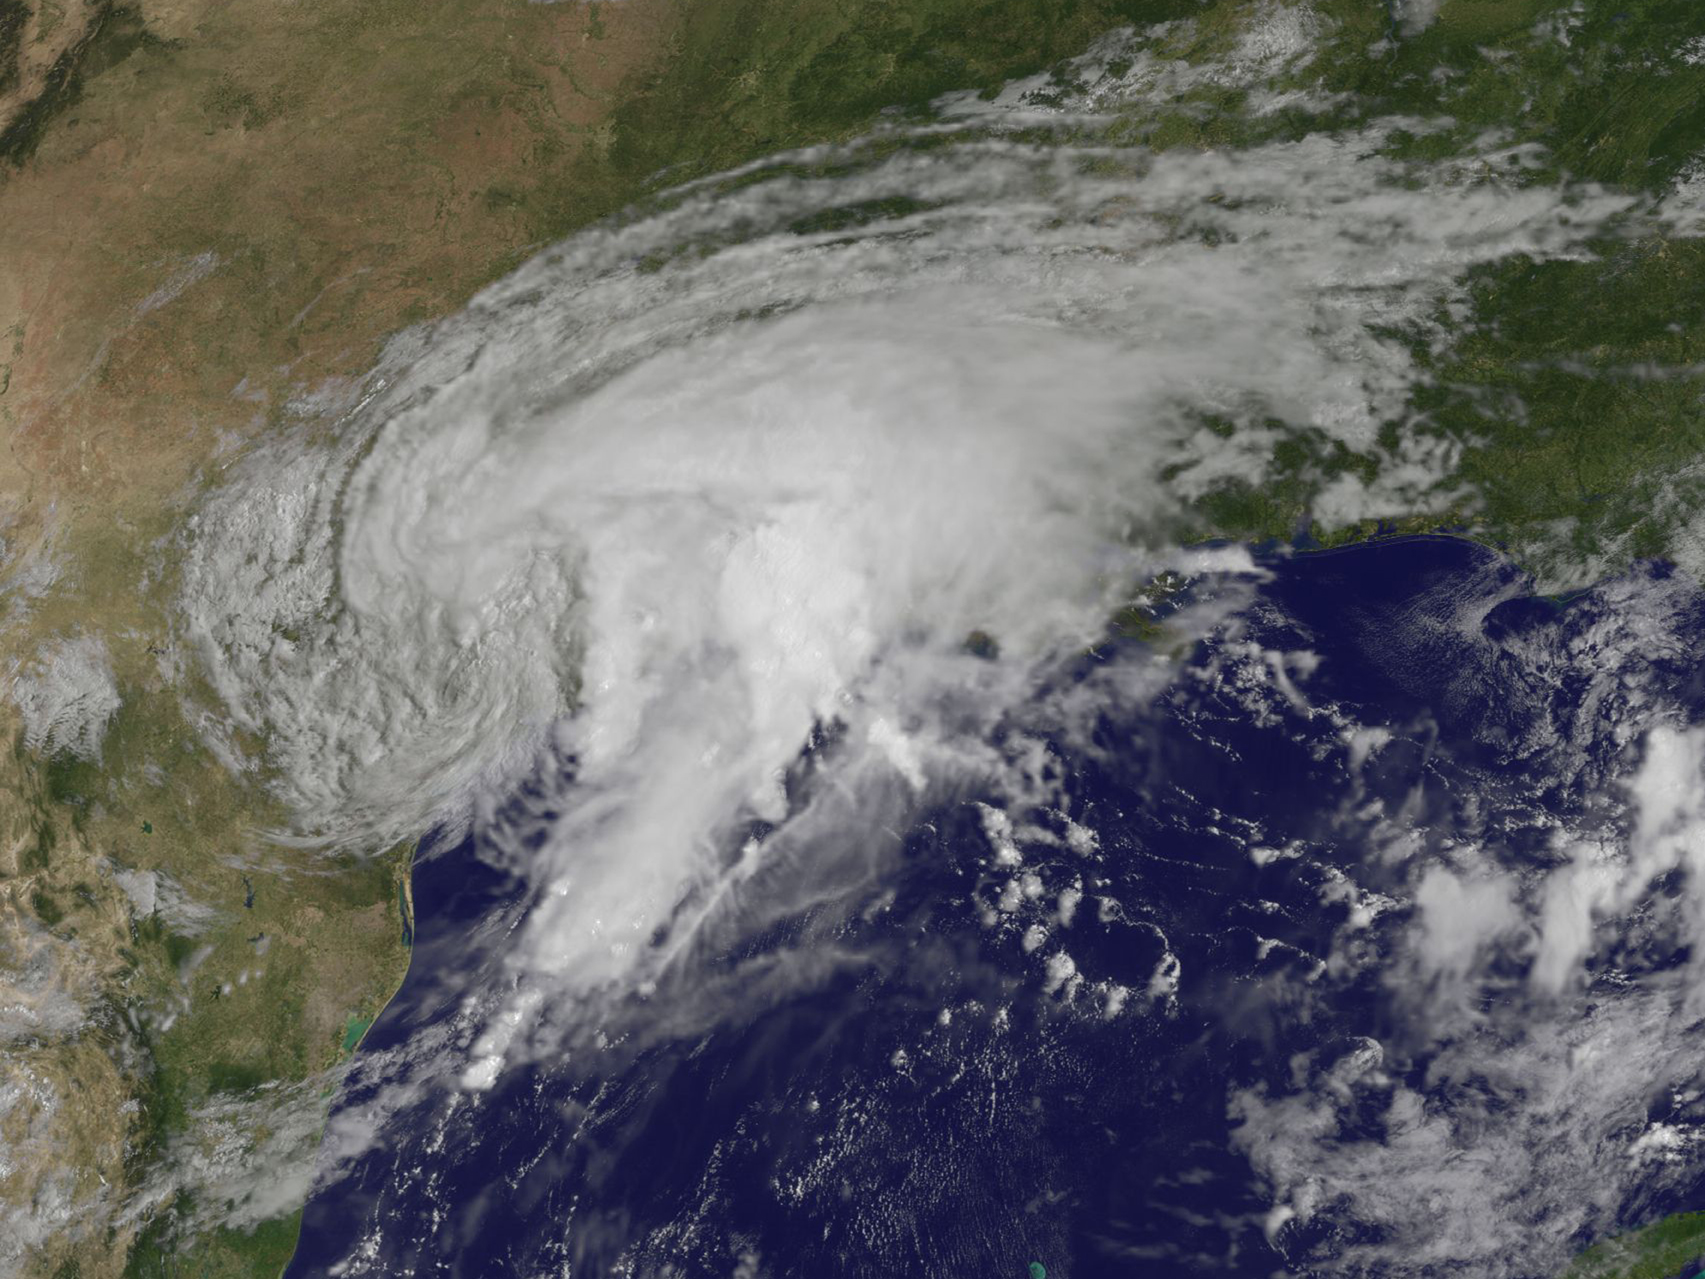
Aug. 31, 2017 – (Update #3) NASA SMAP Creates Surface Flooding Maps from Hurricane Harvey
A new series of images generated with data from NASA’s Soil Moisture Active Passive (SMAP) satellite illustrate the surface flooding caused by Hurricane Harvey from before its initial landfall through August 27, 2017. Harvey is now a depression spreading heavy rainfall through the south central and southeastern U.S.
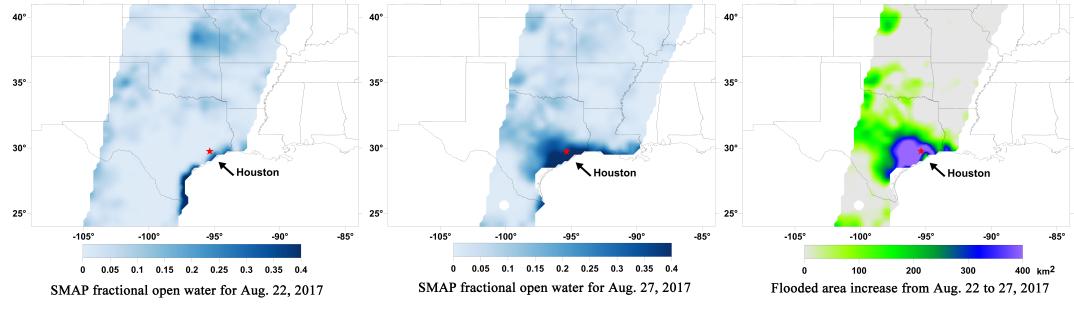
The SMAP observations detect the proportion of the ground covered by surface water within the satellite’s field of view. The sequence of images depicts successive satellite orbital swath observations showing the surface water conditions on August 22, before Harvey’s landfall and then on Aug. 27, two days after landfall.
The resulting increase in surface flooding from record rainfall over the three-day period depicts regionally heavy flooding around the Houston metropolitan area. The hardest hit areas cover more than 23,000 square miles (about 59,600 square kilometers) and indicate a more than 1,000-fold increase in surface water cover from rainfall-driven flooding. SMAP’s low-frequency (L-band) microwave radiometer features enhanced capabilities for detecting surface water changes in nearly all weather conditions and under low-to-moderate vegetation cover. The satellite provides global coverage with one to three-day repeat sampling, which is well suited for monitoring dynamic inland waters around the world.
Other NASA satellites continue to gather data on Harvey as it moves through the middle of the U.S. and weakens.
NASA’s Aqua satellite provided a visible and infrared look at the weakening, soaking storm.
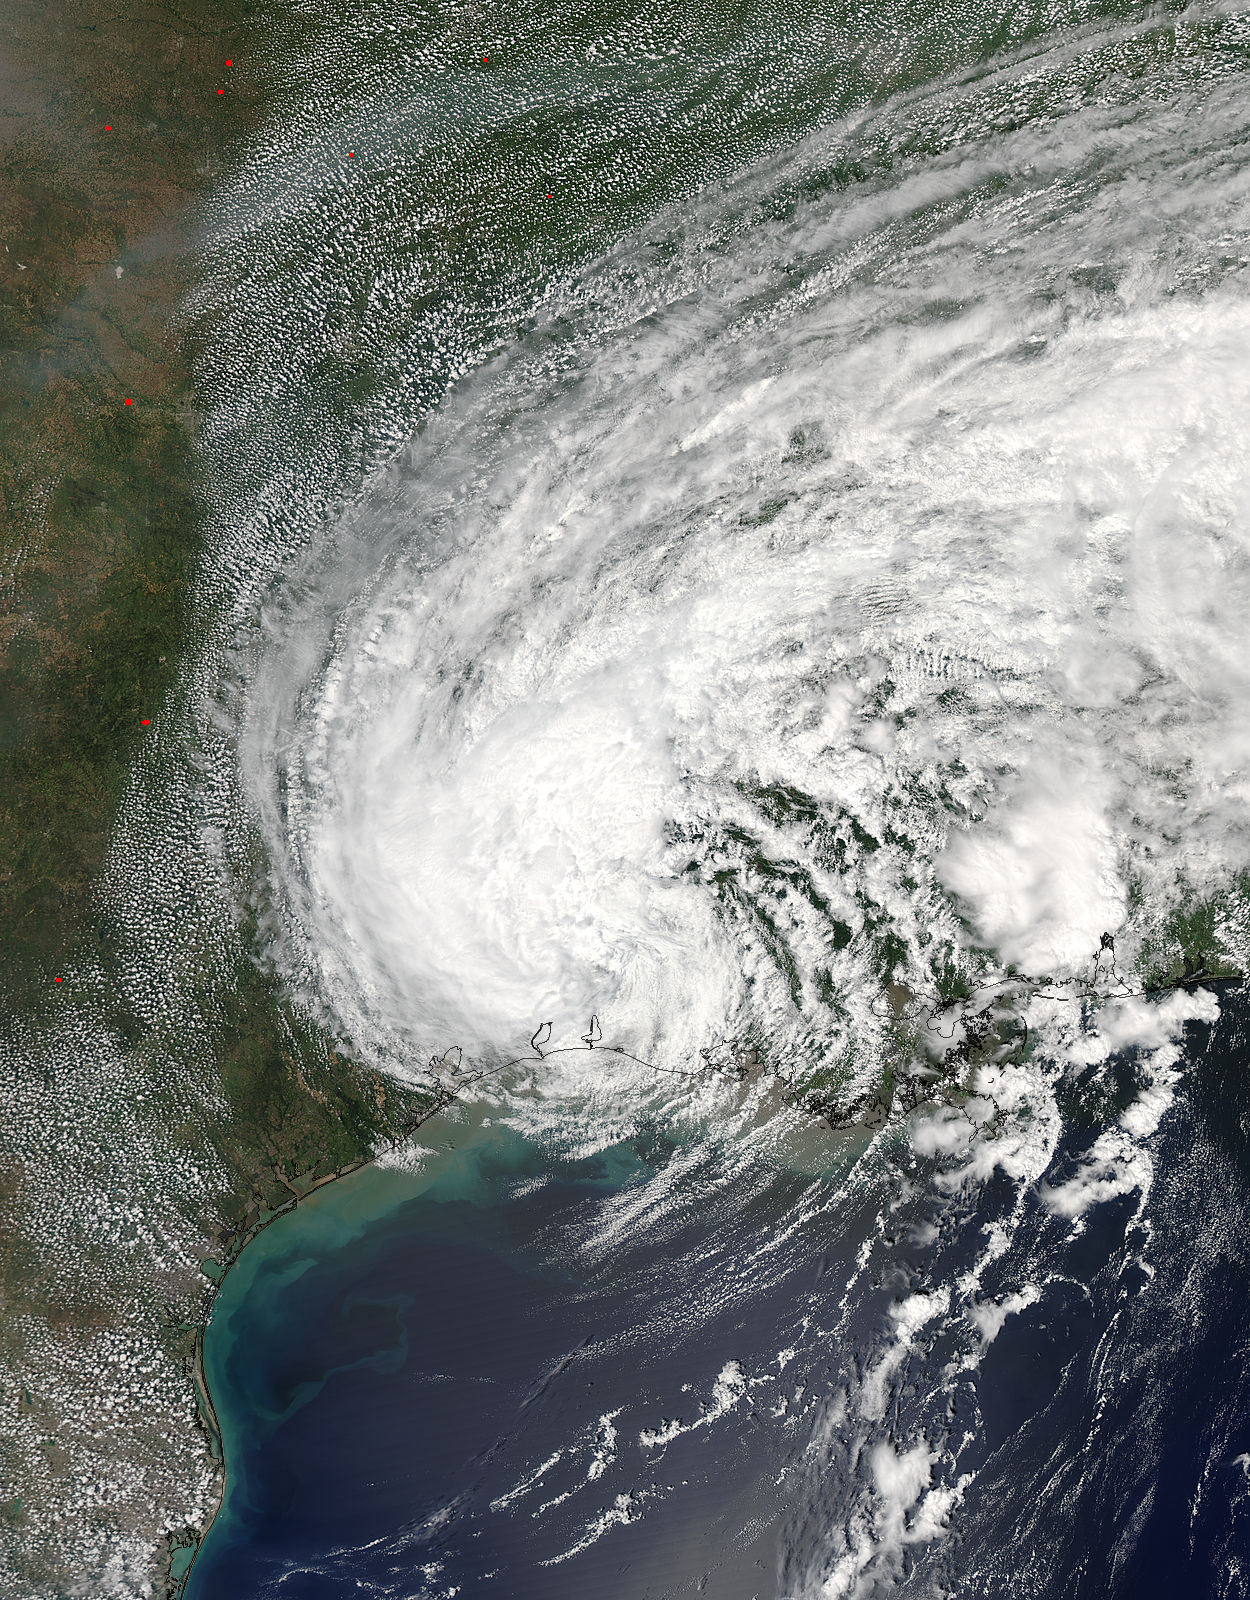
NASA’s Aqua Satellite Provides a Double View of Harvey
On Aug. 30 at 3:20 p.m. EDT the Moderate Resolution Imaging Spectroradiometer or MODIS instrument aboard NASA’s Aqua satellite captured a visible light image of Tropical Storm Harvey moving north over Texas and Louisiana. At the same time, the Atmospheric Infrared Sounder or AIRS instrument aboard Aqua provided temperature data in infrared light. AIRS showed some areas with strongest storms and coldest cloud top temperatures near northwestern Louisiana and in bands of thunderstorms over southern Mississippi, northwestern Alabama, and southwestern Georgia. Cloud top temperatures in those areas were as cold as minus 63 degrees Fahrenheit (minus 53 degrees Celsius). Storms with temperatures that cold have been shown to generate heavy rainfall.
Harvey’s Status on Aug. 31
The National Hurricane Center (NHC) has issued its final advisory on Harvey. Public Advisories from the Weather Prediction Center (WPC) will provide updates as long as the system remains a flood threat.
By Aug. 31, Harvey had been downgraded to a depression and was generating flooding rains in far eastern Texas and western Louisiana with heavy rainfall spreading northeastward through the Lower Mississippi Valley and into the Tennessee and Ohio Valleys and central Appalachians over the next day or two.
At 11 a.m. EDT (1500 UTC) the center of tropical depression Harvey was located near 32.5 degrees north latitude and 91.4 degrees west longitude. WPC said Tropical Depression Harvey is moving towards the northeast and is expected to continue this motion over the next 48 hours. This forecast track takes Harvey into northern Mississippi by Thursday evening, middle Tennessee by Friday, and into the Ohio Valley states on Saturday, Sept. 2 as a post-tropical low.
Harvey’s Rainfall Spreading North and East
WPC said: Tropical Depression Harvey is expected to produce 3 to 5 inches of rain from eastern Arkansas and northern Mississippi northeastward across western to central Tennessee, western to central Kentucky, southern Ohio and into West Virginia. Locally Higher totals of 6 to 10 inches are possible across northern Mississippi, western Tennessee and into southwest Kentucky. These Rains will enhance the flash flooding risk across these areas, especially in northern Mississippi, western Tennessee and southwest Kentucky. However widespread flooding will continue in and around Houston, Beaumont/Port Arthur/Orange, and eastward around the Louisiana border through the weekend. The expected heavy rains spreading northeastward from Louisiana into western
Kentucky may also lead to flash flooding and increased river and small stream flooding.
About SMAP
SMAP is managed for NASA’s Science Mission Directorate in Washington by NASA’s Jet Propulsion Laboratory in Pasadena, California, and NASA’s Goddard Space Flight Center in Greenbelt, Maryland. JPL is managed for NASA by Caltech. A consortium of researchers from other universities participate on the SMAP science team, including the Massachusetts Institute of Technology in Cambridge; Princeton University in Princeton, New Jersey; and the University of Montana in Missoula, which provided the SMAP surface water imagery.
For more information about SMAP, visit http://smap.jpl.nasa.gov
For rainfall totals, visit: http://www.nhc.noaa.gov/text/refresh/MIAWPCAT4+shtml/311459.shtml
For updated forecasts on Harvey, visit: http://www.nhc.noaa.gov/#Harvey
Karen Boggs / Rob Gutro
NASA’s Jet Propulsion Laboratory, Pasadena, Calif.
NASA’s Goddard Space Flight Center, Greenbelt, Md.
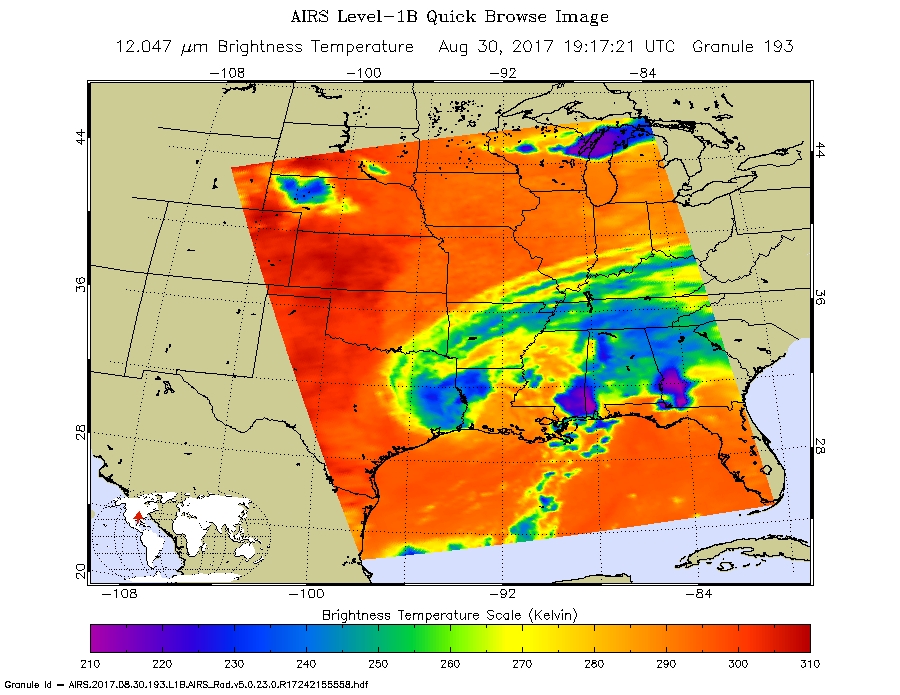
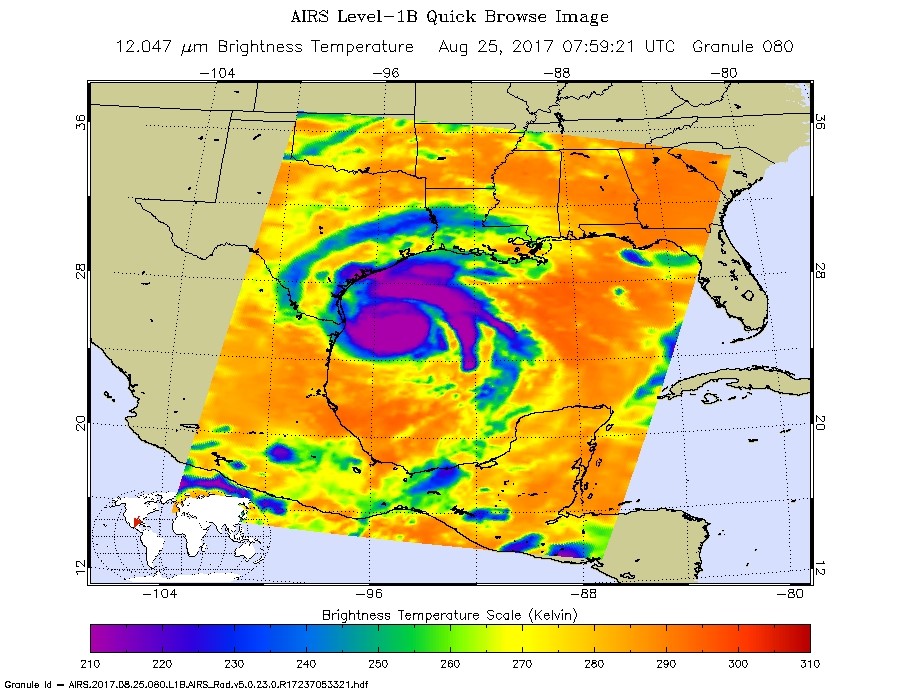
Aug. 30, 2017 – (Update #2) – NASA Finding Harvey’s Strongest Storms
Infrared data provides temperature information and the highest, coldest cloud tops in tropical cyclones indicate where the strongest storms are located. NASA’s AIRS instrument provides that critical temperature information and captured an image of Harvey within the hour of its landfall in southwestern Louisiana. Harvey made landfall just west of Cameron, Louisiana at 4 a.m. CDT, Aug. 30.
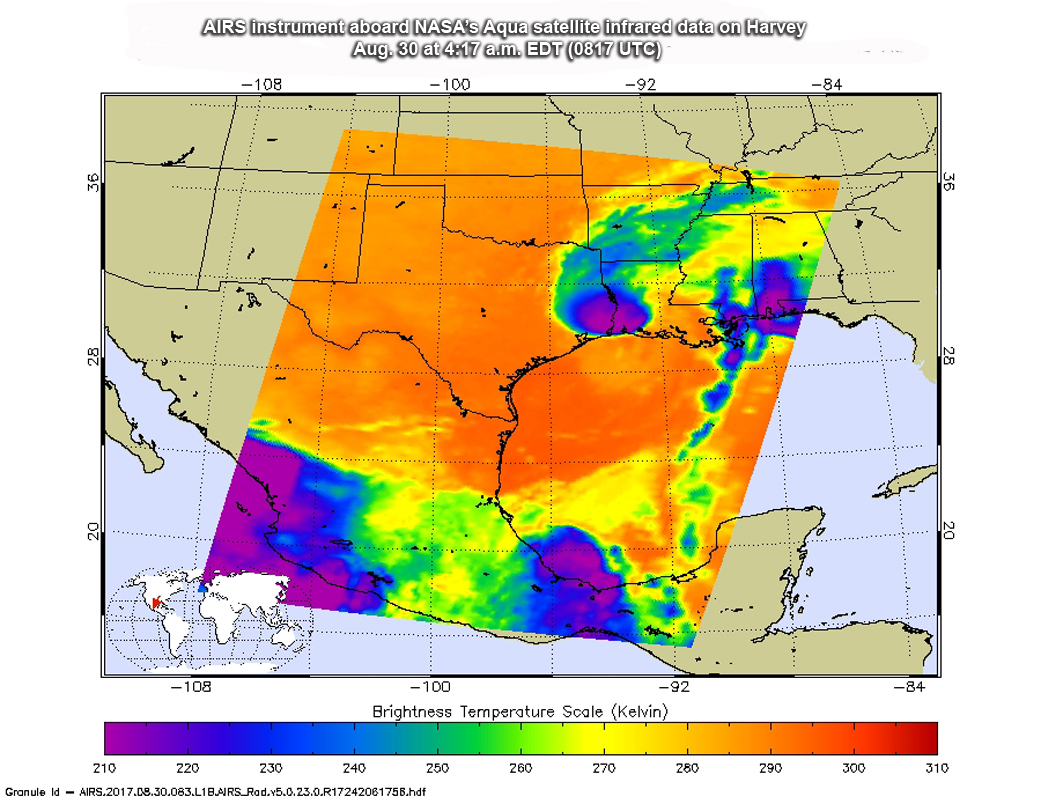
The Atmospheric Infrared Sounder or AIRS instrument that flies aboard NASA’s Aqua satellite looked at Tropical Storm Harvey in infrared light. The infrared image of Tropical Storm Harvey occurred at the same hour of landfall in southwestern Louisiana. The AIRS instrument aboard NASA’s Aqua satellite captured this image on Aug. 30 at 4:17 a.m. EDT (0817 UTC). AIRS found cloud top temperatures as cold as minus 63 degrees Fahrenheit (minus 53 degrees Celsius). Storms with cloud top temperatures that cold have the capability to produce heavy rainfall.
The strongest storms were around Harvey’s center of circulation and in a band of thunderstorms east of the center over southern Mississippi, Alabama and the western-most part of the Florida Panhandle.
The German Aerospace Center (DLR) is assisting the U.S. Geological Survey with before and after flood data from the German radar satellite TerraSAR-X. DLR is supporting hurricane disaster management in Texas. The image was color-coded to show the flooded areas and the waterways.
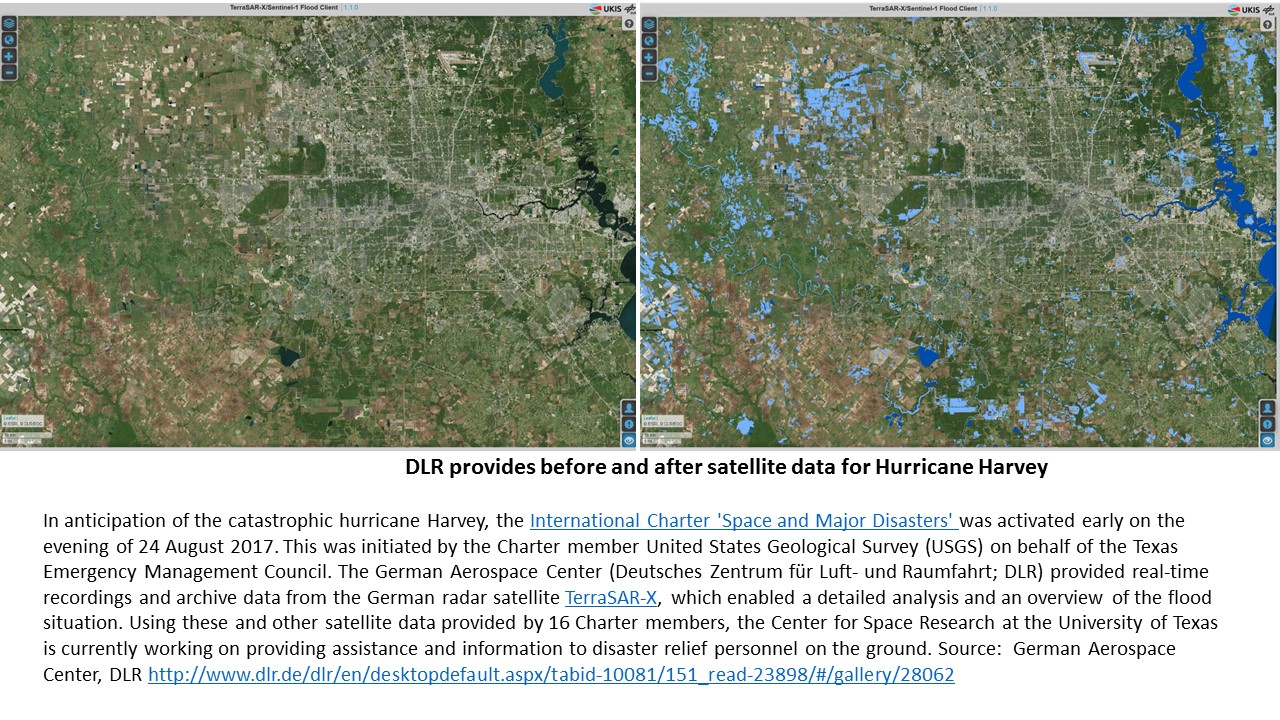
According to DLR, “In anticipation of the catastrophic hurricane Harvey, the International Charter ‘Space and Major Disasters’ was activated early on the evening of 24 August 2017. This was initiated by the Charter member United States Geological Survey (USGS) on behalf of the Texas Emergency Management Council.
The German Aerospace Center (Deutsches Zentrum für Luft- und Raumfahrt; DLR) provided real-time recordings and archive data from the German radar satellite TerraSAR-X, which enabled a detailed analysis and an overview of the flood situation. Using these and other satellite data provided by 16 Charter members, the Center for Space Research at the University of Texas is currently working on providing assistance and information to disaster relief personnel on the ground.
Warnings and Watches at 1 p.m. CDT on Aug. 30
A Storm Surge Warning is in effect for Holly Beach, Louisiana to Morgan City, Louisiana. A Storm Surge Watch is in effect for Sabine Pass, Texas to west of Holly Beach, Louisiana. A Tropical Storm Warning is in effect for Sabine Pass, Texas to Grand Isle, Louisiana. Catastrophic and life-threatening flooding continues in southeastern Texas and portions of southwestern Louisiana.
Harvey’s Location at 1 p.m. CDT on Aug. 30
At 1 p.m. CDT (1800 UTC), the center of Tropical Storm Harvey was located near latitude 30.6 North, longitude 93.3 West. The National Hurricane Center (NHC) said “Harvey is moving erratically toward the north-northeast near 8 mph (13 kph) and this general motion is expected to continue through Thursday. A turn toward the northeast is expected Thursday night and Friday. On the forecast track, the center of Harvey should move through southwestern and central Louisiana today and tonight, then move through northeastern Louisiana and northwestern Mississippi Thursday and Thursday night.
Maximum sustained winds have decreased to near 40 mph (65 kph) with higher gusts, mainly over water to the south and southeast of the center. Additional weakening is forecast during the next 48 hours as Harvey moves farther inland, and the cyclone is expected to weaken to a tropical depression tonight.”
For updated forecasts, visit: www.nhc.noaa.gov.
Rob Gutro
NASA’s Goddard Space Flight Center
Aug. 30, 2017 – (Update #1) – NASA Shows How Harvey Saturated Areas in Texas
NASA analyzed the soil moisture in southeastern Texas before and after Harvey made landfall and found the ground was already somewhat saturated. NASA-NOAA’s Suomi NPP Satellite provided a night-time look at Harvey after it moved into the Gulf of Mexico, and NOAA’s GOES East satellite provided a look at the storm after it made its final landfall near the Texas-Louisiana border on Aug. 30.
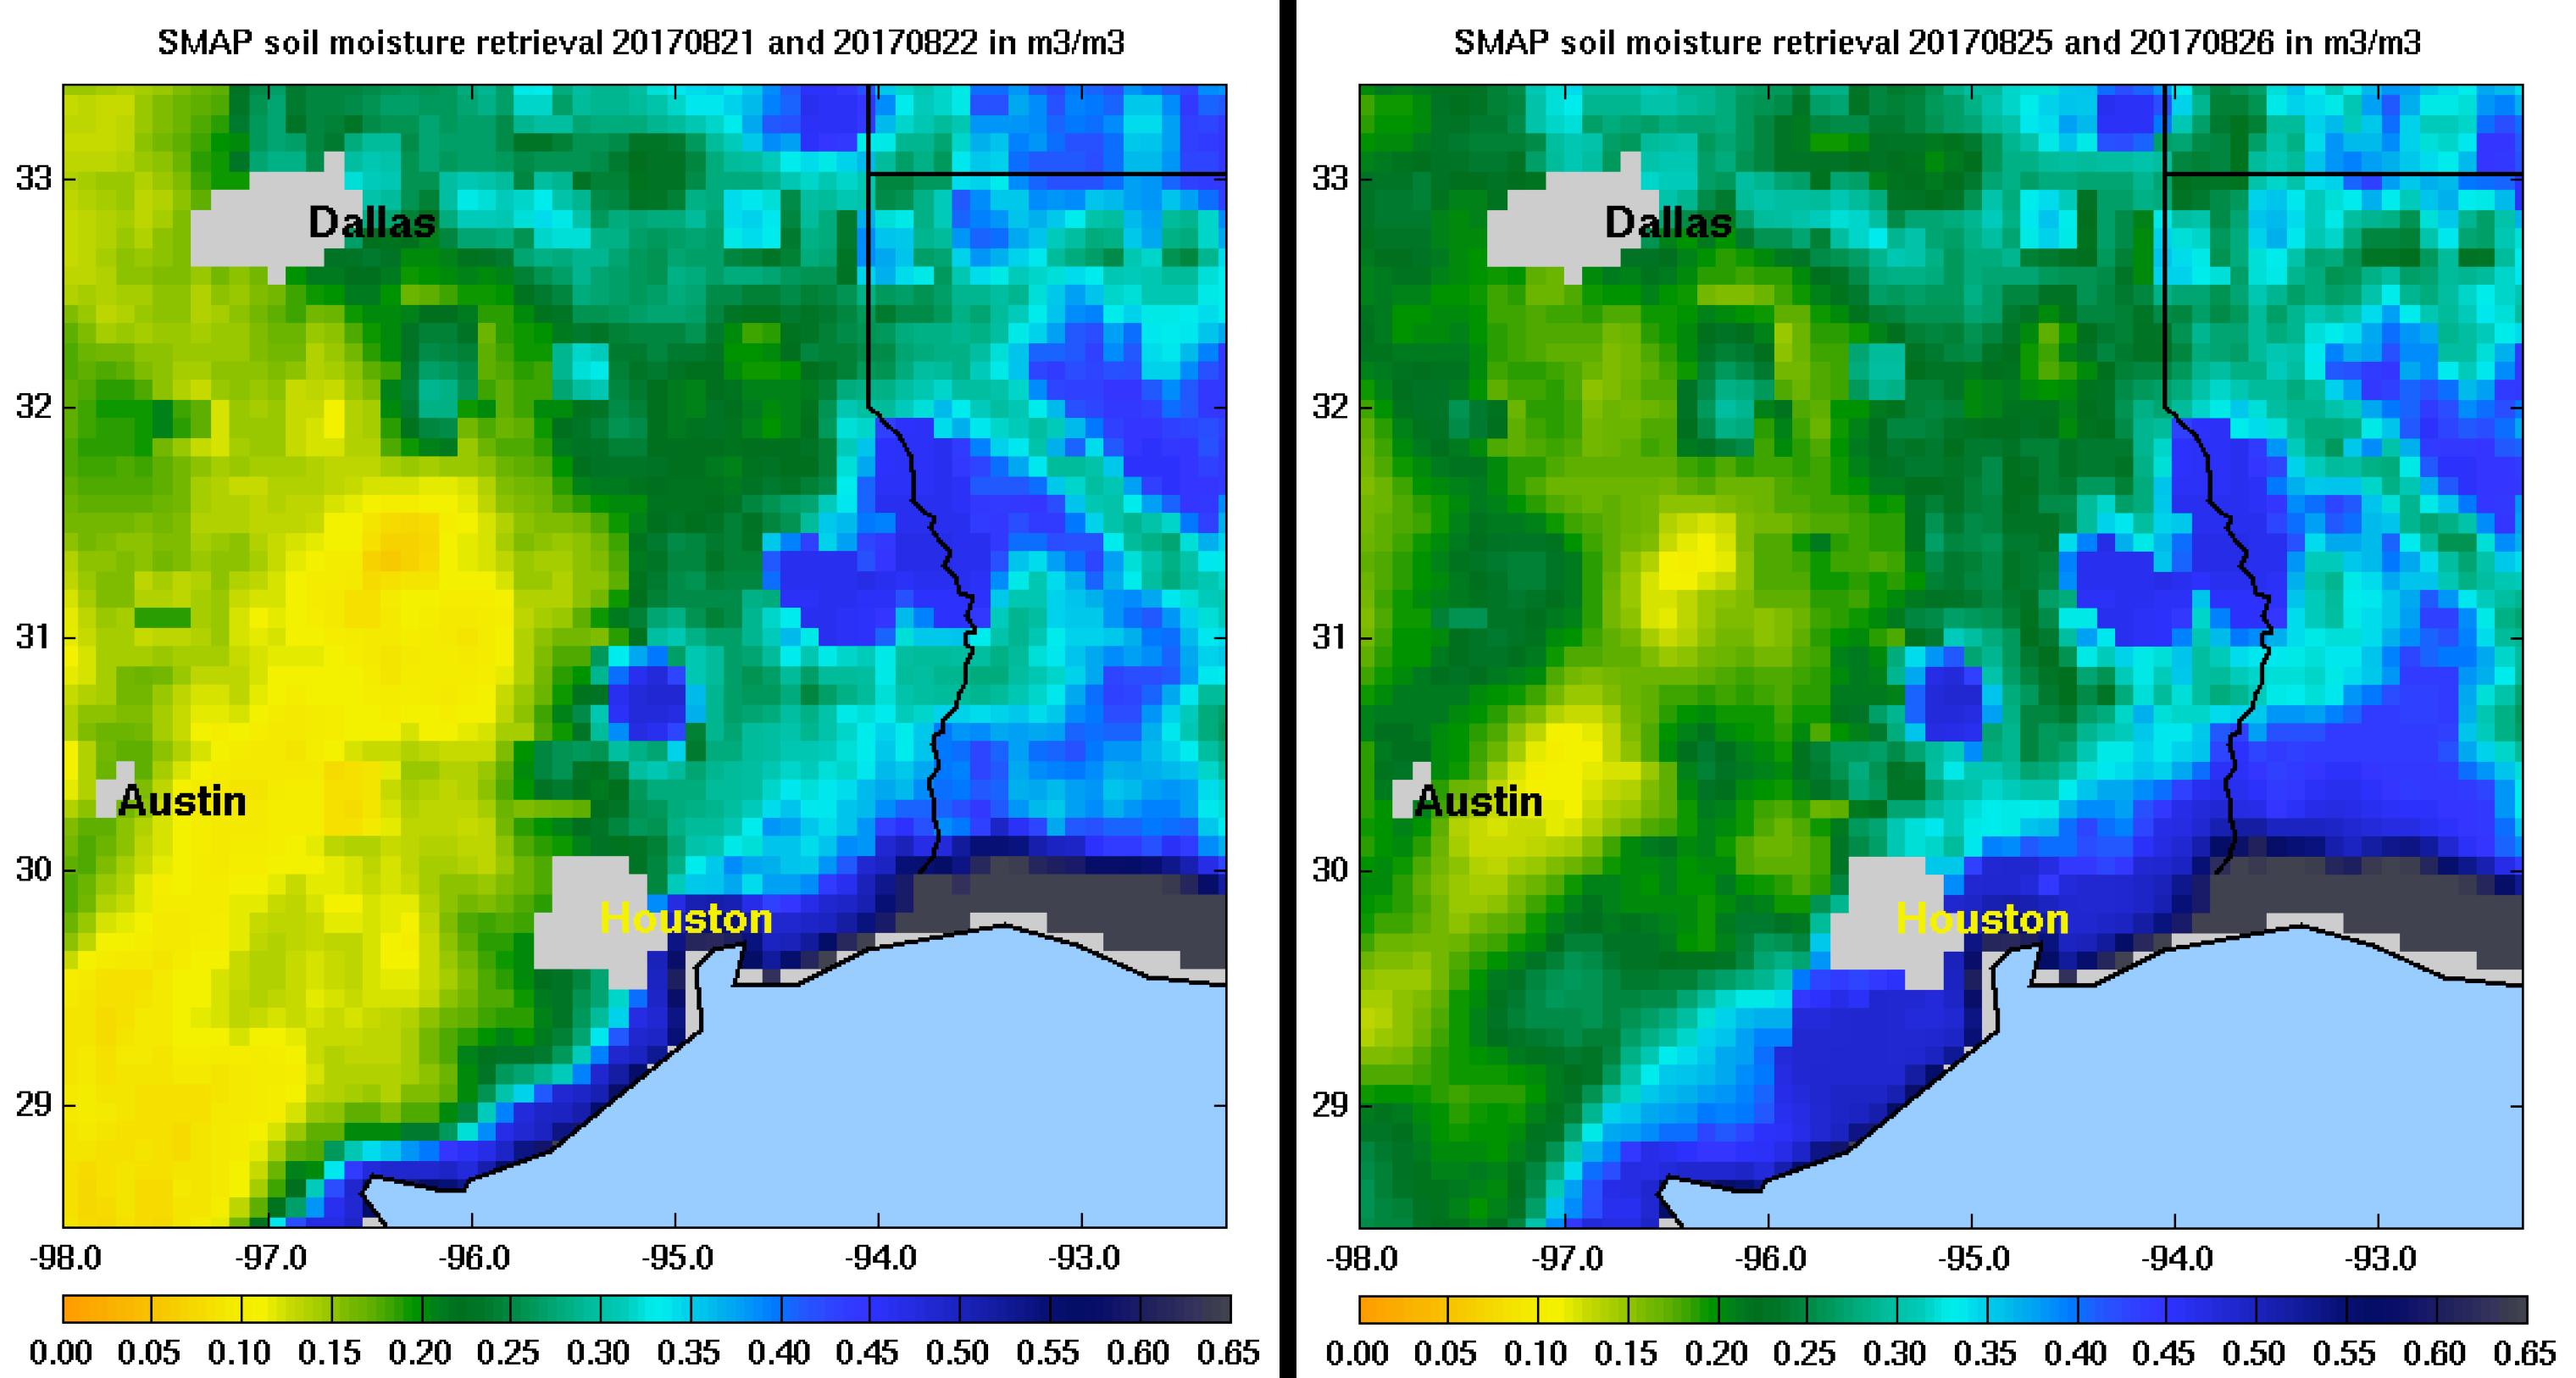
NASA Looks at Soil Moisture
At NASA’s Jet Propulsion Laboratory in Pasadena, Calif. images of soil moisture conditions in Texas near Houston, were generated using data from NASA’s Soil Moisture Active Passive (SMAP) satellite. The images captured conditions before and after the landfall of Hurricane Harvey. The images can be used to monitor changing ground conditions due to Harvey’s rainfall.
SMAP observations from Aug. 21 and 22 showed that soil surface conditions were already very wet a few days before the hurricane made landfall, with moisture levels in the 20 to 40 percent range. Such saturated soil surfaces contributed to the inability of water to infiltrate more deeply into soils, thereby increasing the likelihood of flooding. After Harvey made landfall, the southwest portion of Houston became exceptionally wet. SMAP captured data on Aug. 25 and 26 that signaled the arrival of heavy rains and widespread flooding.
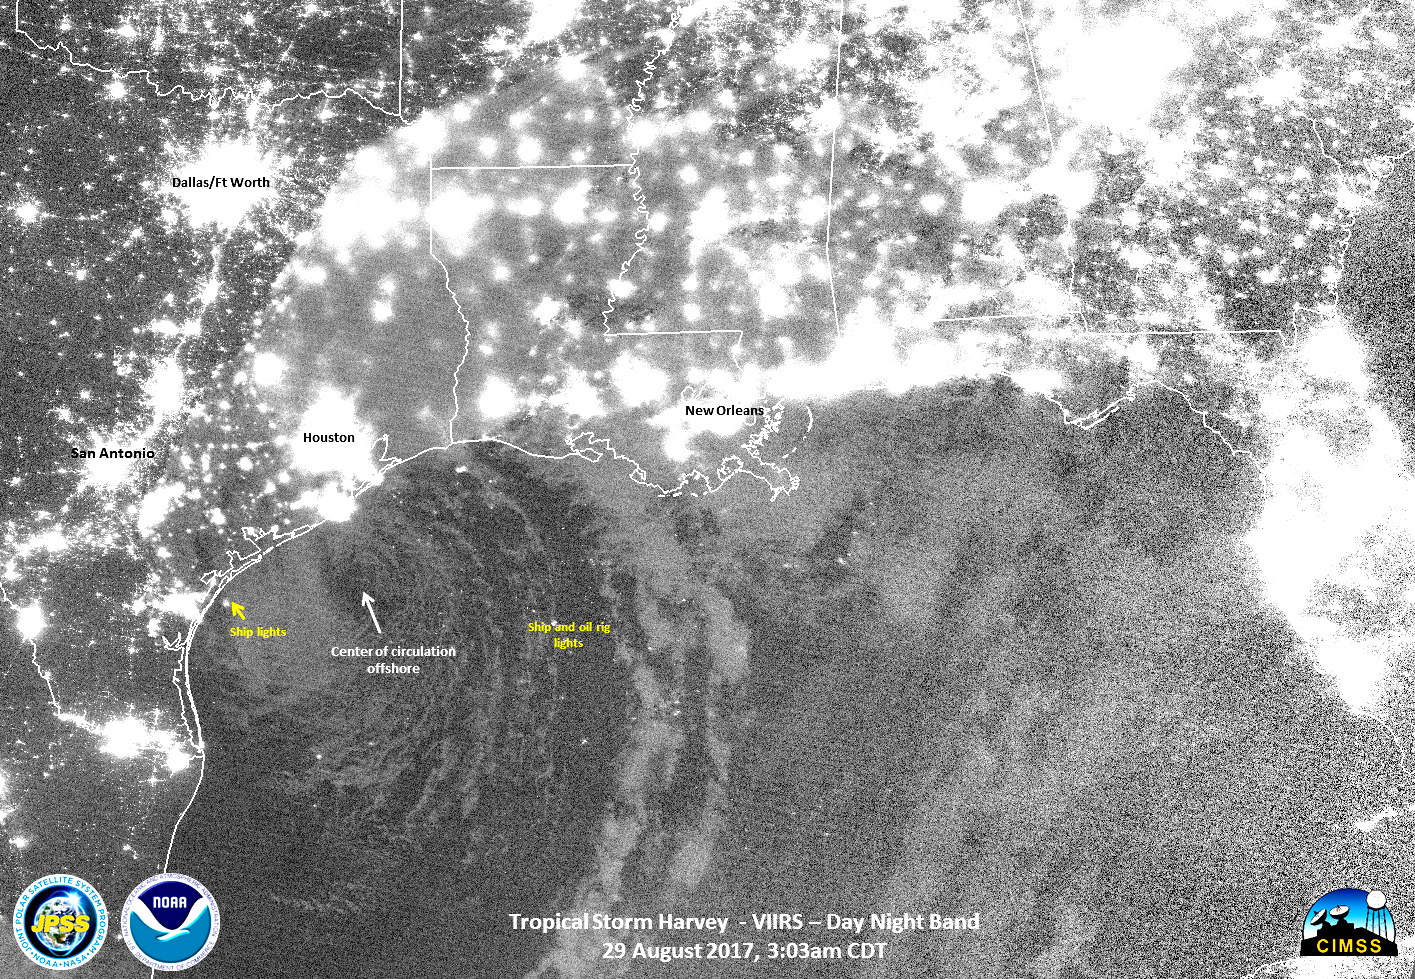
A Night-time View
On Aug. 29 at 3:03 a.m. CDT the Visible Infrared Imaging Radiometer Suite (VIIRS) instrument aboard NASA-NOAA’s Suomi NPP satellite captured a night-time image of Harvey that showed the center of circulation had moved back into the Gulf of Mexico.
Harvey Makes Another Landfall
NOAA’s GOES-East satellite provided a visible-light image of Tropical Storm Harvey on Wednesday, August 30, 2017 at 7:30 a.m. EDT (1230 UTC), hours after it made landfall at 4 a.m. CDT just west of Cameron, Louisiana. At the time of the image, the bulk of showers and thunderstorms around Harvey seemed to stretch from the northern to southwestern quadrants of the storm.
NHC noted “Although the rain has ended in the Houston/Galveston area, the Beaumont/Port Arthur area was particularly hard hit overnight, with about 12.5 inches reported at the Jack Brooks Regional Airport since 7 p.m. CDT on Aug. 29.”
The NASA/NOAA GOES Project at NASA’s Goddard Space Flight Center in Greenbelt, Maryland created an image. NOAA manages the GOES series of satellites and the NASA/NOAA GOES Project creates images and animations from the data.
Warnings and Watches in Effect on Aug. 30 at 7 a.m. CDT
The National Hurricane Center (NHC) said a Storm Surge Warning is in effect for Holly Beach, Louisiana to Morgan City, Louisiana. A Storm Surge Watch is in effect from east of High Island, Texas to west of Holly Beach, Louisiana. A Tropical Storm Warning is in effect from east of High Island, Texas to Grand Isle, Louisiana. Catastrophic and life-threatening flooding continues in southeastern Texas and portions of southwestern Louisiana.
Harvey’s Location on Aug. 30 at 7 a.m. CDT
At 7 a.m. CDT (1200 UTC), the center of Tropical Storm Harvey was located over southwestern Louisiana near 30.2 degrees north latitude and 93.6 degrees west longitude.
Harvey has been moving toward the north at about 9 mph (14 kph) for the past several hours. The storm is expected to move north-northeastward later this morning, and then a northeastward motion at a faster forward speed is expected through Thursday night. On the forecast track, the center of Harvey will move across the Lower Mississippi Valley and Tennessee Valley through Thursday.
Maximum sustained winds are near 45 mph (75 km/h) with higher gusts. Tropical-storm-force winds extend outward up to 80 miles (130 km) from the center. Gradual weakening is forecast as the center moves farther inland, and Harvey is expected to become a tropical depression by tonight. The estimated minimum central pressure based on surface observations is 992 millibars.
More Heavy Rainfall Expected
NHC said Harvey is expected to produce additional rainfall accumulations of 3 to 6 inches from southwestern Louisiana and the adjacent border of eastern Texas northeastward into western Kentucky through Friday with isolated amounts up to 10 inches. The expected heavy rains spreading northeastward from Louisiana into western Kentucky may also lead to flash flooding and increased river and small stream flooding.
Elsewhere, the outer bands of Harvey are expected to produce additional rainfall amounts of 3 to 6 inches over portions of the central and eastern Gulf States and 2 to 4 inches farther north into parts of the Tennessee Valley through Friday, Sept. 1. These rains may lead to flooding concerns across these areas.
NHC noted “While the threat of heavy rains has ended in the Houston/Galveston area, catastrophic and life-threatening flooding will continue in and around Houston eastward into southwest Louisiana for the rest of the week.”
A list of rainfall observations compiled by the NOAA Weather Prediction Center can be found at: www.wpc.ncep.noaa.gov/discussions/nfdscc1.html
For forecast updates on Harvey, visit: www.nhc.noaa.gov
Rob Gutro / Karen Boggs
NASA’s Goddard Space Flight Center, Greenbelt, Md.
NASA’s Jet Propulsion Laboratory, Pasadena, Calif.
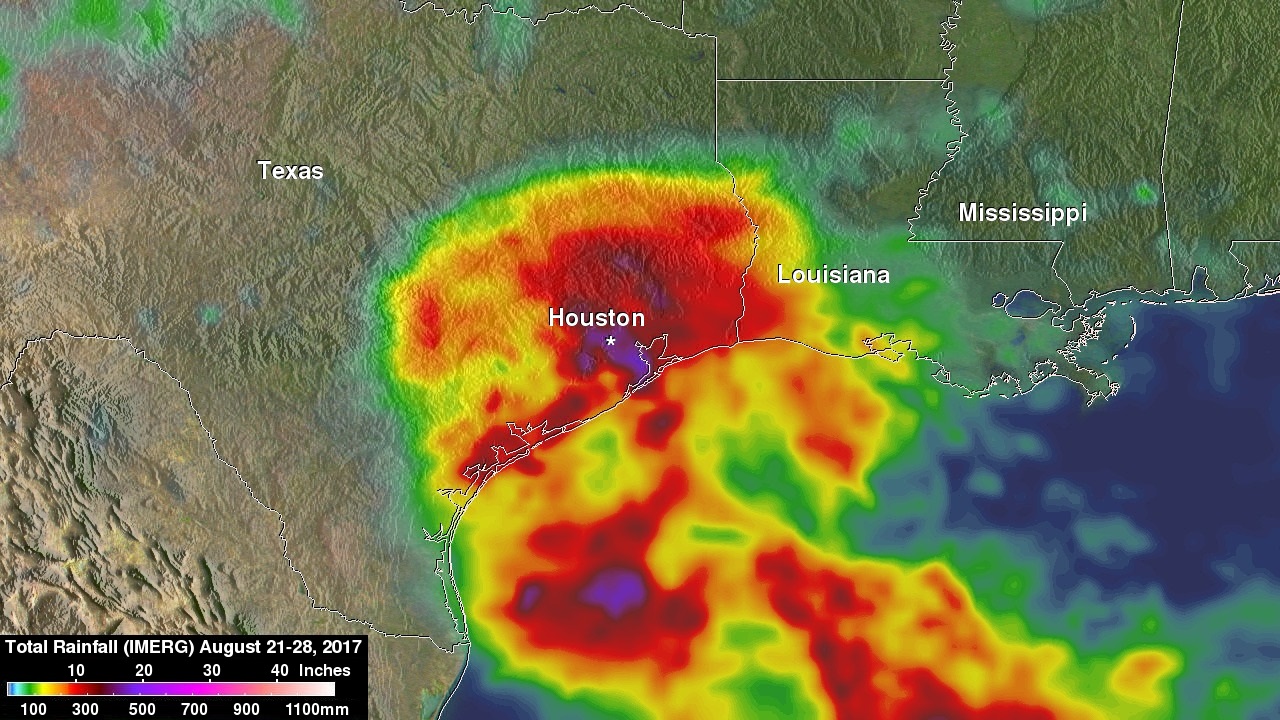
Aug. 29, 2017 – (Update #4) NASA’s IMERG Shows Rainfall Accumulation Along Harvey’s Track
As Harvey continues to dump catastrophic rains over southeastern Texas and southwestern Louisiana, NASA has been tallying rainfall accumulations in the storm’s wake.
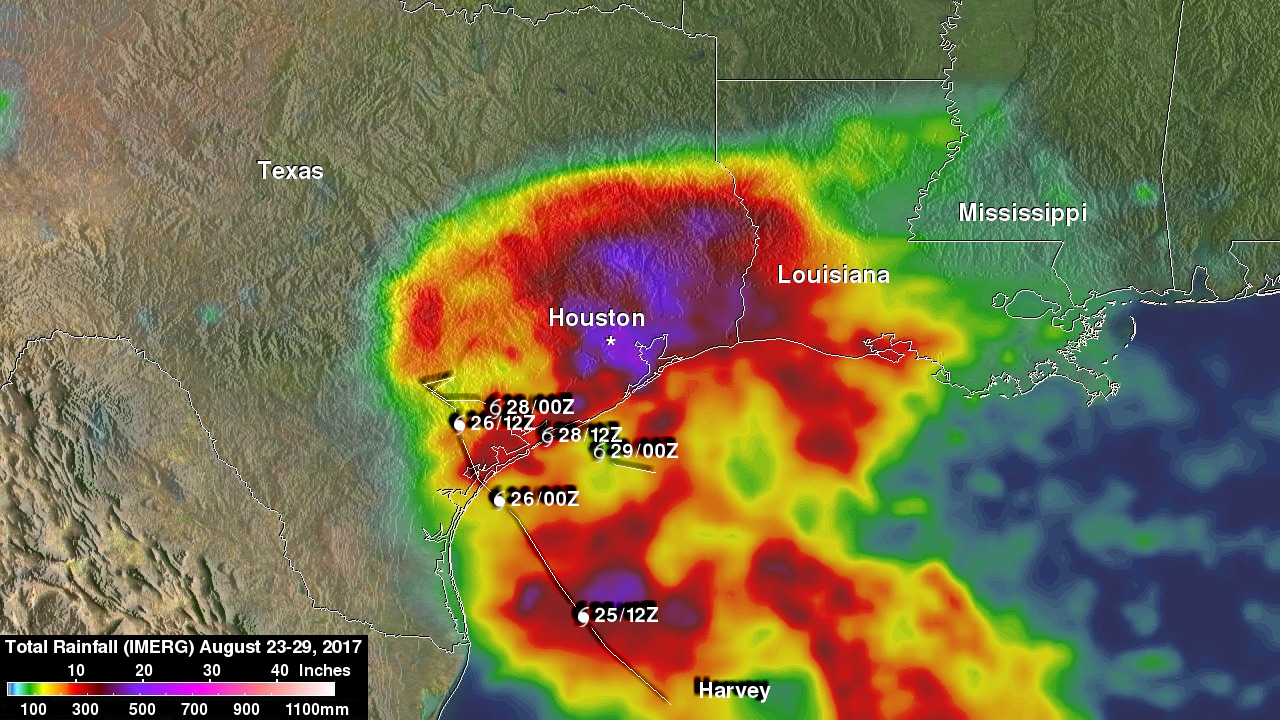
Total rainfall estimates from NASA’s Integrated Multi-satellitE Retrievals for GPM (IMERG) data were compiled for the period from August 23 to 29, 2017. During this period Harvey dropped heavy rainfall as it moved through the Gulf of Mexico and stalled over Texas. The IMERG totals showed over 30 inches of rainfall had occurred in the Houston metro area and part of the western Gulf of Mexico.
It has been reported that Harvey dropped over 40 inches (1016 mm) of rain over southeastern Texas during this period. IMERG Data are produced at NASA’s Goddard Space Flight Center in Greenbelt, Maryland, using data from the satellites in the Global Precipitation Measurement mission or GPM Constellation, and is calibrated with measurements from the GPM Core Observatory as well as rain gauge networks around the world.
The National Weather Service reported at 1 p.m. CDT on Aug. 29 “A preliminary report from one Texas rain gauge has broken the Texas tropical cyclone rainfall record. Southeast of Houston, Mary’s Creek at Winding Road reported 49.32 inches as of 9 a.m. CDT. This total is higher than the previous record of 48 inches set during tropical cyclone Amelia of 1978 at Medina, Texas.”
The National Hurricane Center (NHC) indicates that Harvey continues to drop heavy rain over southeastern Texas and southern Louisiana as it moves toward the north-northeast.
Warnings and Watches in Effect as of 1 p.m. CDT, Aug. 29
The NHC said a Tropical Storm Warning is in effect from nNorth of Port O’Connor, Texas to Morgan City, Louisiana. A Tropical Storm Watch is in effect from east of Morgan City to Grand Isle, Louisiana. A Storm Surge Watch is in effect from Port Bolivar, Texas to Morgan City.
Credits: NASA JAXA, Hal Pierce
More Heavy Rainfall Expected
NHC forecasters noted that catastrophic and life-threatening flooding continues in southeastern Texas and portions of southwestern Louisiana. Harvey is expected to produce additional rainfall accumulations of 6 to 12 inches through Friday over parts of the upper Texas coast into southwestern Louisiana.
Isolated storm totals may reach 50 inches over the upper Texas coast, including the Houston/Galveston metropolitan area. These rains are currently producing catastrophic and life-threatening flooding over large portions of southeastern Texas and southwestern Louisiana.
Elsewhere, Harvey is expected to produce additional rainfall amounts of 5 to 10 inches across portions of southern Louisiana into coastal Mississippi and Alabama. Rainfall associated with Harvey will spread north by mid to late week, with rainfall amounts of 4 to 8 inches spreading into portions of Arkansas and the Tennessee Valley.
A list of rainfall observations compiled by the NOAA Weather Prediction Center can be found at: www.wpc.ncep.noaa.gov/discussions/nfdscc1.html
Winds, Storm Surge, Ocean Swells
Tropical storm conditions are occurring over portions of the warning area along the coast and are likely to persist during the next day or so.
The combination of a dangerous storm surge and the tide will cause normally dry areas near the coast to be flooded by rising waters moving inland from the shoreline. The water is expected to reach the following heights above ground if the peak surge occurs at the time of high tide…
San Luis Pass to Morgan City including Galveston Bay…1 to 3 ft
The deepest water will occur along the immediate coast near the area of onshore winds. Surge-related flooding depends on the relative timing of the surge and the tidal cycle, and can vary greatly over short distances.
Swells generated by Harvey are still affecting the coasts of Texas and Louisiana. These swells are likely to cause life-threatening surf and rip current conditions.
Harvey’s Location at 1 p.m. CDT, Aug. 29
At 1 p.m. CDT (1800 UTC), the center of Tropical Storm Harvey was located near 28.8 degrees north latitude and 94.3 degrees west longitude. That’s about 80 miles (130 km) south-southwest of Port Arthur, Texas and about 95 miles (155 km) southwest of Cameron, Louisiana. Harvey was moving a little faster toward the north-northeast near 8 mph (13 kph), and this general motion is expected to continue today and tomorrow, Aug. 30. On the forecast track, the center of Harvey is expected to move inland over the northwestern Gulf within the tropical storm warning area later tonight or early Wednesday.
Maximum sustained winds remain near 45 mph (75 kph) with higher gusts. NHC said no significant change in strength is expected before the center moves inland. A gradual weakening should begin thereafter. The estimated minimum central pressure is 997 millibars.
For updated forecasts and warnings, visit: http://www.nhc.noaa.gov.
For local warnings and watches, visit: www.weather.gov.
Rob Gutro / Hal Pierce
NASA’s Goddard Space Flight Center
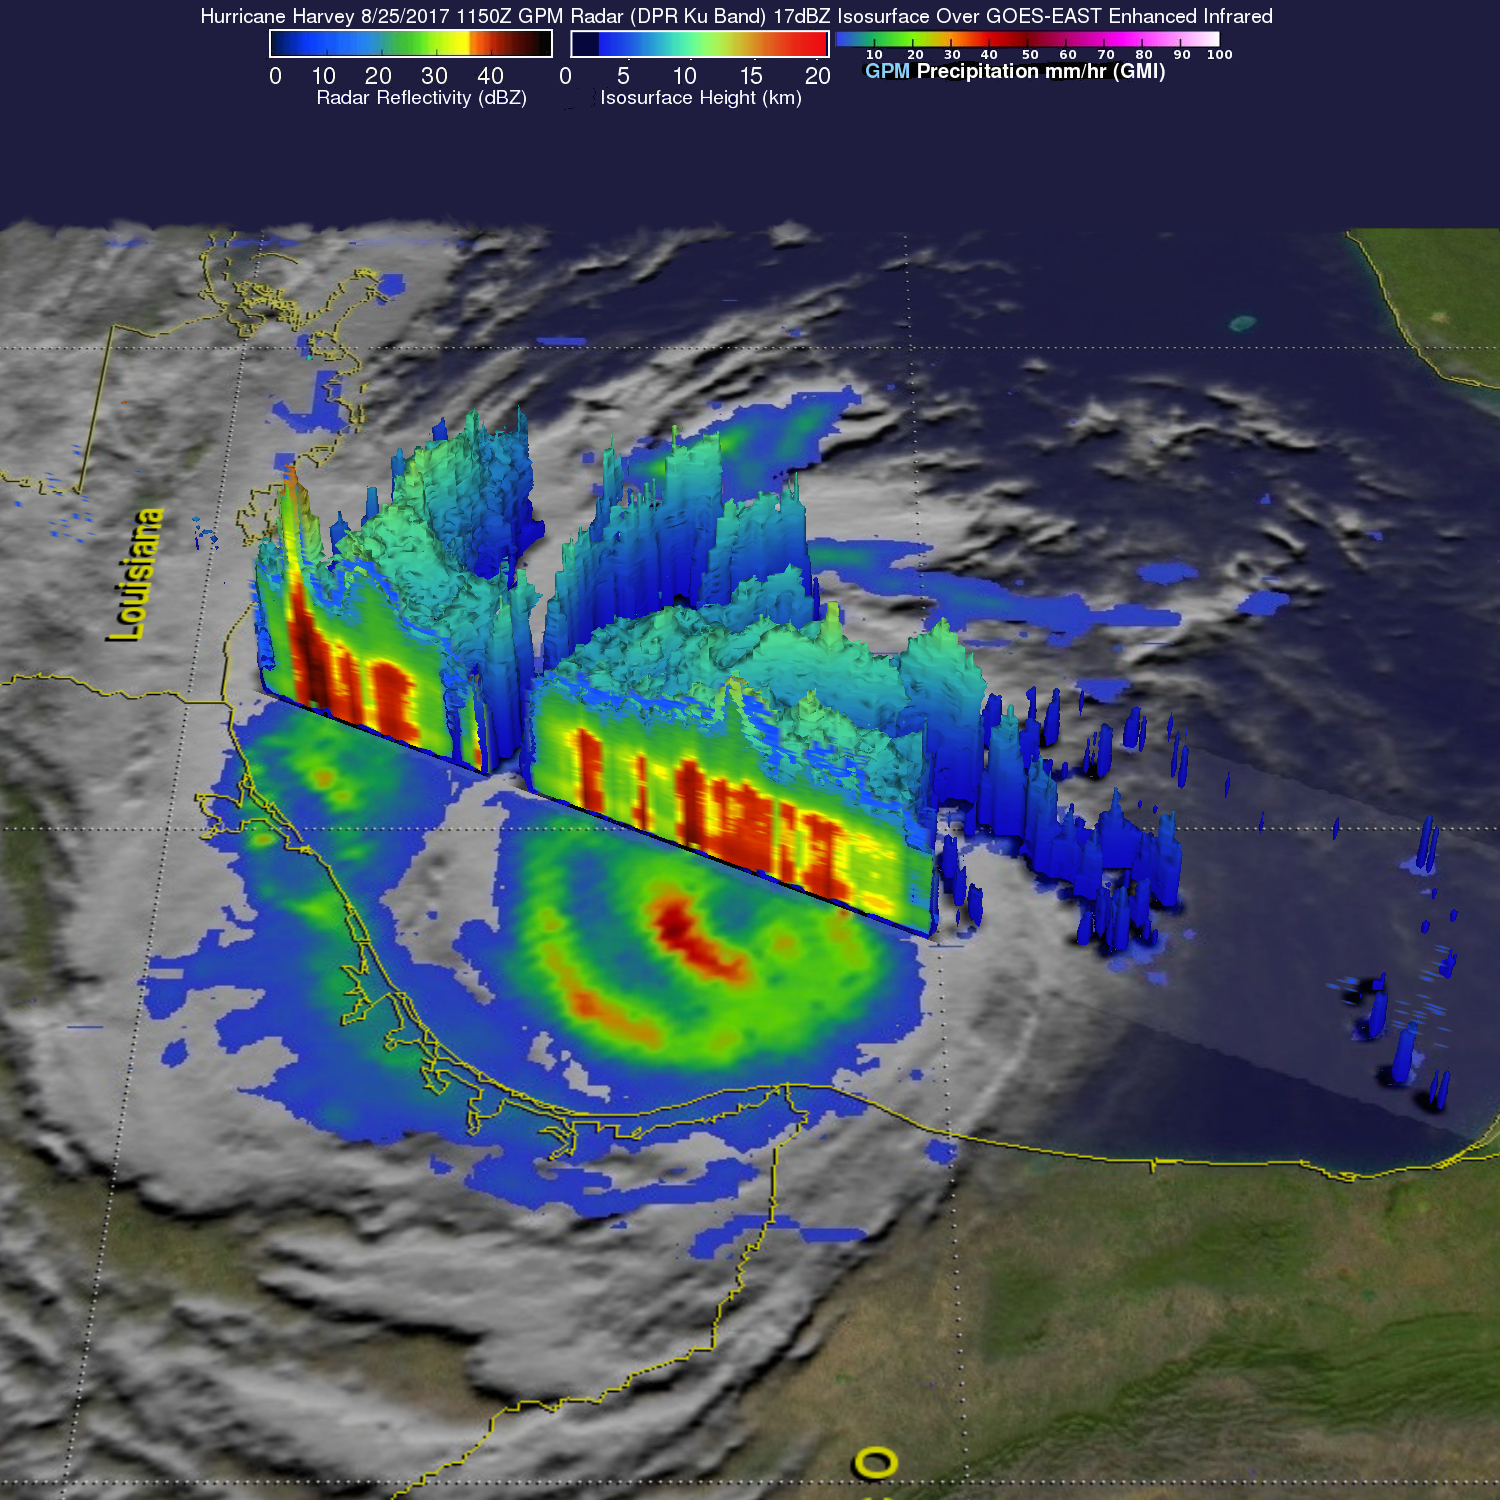
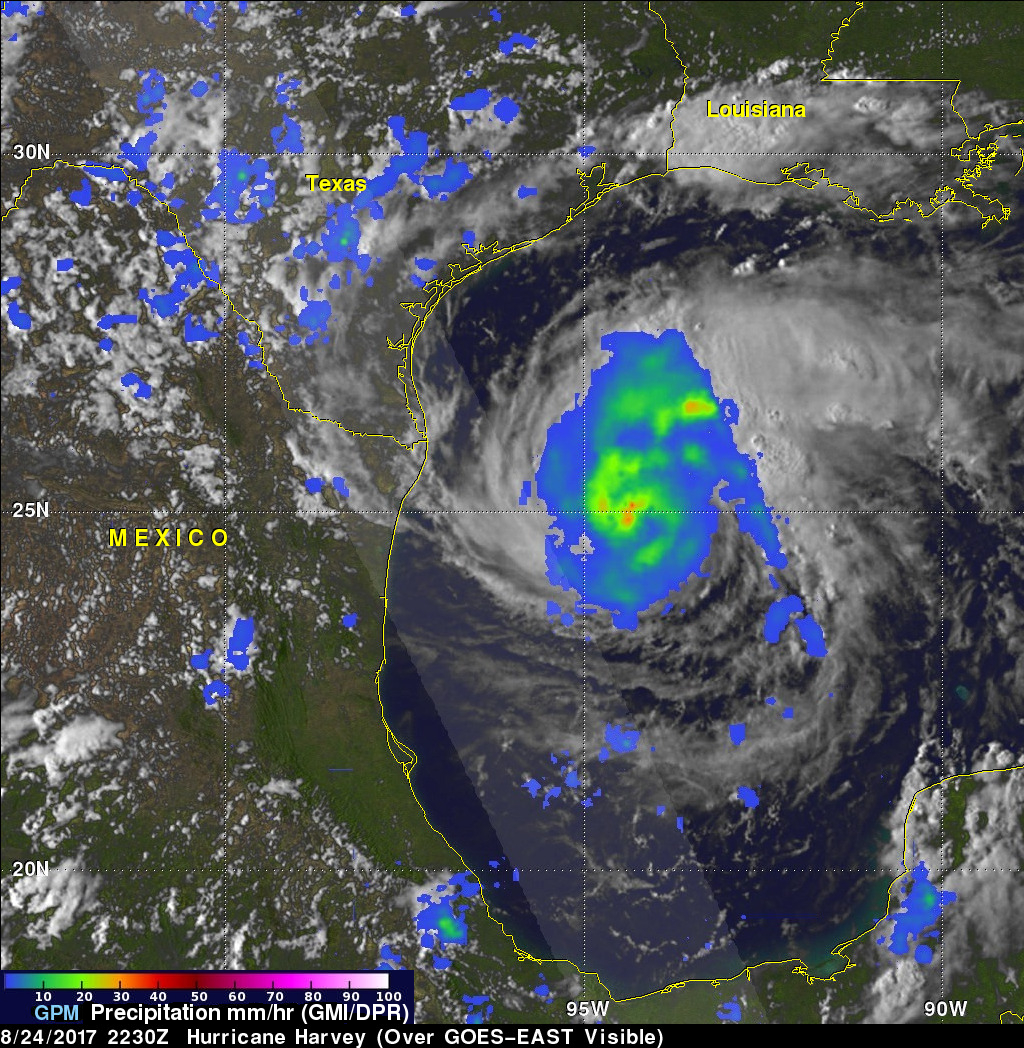
Aug. 29, 2017 – (Update #3) Harvey’s Rainfall and Structure Seen by GPM
The Global Precipitation Mission (GPM) Core Observatory captured these images of Hurricane Harvey at 7:45 a.m. EDT (11:45 UTC) and 5:25 p.m. EDT (21:25 UTC) on the August 27, 2017 nearly two days after the storm made landfall as it was meandering slowly southeast at just 2 mph (~4 kph) near Victoria, Texas west of Houston.
The animation shows rain rates derived from GPM’s GMI microwave imager (outer swath) and dual-frequency precipitation radar or DPR (inner swath) overlaid on enhanced infrared data from the GOES-East satellite.
Harvey’s cyclonic circulation is still quite evident in the infrared clouds, but GPM shows that the rainfall pattern is highly asymmetric with the bulk of the rain located north or east of the center. A broad area of moderate rain can be seen stretching from near Galveston Bay to north of Houston and back well to the west. Within this are embedded areas of heavy rain (red areas); the peak estimated rain rate from GPM during these overpasses was 96 mm/hr (~3.77 inches per hour). The animation was created at the NASA’s Scientific Visualization Studio, at NASA’s Goddard Space Flight Center, Greenbelt, Md.
With Harvey’s circulation still reaching out over the Gulf of Mexico the storm is able to draw in a continuous supply of warm moist air to sustain the large amount of rain it is producing.
For downloadable video, visit: https://svs.gsfc.nasa.gov/4458
Credit: NASA’s Scientific Visualization Studio. GPM data provided by the joint NASA/JAXA GPM mission. Data provided by the joint NASA/JAXA GPM mission.
Aug. 29, 2017 – (Update #2) NASA Watching Harvey from Satellites and the International Space Station
NASA has a lot of resources providing information on Tropical Storm Harvey as it continues to drop tremendous, flooding rainfall on Texas and Louisiana. Satellites like NASA’s Aqua satellite and platforms like aircraft and the International Space Station continue to provide various kinds of data on the storm.
“NASA focuses on developing new research capabilities that can be used by our partners in the operational and response communities,” said Dalia Kirschbaum, Research Physical Scientist at NASA’s Goddard Space Flight Center in Greenbelt, Maryland. “While we continue to innovate in the type of information from satellites, models, and airborne platforms, the main focus is to ensure that the partners that are responding operationally to this event have the information in the format that they need to make effective decisions on emergency response. We continually and actively engage to ensure that the data pipeline is as effective and useful as possible.”
NASA Resources in Action
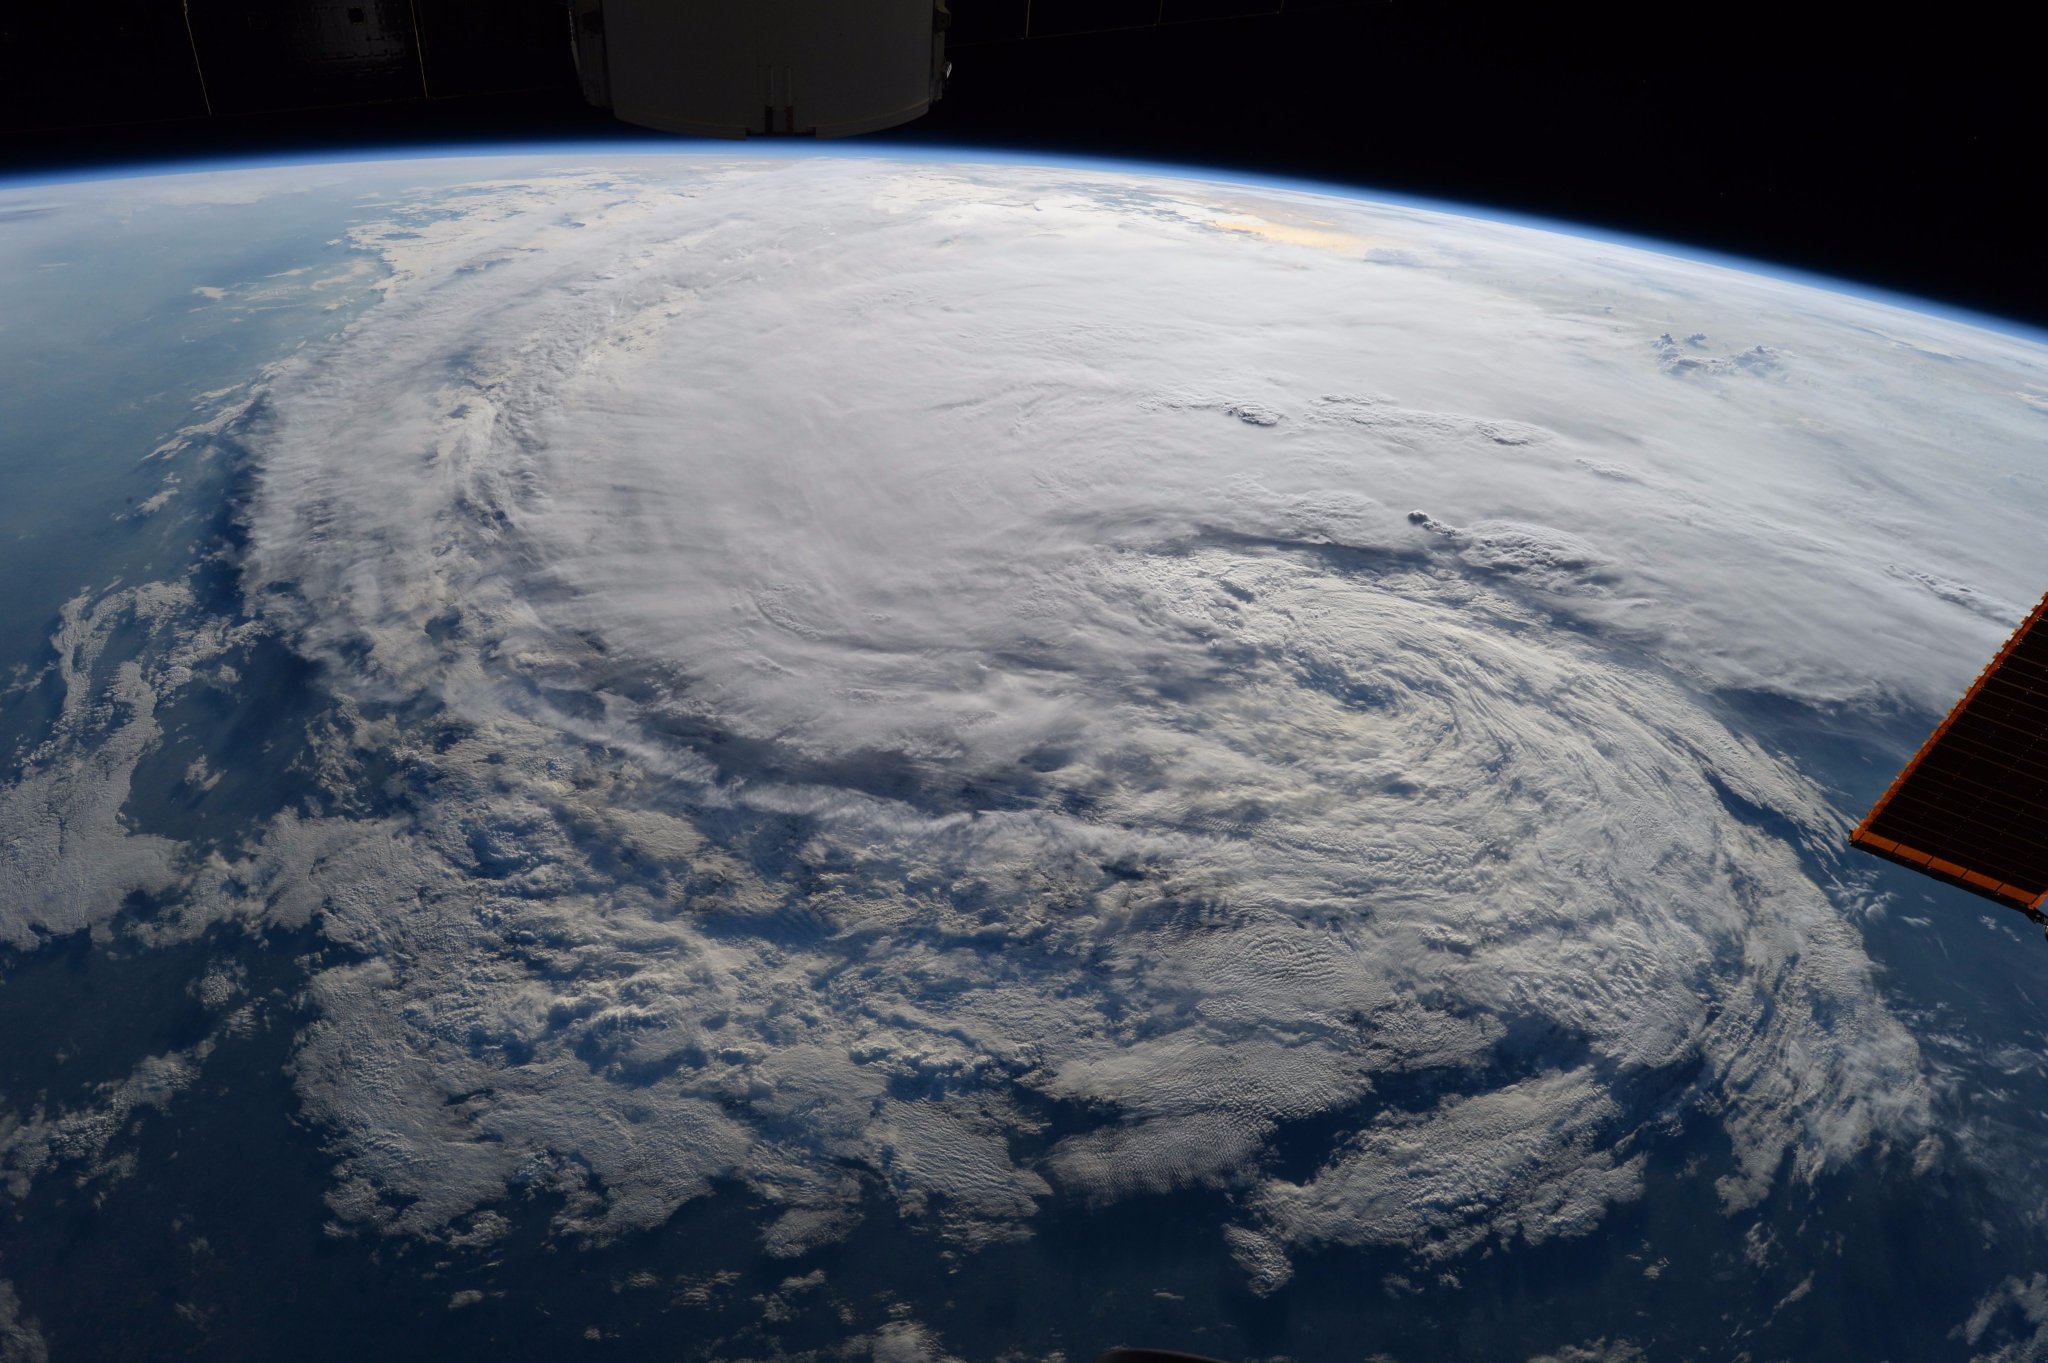
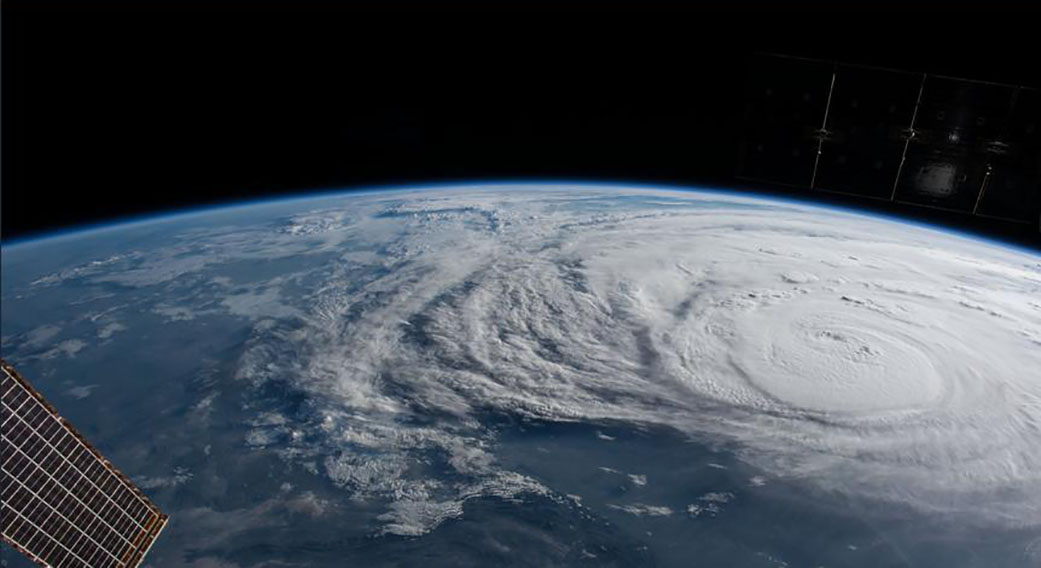
The International Space Station has provided a view of Harvey from its orbit in space. On Aug. 28 at 1:27 p.m. CDT Astronaut Randy Bresnik took a photo of Tropical Storm Harvey
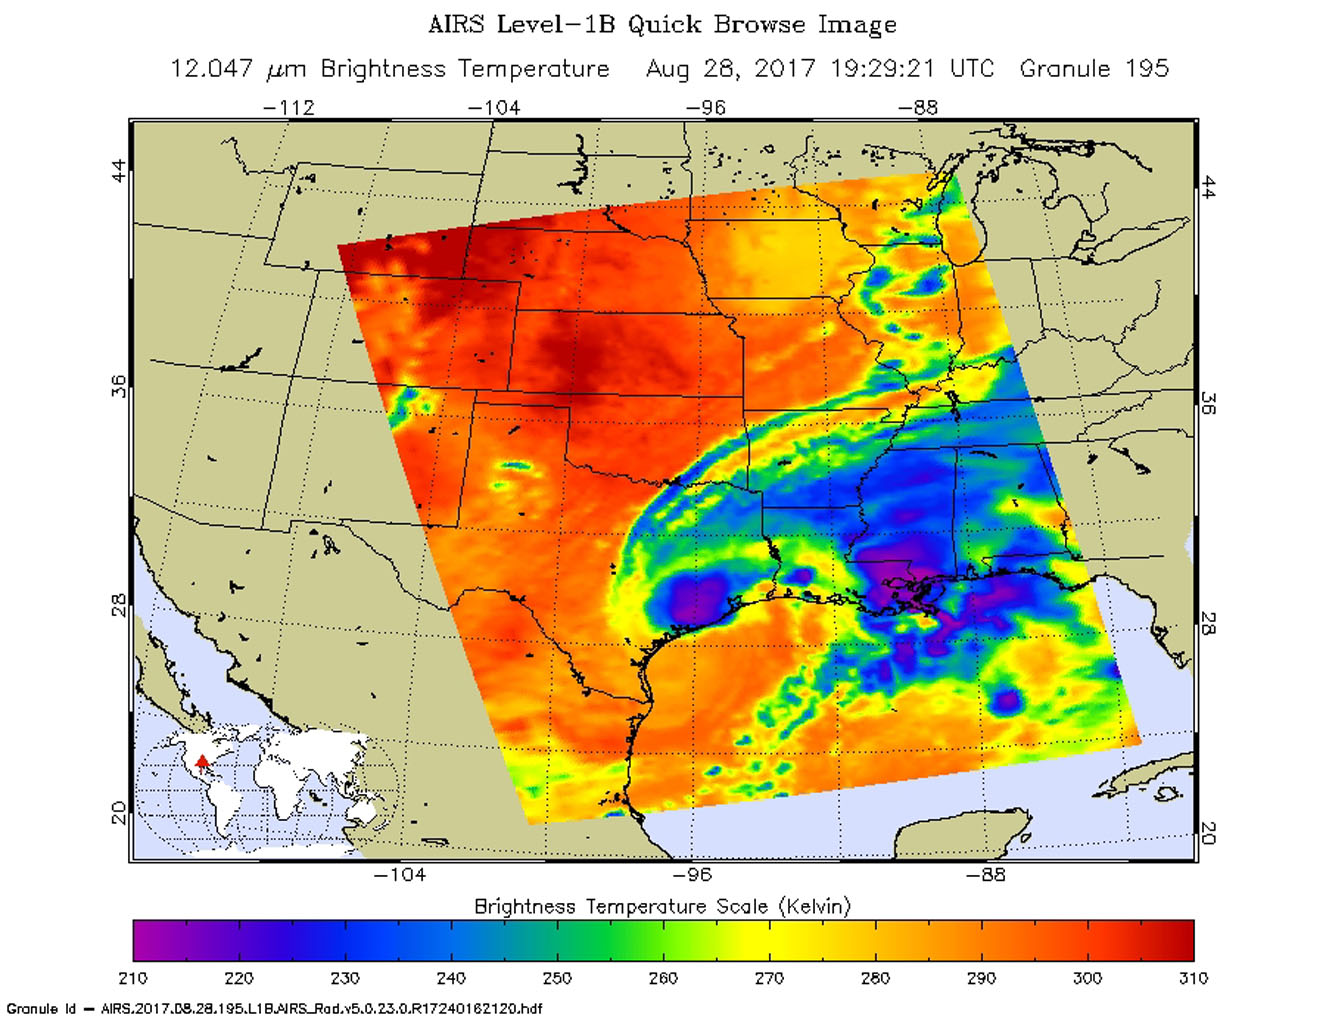
An infrared image taken at 2:29 p.m. CDT (19:29 UTC) on Aug. 28, 2017 from NASA’s Atmospheric Infrared Sounder (AIRS) instrument aboard NASA’s Aqua satellite illustrated the growing flood threat from Tropical Storm Harvey. The data showed a large area of coldest cloud top temperatures and strongest thunderstorms centered along the southeastern Texas coast. A second area of intense precipitation was visible over southeastern Louisiana.
Harvey has reemerged over the Gulf of Mexico, but the National Hurricane Center forecasts only a small amount of strengthening before the storm moves slowly north and inland again.
National Hurricane Center Warnings and Watches
On Aug. 29 at 7 a.m. CDT, the National Hurricane Center (NHC) warned “Catastrophic and life-threatening flooding continues and continued heavy rainfall today is expected to worsen the flood situation in southeastern Texas and southwestern Louisiana.” A Tropical Storm Warning is in effect from Mesquite Bay, Texas to Intracoastal City, Louisiana. A Storm Surge Watch is in effect from Port Bolivar, Texas to Morgan City, Louisiana.
There are also many flood warnings in effect throughout southeastern Texas and southwestern Louisiana. For specific forecasts, visit: www.weather.gov.
More Rainfall Expected Today, August 29, 2017
NHC forecasters said “Harvey is expected to produce additional rainfall accumulations of 7 to 13 inches through Friday over parts of the upper Texas coast into southwestern Louisiana. Isolated storm totals may reach 50 inches over the upper Texas coast, including the Houston/Galveston metropolitan area. Elsewhere, Harvey is expected to produce total rain accumulations of 5 to 15 inches farther east across south-central Louisiana. Rainfall amounts of 5 to 10 inches are expected in southeast Louisiana and coastal Mississippi and Alabama.”
Harvey’s Location at 7 a.m. CDT, August 29, 2017
At 7 a.m. CDT (1200 UTC), the center of Tropical Storm Harvey was estimated near 28.2 degrees north and 94.6 degrees west longitude. Harvey’s center of circulation was about 90 miles (145 km) east-southeast of Port O’Connor, Texas. Harvey is moving toward the east-northeast near 3 mph (6 kph), and this motion is expected to continue through this morning.
Maximum sustained winds remain near 45 mph (75 kph) with higher gusts. Little change in strength is forecast during the next 48 hours. Tropical-storm-force winds extend outward up to 175 miles (280 km) from the center. The estimated minimum central pressure is 997 millibars.
A turn toward the northeast is expected later today and tonight, followed by a turn toward the north-northeast on Wednesday, Aug. 30. On the forecast track, the center of Harvey is expected to be just offshore of the middle and upper coasts of Texas through tonight, then move inland over the northwestern Gulf coast on Wednesday, Aug. 30.
A list of rainfall observations compiled by the NOAA Weather Prediction Center can be found at: www.wpc.ncep.noaa.gov/discussions/nfdscc1.html
For updated forecasts on Harvey, visit: www.nhc.noaa.gov
Rob Gutro / Alan Buis
NASA’s Goddard Space Flight Center, Greenbelt, Md.
NASA Jet Propulsion Laboratory, Pasadena, Calif.
Aug. 29, 2017 – (Update #1) Hurricane Harvey’s Rapid Wind Intensification seen by NASA’s SMAP
One of the factors in tropical cyclone research that NASA studies is rapid intensification. The rapid intensification of Hurricane Harvey is seen in this pair of images of ocean surface wind speeds as observed by the radiometer instrument aboard NASA’s Soil Moisture Active Passive (SMAP) satellite at 7:29 a.m. CDT Aug. 24, 2017 (left) and at 7 p.m. CDT Aug. 26 (right).
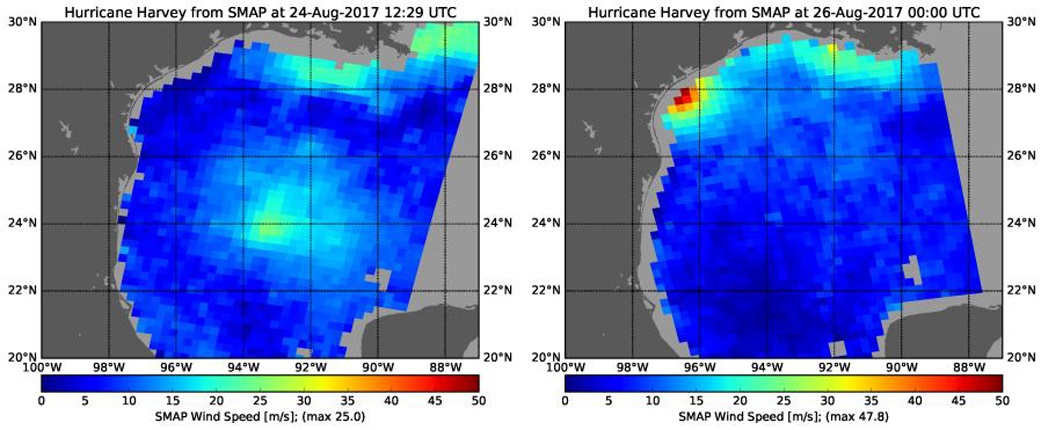
Color indicates wind speed, with red being highest and blue lowest. The images show Harvey’s maximum wind speeds increased from approximately 56 miles per hour (25 meters per second) to about 107 miles per hour (47.8 meters per second) in the 36 hours just before landfall. The higher wind speeds estimated near the mouth of the Mississippi River are erroneous and are due to errors in the ancillary sea-surface-salinity data product used by SMAP to estimate extreme wind speeds.
SMAP is managed for NASA’s Science Mission Directorate in Washington by NASA’s Jet Propulsion Laboratory in Pasadena, California, with participation by NASA’s Goddard Space Flight Center in Greenbelt, Maryland. JPL is responsible for project management, system engineering, instrument management, the radar instrument, mission operations and the ground data system. Goddard is responsible for the radiometer instrument. Both centers collaborate on the science data processing and delivery of science data products to the Alaska Satellite Facility and the National Snow and Ice Data Center for public distribution and archiving. JPL is managed for NASA by Caltech.
For more information about SMAP, visit http://smap.jpl.nasa.gov.
NASA’s Jet Propulsion Laboratory
Pasadena, Calif.
Aug. 28, 2017 – (Update #2) NASA Calculates Tropical Storm Harvey’s Flooding Rainfall
At NASA’s Goddard Space Flight Center in Greenbelt, Maryland, an analysis of Hurricane Harvey’s tremendous rainfall was created using eight days of satellite data.
NASA’s Integrated Multi-satellitE Retrievals for GPM or IMERG product is used to make estimates of precipitation from a combination of space-borne passive microwave sensors, including the GMI microwave sensor onboard the Global Precipitation Measurement satellite GPM core satellite, and geostationary IR (infrared) data.
IMERG rainfall estimates for the period 21 to 28 August 2017 showed the accumulated effects of all of the rain from Harvey to date. So far, IMERG shows rainfall totals have reached on the order of 20 inches from the coast near Galveston Bay to in and around the Houston area as a result of the near continuous stream of showers and rain being drawn over the coast in rainbands on the eastern side of Harvey’s counter clockwise cyclonic circulation. Elsewhere, at least 10 inches were calculated to have fallen from western Louisiana all the way to near Corpus Christi on the coast.
The result has been widespread, massive flooding across the region and brings back memories of Tropical Storm Allison, which dropped up to 40 inches of rain in Texas back in 2001 and caused devasting flooding in the Houston area.
More Rainfall Expected
The National Hurricane Center (NHC) noted at 1 p.m. CDT on Aug. 28, “Harvey is expected to produce additional rainfall accumulations of 15 to 25 inches through Friday over the upper Texas coast and into southwestern Louisiana. Isolated storm totals may reach 50 inches over the upper Texas coast, including the Houston/Galveston metropolitan area. These rains are currently producing catastrophic and life-threatening flooding over large portions of southeastern Texas.”
Warnings In Place at 1 p.m. CDT, Aug. 28
A Tropical Storm Warning remained in effect from Mesquite Bay to Cameron, Texas and a Tropical Storm Watch is in effect from east of Cameron to Intracoastal City, Louisiana.
The National Hurricane Center said “Catastrophic and life-threatening flooding continues in southeastern Texas. Please see warnings and other products issued by your local National Weather Service office for additional information on this life-threatening situation.”
Location of Harvey at 1 p.m. CDT, Aug. 28
At 1 p.m. CDT (1800 UTC), the center of Tropical Storm Harvey was located near 28.6 degrees north latitude and 95.8 degrees west longitude.
Harvey is currently drifting erratically toward the east-southeast, and a slow motion toward the southeast is expected later today through tonight. A gradual turn toward the northeast and a continued slow forward speed are expected Tuesday and Tuesday night. On the forecast track, the center of Harvey is expected to be just offshore of the middle and upper coasts of Texas through Tuesday night.
Maximum sustained winds are near 40 mph (65 kph) with higher gusts. Some slow intensification is possible during the next 48 hours. The minimum central pressure estimated from surface observations along the Texas coast is 998 millibars.
Harvey’s History
Harvey began on Aug. 17 as a weak tropical storm about 250 miles (~400 km) east of Barbados in the Leeward Islands. Over the next two days, Harvey continued moving steadily westward passing through the Leeward Islands as a still weak tropical storm and entered into the east central Caribbean. On Aug. 19, Harvey succumbed to the effects of northeasterly wind shear over the central Caribbean and lost its cyclonic circulation and weakened back into a tropical wave. The remnants of what was once Harvey then passed over the Yucatan Peninsula and into the Bay of Campeche.
Typically, it is hard for a system to reform after dissipating as well as after passing over land. However, the environmental conditions were favorable for development and the water temperatures in the Gulf of Mexico very warm. This allowed Harvey first to reform into a tropical depression on the morning of the Aug. 23 then strengthen back to a tropical storm later that evening. Having recovered its structure, Harvey was then able take further advantage of the low wind shear and warm waters and continue to intensify, becoming a hurricane by midday on Aug. 24 and then rapidly intensifying overnight into a Category 2 storm with maximum sustained winds reported at 110 mph (~175 kph) by the National Hurricane Center (NHC) at 15:00 UTC (10:00 am CDT) the next morning. Now moving northwest across the western Gulf and Mexico and headed straight for the central Texas coast, Harvey continued to get stronger during the day on Aug. 25 and reached its peak intensity as a Category 4 storm with sustained winds of 130 mph (215 kph) at 6:00 pm CDT according to NHC.
Harvey maintained this intensity until it made landfall later that evening at around 10:00 pm CDT as a Category 4 hurricane near Rockport, Texas, about 30 miles east-northeast of Corpus Christi. After making landfall, Harvey weakened and its winds decreased back down to tropical storm intensity by 1 p.m. CDT the next day on Aug. 26; however, as had been forecast, the steering currents collapsed, bringing the storm to a near standstill just inland from the Texas Gulf Coast and setting the stage for a catastrophic flooding event.
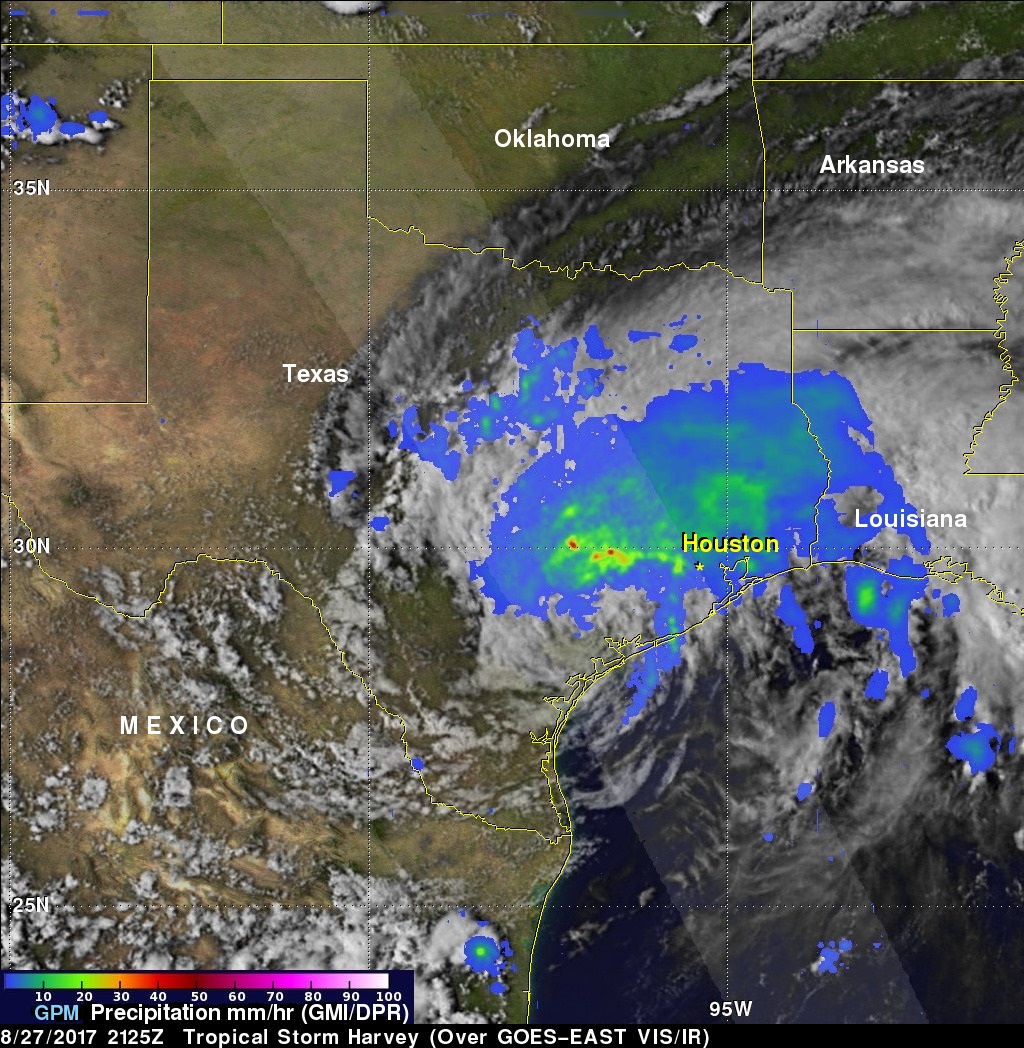
GPM Measured Harvey’s Rainfall Rates on Aug. 27
On Aug. 27, GPM captured rainfall data on Harvey at 21:25 UTC (4:25 p.m. CDT) as it was meandering slowly southeast at just 2 mph (~4 kph) near Victoria, Texas west of Houston. Data from GPM’s GMI microwave imagery and dual-frequency precipitation radar or DPR was overlaid on enhanced visible/infrared image from NOAA’s GOES East satellite.
The image, created at NASA Goddard showed Harvey’s cyclonic circulation was still quite evident in the visible/infrared clouds, but GPM showed that the rainfall pattern was highly asymmetric with the bulk of the rain located north and east of the center.
A broad area of moderate rain was evident from near Galveston Bay to north of Houston and back well to the west. Within that area were embedded areas of heavy rain. The peak estimated rain rate from GPM at the time of this overpass was 96 mm/hour (~3.77 inches per hour).
About IMERG
The Integrated Multi-satellitE Retrievals for GPM (IMERG) is a unified U.S. algorithm that provides a multi-satellite precipitation product. IMERG is run twice in near-real time with the “early” multi-satellite product being created at about 4 hours after observation time and a “late” multi-satellite product is provided at about 12 hours after observation time. IMERG rainfall totals have been adjusted to reflect observed values in other similar extreme rainfall events.
With Harvey’s circulation still reaching out over the Gulf, the storm is able to draw in a continuous supply of warm moist air to sustain the large amount of rain it is producing.
For updated forecasts on Harvey, visit: www.nhc.noaa.gov
For more information about GPM, visit: www.nasa.gov/gpm.
Rob Gutro / Steve Lang
NASA’s Goddard Space Flight Center
Aug. 28, 2017 – (Update #1) NASA Sees Tropical Storm Harvey Moving Back into the Gulf
On Monday, Aug. 28 at 7 a.m. CDT the National Hurricane Center said the center of Harvey is emerging into the Gulf of Mexico. A NASA animation of imagery from NOAA’s GOES East satellite shows Harvey as it lingered over southeastern Texas over the weekend of Aug. 26 and 27 and moving back toward the Gulf of Mexico on Aug. 28.
Credits: NASA-NOAA GOES Project
The National Hurricane Center noted “life-threatening flooding continues over southeastern Texas.” NHC stressed that people should never attempt to travel into flooded roadways.
Taking Harvey’s Temperature
The Atmospheric Infrared or AIRS instrument aboard NASA’s Aqua satellite captured infrared data on Harvey on Aug. 28 at 4:29 a.m. EDT (0829 UTC). Infrared data provides temperature information to scientists. The image showed that the coldest cloud tops and strongest storms stretched from southeastern Texas to Louisiana and into the Gulf of Mexico. Cloud top temperatures in those areas were colder than minus 63 degrees Fahrenheit (minus 53 degrees Celsius). NASA research has shown that storms with cloud tops that cold, reached high into the troposphere and had the ability to generate heavy rain.
Satellite Animation Shows Harvey’s Movement
An animation (above, the still from animation below) of NOAA’s GOES East satellite visible and infrared imagery from 9:15 a.m. CDT (1315 UTC), Aug. 26 to 9:30 a.m. CDT (1330 UTC), Aug. 28 was created at NASA’s Goddard Space Flight Center in Greenbelt, Maryland. The animation showed Hurricane Harvey transitioning to a tropical storm at 1 p.m. CDT (1700 UTC) on Aug. 26 and slowly emerging in the Gulf of Mexico on Aug. 28.
NOAA manages the GOES series of satellites, and NASA uses the satellite data to create images and animations. The animation was created by the NASA/NOAA GOES Project at NASA’s Goddard Space Flight Center in Greenbelt, Maryland.
Heavy Rainfall and Severe Flooding
NHC noted at 7 a.m. CDT on Monday, Aug. 28 “Harvey is expected to produce additional rainfall accumulations of 15 to 25 inches through Friday over the upper Texas coast and into southwestern Louisiana. Isolated storm totals may reach 50 inches over the upper Texas coast, including the Houston/Galveston metropolitan area. These rains are currently producing catastrophic and life-threatening flooding, and flash flood emergencies are in effect for portions of southeastern Texas.
Elsewhere, Harvey is expected to produce total rain accumulations of 5 to 15 inches farther south into the middle Texas coast, farther west toward the Texas Hill Country, and farther east across south-central Louisiana.
National Weather Service Links for Harvey flooding and rainfall information:
- NWS Houston, NWS Lake Charles, NWS Corpus Christi, NWS Austin/San Antonio, Weather Prediction Center
Harvey’s Location at 7 a.m. CDT on Aug. 28
NOAA’s National Hurricane Center said at 7 a.m. CDT (8 a.m. EDT) (1200 UTC), the center of Tropical Storm Harvey was located near 28.6 degrees north latitude and 96.1 degrees west longitude. That’s about 25 miles (40 km) northeast of Port O’Connor, Texas. Harvey was moving toward the southeast near 3 mph (6 kph) and a slow southeastward motion is expected today. A slow northeastward motion is expected to begin on Tuesday. The center of Harvey is emerging off of the middle Texas coast, and it is expected to remain just offshore through Tuesday.
Maximum sustained winds are near 40 mph (65 kph) with higher gusts. Slight re-strengthening is possible later today and Tuesday, Aug. 29. The minimum central pressure estimated from surface observations along the Texas coast is 997 millibars.
Tropical Storm Warnings and Flooding Continues
On Aug. 28, a Tropical Storm Warning was in effect for Mesquite Bay to High Island, Texas. The NHC said “catastrophic and life-threatening flooding continues in southeastern Texas, and flash flood emergencies are in effect for portions of this area.”
Interests elsewhere along the upper Texas coast and in southwestern Louisiana should continue to monitor the progress of Harvey.
For updated forecasts, visit: www.nhc.noaa.gov
Rob Gutro
NASA’s Goddard Space Flight Center
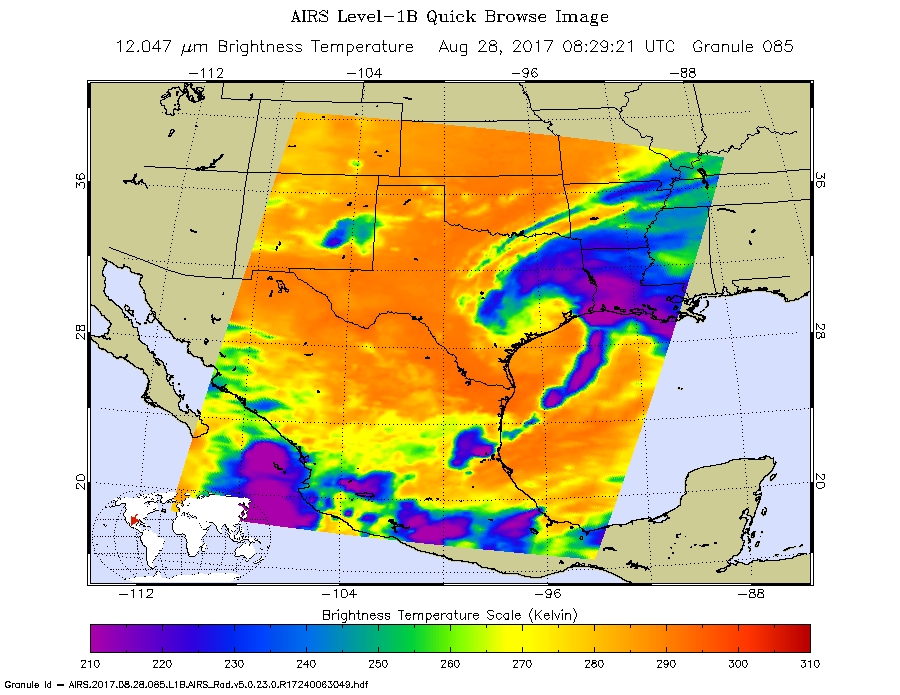
Aug. 27, 2017 – (Update #2) NASA Infrared Data Shows Harvey’s Powerful Rainmaking Capability
Tropical Storm Harvey’s center of circulation did not move much during the day on Sunday, Aug. 27 and NASA’s infrared data identified powerful storms within Harvey that had the capability to produce heavy rain.
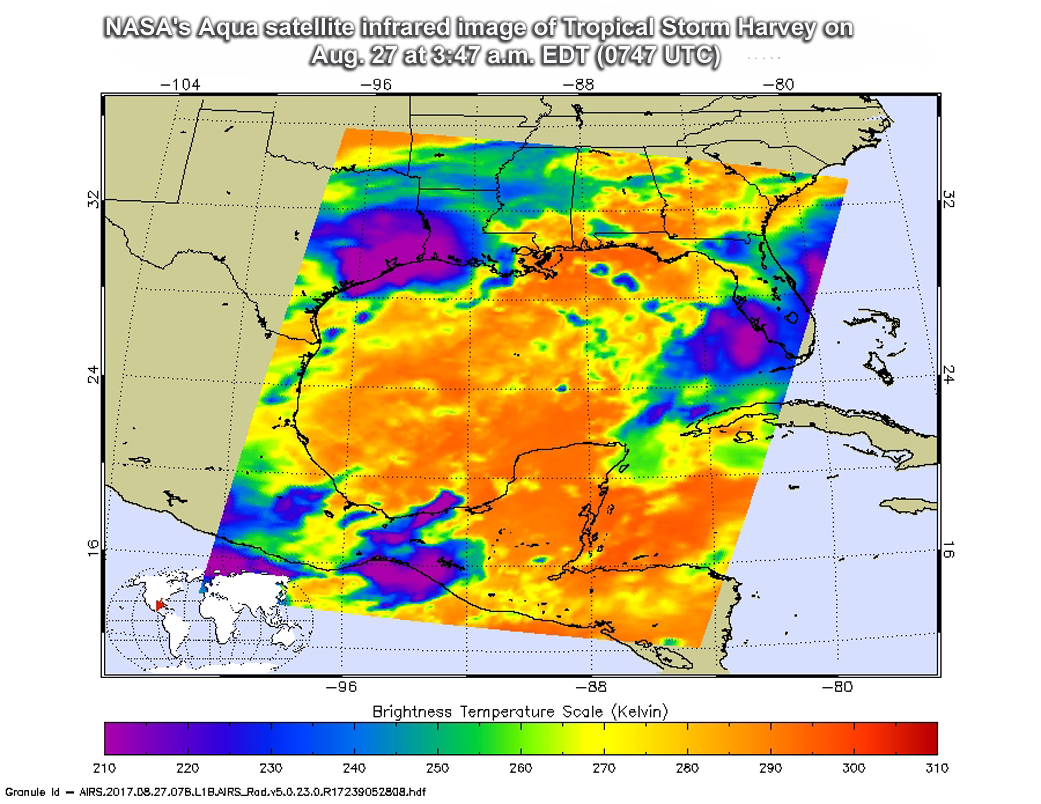
Infrared Imagery Shows Strong Storms
NASA’s Aqua satellite passed over Tropical Storm Harvey on Aug. 27 at 3:47 a.m. EDT (0747 UTC) gathering temperature data in infrared light. The Atmospheric Infrared Sounder or AIRS instrument aboard NASA’s Aqua satellite provided temperature data on Harvey’s storm tops. That’s important information to know when trying to understand how strong storms can be. The higher the cloud tops, the colder and the stronger they are. So infrared light as that gathered by the AIRS instrument can identify the strongest storms within a tropical cyclone.
AIRS detected strongest storms around the center of circulation and in a large area east of the center where cloud top temperatures were as cold as minus 63 degrees Fahrenheit (minus 53 degrees Celsius). Storms with cloud top temperatures that cold have the capability to produce heavy rainfall. The imagery showed those areas extended from southeastern Texas into southeastern Louisiana.
Harvey’s Location at 7 p.m. CDT on Aug. 27
NOAA’s National Hurricane Center said at 7 p.m. CDT (8 p.m. EDT/2100 UTC), the center of Tropical Storm Harvey moved closer to Victoria, Texas. It was located by Doppler radar near latitude 28.9 North, longitude 96.8 West. That put’s Harvey’s center about 10 miles (15 km) northeast of Victoria, Texas. Harvey was moving to the southeast at 3 mph (6 kph). Maximum sustained winds were near 40 mph (65 kph) with higher gusts. The estimated minimum central pressure was 1,000 millibars.
Warnings Continue
At 7 p.m. CDT (8 p.m. EDT) on Aug. 27 Tropical Storm Warning is in effect for Port O’Connor to Sargent, Texas. A Tropical Storm Watch is in effect from north of Sargent to San Luis Pass Texas.
NOAA’s National Hurricane Center noted “Catastrophic and life-threatening flooding continues in southeastern Texas, and flash flood emergencies are in effect for portions of this area. Please see warnings and other products issued by your local National Weather Service office for additional information on this life-threatening situation.”
Harvey is expected to produce additional rainfall accumulations of 15 to 25 inches through Friday over the upper Texas coast and into southwestern Louisiana. Isolated storm totals may reach 50 inches over the upper Texas coast, including the Houston/ Galveston metropolitan area. These rains are currently producing catastrophic and life-threatening flooding, and flash flood emergencies are in effect for portions of southeastern Texas. Elsewhere, Harvey is expected to produce total rain accumulations of 5 to 15 inches farther south into the middle Texas coast, farther west toward the Texas Hill Country, and farther east across south-central Louisiana.
Do not attempt to travel in the affected area if you are in a safe place. Do not drive into flooded roadways.
A list of rainfall observations compiled by the NOAA Weather Prediction Center can be found at: www.wpc.ncep.noaa.gov/discussions/nfdscc1.html
For updated forecasts and more information winds, storm surge and potential for tornadoes, visit: www.nhc.noaa.gov
Rob Gutro
NASA’s Goddard Space Flight Center
Aug. 27, 2018 – (Update #1) NASA Sees Tropical Storm Harvey Almost Stationary, Severe Flooding Continues
The National Hurricane Center said on Sunday, August 27, 2017, that Harvey is producing catastrophic and life-threatening flooding and there are flash flood emergencies in effect for portions of southeastern Texas. Satellite imagery taken 12 hours apart revealed that Harvey remains almost stationary.
Large Rainfall and Severe Flooding
On Aug. 27, Tropical Storm Harvey is almost stationary in its position about 45 miles (70 km) west-northwest of Victoria, Texas, and has brought flooding rains north to the Houston metro area stretching to southern Texas.
The National Hurricane Center (NHC) said that Harvey is expected to produce additional rain accumulations of 15 to 25 inches over the middle and upper Texas coast through Thursday. Isolated storm totals may reach around 40 inches in this area. These rains are currently producing catastrophic and life-threatening flooding, and flash flood emergencies are in effect for portions of southeastern Texas.
National Weather Service Links for Harvey flooding and rainfall information:
- NWS Houston, NWS Lake Charles, NWS Corpus Christi, NWS Austin/San Antonio, Weather Prediction Center
- Discussion on SE Texas/SW Louisiana flooding from Harvey from WPC
Two Satellite Views Show Little Movement
Because there’s no atmospheric mechanism to steer Harvey out of the area, the tropical storm is barely moving over eastern Texas. Two satellite images taken about 12 hours apart from NASA-NOAA’s Suomi NPP satellite and NOAA’s GOES-East satellite basically show the center of circulation in the same place.
On Aug. 26 NASA-NOAA’s Suomi NPP satellite captured a visible image of Tropical Storm Harvey over Texas (at top of story). At the time of the image, Harvey’s center was located between San Antonio and Victoria.
At NASA’s Goddard Space Flight Center in Greenbelt, Maryland, an image of Harvey’s cloud extent was created using visible light data from NOAA’s GOES-East satellite on Aug. 27 at 10:30 a.m. EDT (1430 UTC). Harvey’s bands of thunderstorms stretching far to the east over Louisiana.
NOAA manages the GOES series of satellites, and NASA uses the satellite data to create images and animations. The animation was created by the NASA/NOAA GOES Project at NASA’s Goddard Space Flight Center in Greenbelt, Maryland.
Harvey’s Location at 7 a.m. CDT on Aug. 27
NOAA’s National Hurricane Center said at 7 a.m. CDT (8 a.m. EDT/1200 UTC), the center of Tropical Storm Harvey was located near latitude 29.0 North and longitude 97.6 West. Harvey is crawling to the south-southeast near 1 mph (2 kph), and a slow southeastward to east-southeastward motion is expected over the next couple of days. On the forecast track, the center will remain inland or move very near the coast of southeastern Texas through Monday.
Maximum sustained winds are near 45 mph (75 kph) with higher gusts. Some weakening is forecast during the next 48 hours. Tropical-storm-force winds extend outward up to 60 miles (95 km) from the center. An NOS site near the entrance to Matagorda Bay recently reported sustained winds of 40 mph (65 kph) with a gust to
53 mph (85 kph). The estimated minimum central pressure is 998 millibars.
Storm Surge and Tropical Storm Warnings Also Continue
A Storm Surge Warning was in effect for Port O’Connor to Sargent, Texas and a Tropical Storm Warning is in effect for Port O’Connor to Sargent, Texas.
According to NHC, Harvey is likely to become a tropical depression by tonight.
For updated forecasts, visit: www.nhc.noaa.gov
Rob Gutro
NASA’s Goddard Space Flight Center
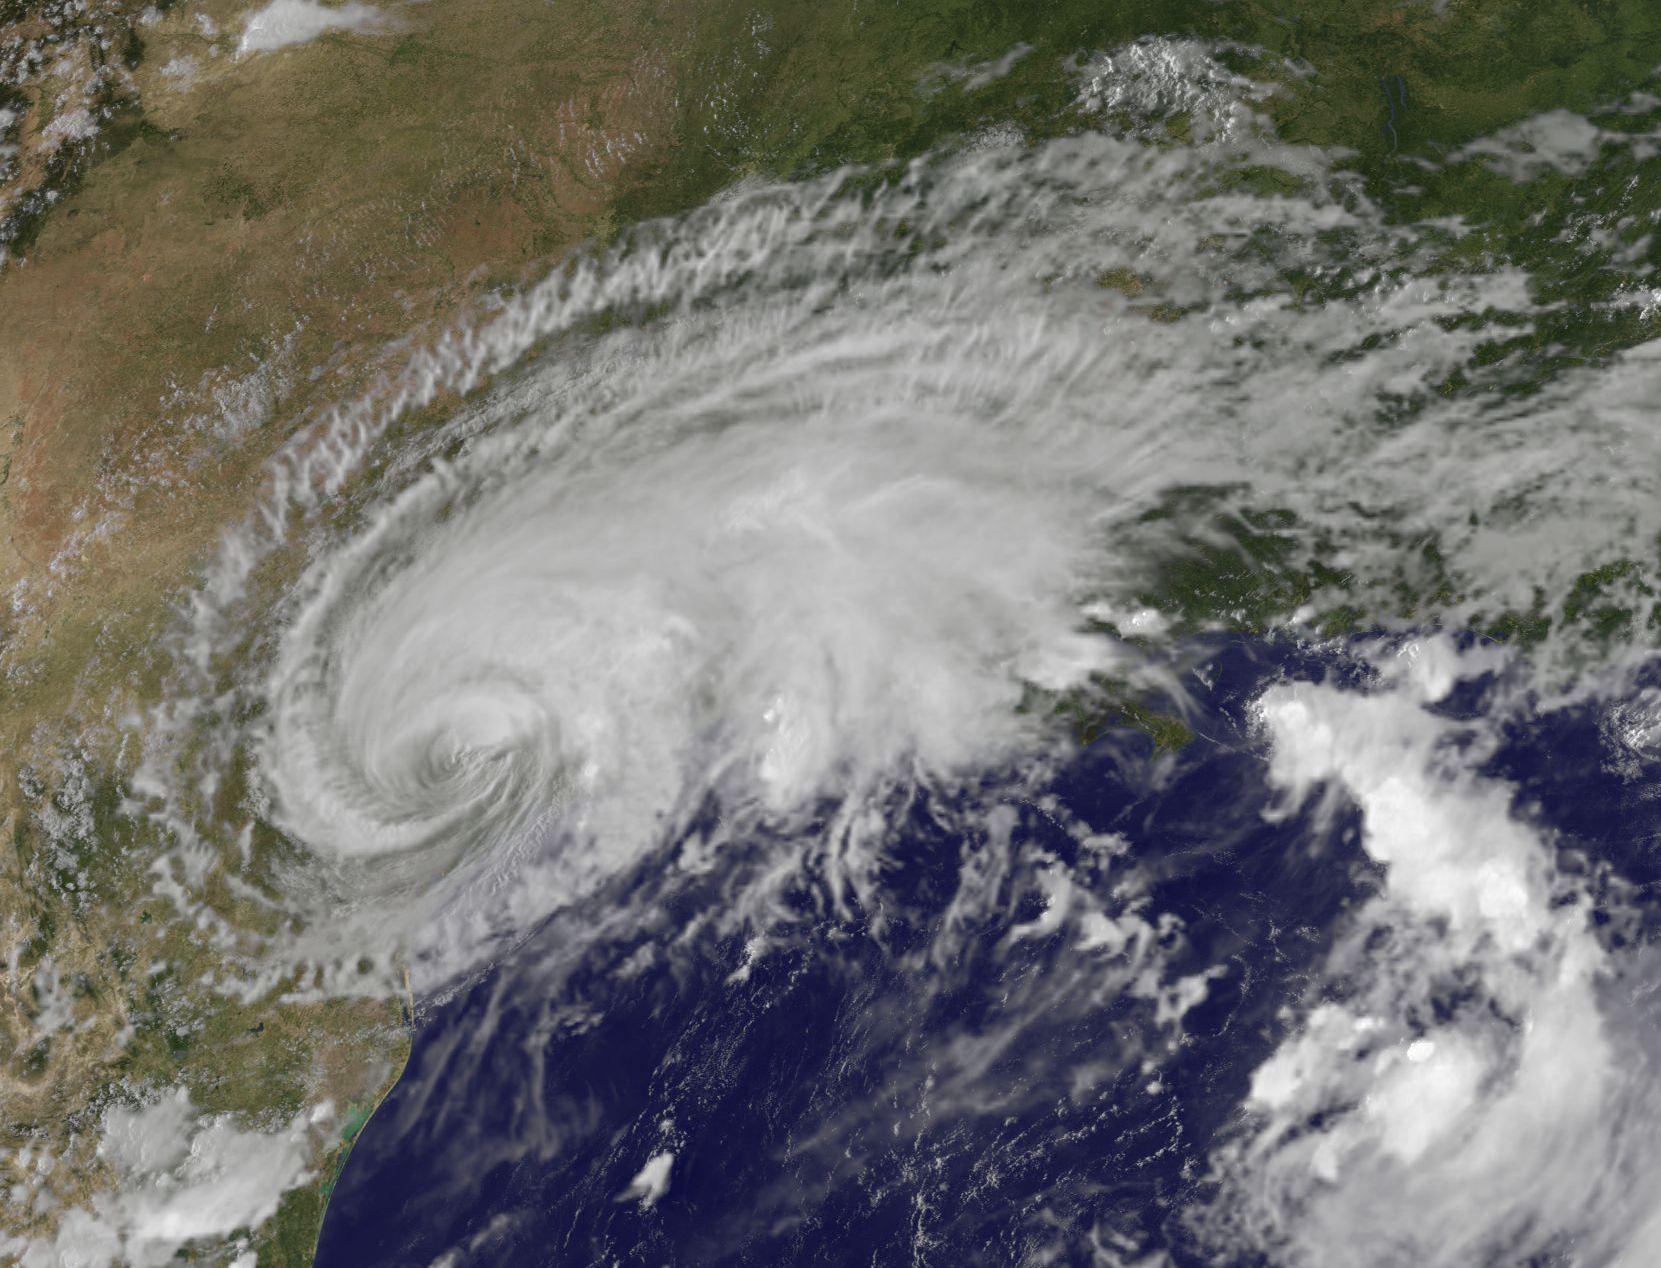
Aug. 26, 2017 – (Update #2) NASA Sees a Slow-Moving, Soaking Tropical Storm Harvey
Hurricane Harvey has weakened to Tropical Storm while still centered over southeastern Texas, but continues to generate a tremendous amount of rainfall. Satellite imagery revealed the eye had disappeared as the storm weakened.
A visible light image from NASA’s Aqua satellite was captured by the MODIS instrument at 1:30 p.m. CDT on Aug. 26. In the image, Harvey’s northernmost clouds cover Dallas, and southern extent stretched from Corpus Christi on the east coast, to Laredo in southwestern Texas. At the time of the image, Harvey still maintained an eye and it was located between San Antonio and Victoria.
At NASA’s Goddard Space Flight Center in Greenbelt, Maryland, an image was created using visible light data from NOAA’s GOES-East satellite imagery on Aug. 26 at 6:45 p.m. EDT (2245 UTC). The image showed a somewhat elongated center of circulation with a large area of thunderstorms wrapped around the center. Harvey’s bands of thunderstorms stretching far to the east over Louisiana.
NOAA manages the GOES series of satellites, and NASA uses the satellite data to create images and animations. The animation was created by the NASA/NOAA GOES Project at NASA’s Goddard Space Flight Center in Greenbelt, Maryland.
Harvey’s Location at 4 p.m. CDT on Aug. 26
NOAA’s National Hurricane Center said at 4 p.m. CDT (5 p.m. EDT/2100 UTC), the center of Tropical Storm Harvey was located by Doppler radar near latitude 29.1 North, longitude 97.6 West. That put’s Harvey’s center about 45 miles (70 km) west-northwest of Victoria, Texas. Harvey has been nearly stationary and little motion is anticipated during the next few days.
Maximum sustained winds have decreased to near 65 mph (100 km/h) with higher gusts. Additional weakening is expected during the next day or two. Tropical-storm-force winds extend outward up to 115 miles (185 km) from the center. The estimated minimum central pressure is 990 mb (29.24 inches).
Warnings Continue
A Storm Surge Warning was in effect for Port Aransas to High Island, Texas and a Tropical Storm Warning is in effect for Baffin Bay to High Island, Texas.
In addition, flooding remains the major concern. The National Hurricane Center said Harvey is expected to produce additional rain accumulations of 15 to 25 inches over the middle and upper Texas coast through Thursday. Isolated storm totals may reach around 40 inches in this area. Elsewhere during the same period, Harvey is expected to produce total rain accumulations of 5 to 15 inches farther south toward the lower Texas coast, farther west toward the Texas Hill Country and southwest and central Louisiana. Rainfall of this magnitude will cause catastrophic and life-threatening flooding.
NHC’s Key Messages While Harvey Barely Moves
1. While Harvey’s winds are decreasing, life-threatening hazards will continue from heavy rainfall over much of southeastern Texas and from storm surge along portions of the Texas coast.
2. Catastrophic and life-threatening flooding is expected across the middle and upper Texas coast from additional rainfall of 15 to 25 inches, with isolated storm totals as high as 40 inches, through Thursday, Aug. 31.
3. A Storm Surge Warning remains in effect for portions of the Texas coast. Life-threatening storm surge flooding will be slow to recede due to the slow motion of Harvey and a prolonged period of onshore flow. For a depiction of areas at risk, see the Storm Surge Watch/Warning Graphic at www.hurricanes.gov.
A list of rainfall observations compiled by the NOAA Weather Prediction Center can be found at: www.wpc.ncep.noaa.gov/discussions/nfdscc1.html
For updated forecasts, visit: www.nhc.noaa.gov
Rob Gutro
NASA’s Goddard Space Flight Center
Aug. 26 – (Update #1)NASA Analyzes Hurricane Harvey’s Rainfall, Sees Landfall
Satellites have been providing forecasters with valuable information as Harvey intensified to a Category 4 hurricane before making landfall in southeastern Texas. NASA’s GPM satellite and NOAA’s GOES-East satellite provided a look at Harvey’s heavy rainfall, cloud heights, temperatures and extent of the storm.
At 6 pm CDT on Aug 25, the National Hurricane Center noted that Harvey had strengthened to a Category 4 Hurricane on the Saffir-Simpson Hurricane Wind Scale. Harvey’s winds had increased to 130 mph (215 kph).
At 8:55 p.m. EDT when Harvey’s large eye was at the coast between Port Aransas and Port O’Connor, NOAA’s GOES East satellite provided an infrared picture of the massive storm. The eye appeared clear in the image created at NASA/NOAA GOES Project at NASA’s Goddard Space Flight Center, Greenbelt, Maryland.
Harvey’s eye made landfall around 10 p.m. CDT (11 p.m. EDT) on Friday, Aug 25 as a Category 4 hurricane between Port Aransas and Port O’Connor, Texas. The NHC said Harvey’s landfall was over the northern end of San Jose Island about 4 miles (6 km) east of Rockport.
Harvey is the first Category 4 hurricane to make landfall in Texas since Carla in 1961.
Measurements of Winds and Pressure Just After Landfall
At 11 p.m. CDT (12 a.m. EDT) a station at Aransas Pass run by the Texas Coastal Observing Network reported a sustained wind of 102 mph (165 kph) with a gust to 132 mph (213 kph). A station at Rockport, Texas, reported a pressure of 945 millibars on the western side of the eye.
At 12 a.m. CDT (1 a.m. EDT) on Aug. 26, a station at Copano Bay, Texas, reported a sustained wind of 74 mph (118 kph) with a gust to 110 mph (178 kph) in the northern eyewall. A station at Aransas Wildlife Refuge run by the Texas Coastal Observing Network recently reported a sustained wind of 78 mph (126 kph) with a gust to 105 mph (170 kph). A station at Rockport, Texas, reported a minimum pressure of 942 millibars in the eye.
NASA Measures Harvey’s Rainfall
The Global Precipitation Measurement (GPM) mission core observatory satellite had another look at Hurricane Harvey on Aug. 25, at 7:50 a.m. CDT (1150 UTC) as it was menacing the Texas gulf coast. GPM’s Dual-Frequency Precipitation Radar (DPR) instrument scanned precipitation within powerful storms wrapping around the eastern side of the hurricane. DPR found that intense storms in that area were dropping rain at a rate greater than 3.2 inches (82 mm) per hour.
GPM’s Radar (DPR Ku Band) also was used to examine the 3-D configuration of precipitation within the storms on hurricane Harvey’s eastern side. DPR showed that storm tops there reached altitudes above 9.2 miles (14.8 km). GPM’s radar found the tallest of these powerful storms in a band of precipitation that was approaching the coastline near the Texas and Louisiana borders. These storms were measured by GPM’s radar reaching an altitude of over 10.3 miles (16.6 km).
GPM is co-managed by NASA and the Japan Aerospace Exploration Agency, JAXA.
On Saturday, Aug. 26, almost 10 inches of rain have already been reported at a few locations in southeastern Texas as of 4 a.m. CDT (5 a.m. EDT).
Credits: NASA/JAXA, Hal Pierce
Warnings and Watches on Saturday, August 26
At 4 a.m. CDT (5 a.m. EDT) on Saturday, August 26, 2017 the warnings continued as Harvey moved slowly inland. A Storm Surge Warning is in effect for Baffin Bay to High Island, Texas. A Hurricane Warning is in effect for Baffin Bay to Port O’Connor, Texas and a Tropical Storm Warning is in effect from north of Port O’Connor to High Island, Texas.
Harvey’s Status at 5 a.m. EDT on August 26
At 4 a.m. CDT (5 a.m. EDT) the National Hurricane Center (NHC) the eye of Hurricane Harvey was located by NOAA Doppler radar near 28.5 degrees north latitude and 97.2 degrees west longitude. That’s about 30 miles (50 km) southwest of Victoria, Texas.
Harvey was moving toward the northwest near 6 mph (9 kph). NHC said Harvey is expected to slow down through the day and meander over southeastern Texas through the middle of next week. Doppler radar data indicate that maximum sustained winds have decreased to near 100 mph (155 kph) with higher gusts. Additional weakening is forecast, and Harvey is likely to become a tropical storm later today.
Hurricane-force winds extend outward up to 35 miles (55 km) from the center, and tropical-storm-force winds extend outward up to 140 miles (220 km). The estimated minimum central pressure is 963 millibars.
GOES East Satellite View of Harvey at 7 a.m. EDT on Aug. 26
At 6 a.m. CDT (7 a.m. EDT) as Harvey’s center continued to slowly meander over land, NOAA’s GOES East satellite provided an infrared picture of the massive storm. Harvey’s eye was still apparent in the image created at NASA/NOAA GOES Project at NASA’s Goddard Space Flight Center, Greenbelt, Maryland.
NHC Forecast: Hazards Affecting Land
Rainfall: Harvey is expected to produce total rain accumulations of 15 to 30 inches and isolated maximum amounts of 40 inches over the middle and upper Texas coast through next Wednesday. During the same time period Harvey is expected to produce total rain accumulations of 5 to 15 inches in far south Texas and the Texas Hill Country over through southwest and central Louisiana. Rainfall of this magnitude will cause catastrophic and life-threatening flooding.
Storm Surge: The combination of a dangerous storm surge and the tide will cause normally dry areas near the coast to be flooded by rising waters moving inland from the shoreline. The water is expected to reach the following heights above ground if the peak surge occurs at the time of high tide…
Port Aransas to Port O’Connor…6 to 12 ft
Port O’Connor to Sargent…6 to 9 ft
Sargent to Jamaica Beach…4 to 6 ft
Baffin Bay to Port Aransas…3 to 6 ft
Jamaica Beach to High Island…2 to 4 ft
Mouth of the Rio Grande to Port Mansfield…1 to 3 ft
High Island to Morgan City…1 to 3 ft
The deepest water will occur along the immediate coast near and to the northeast of the landfall location, where the surge will be accompanied by large and destructive waves. Surge-related flooding depends on the relative timing of the surge and the tidal cycle, and can vary greatly over short distances. For information specific to your area, please see products issued by your local National Weather Service forecast office.
Wind: Hurricane conditions are occurring inland from the coast within Harvey’s eyewall, and hurricane-force winds, especially in gusts, are still possible near the middle Texas coast for the next several hours. Tropical storm conditions are occurring in other portions of the hurricane and tropical storm warning areas. Tropical storm conditions are likely to persist along portions of the coast through at least Sunday.
Surf: Swells generated by Harvey are affecting the Texas, Louisiana, and northeast Mexico coasts. These swells are likely to cause life-threatening surf and rip current conditions.
Tornadoes: Tornadoes are possible today and tonight near the middle and upper Texas coast into far southwest Louisiana.
For forecast updates, visit: www.nhc.noaa.gov
Rob Gutro
NASA’s Goddard Space Flight Center
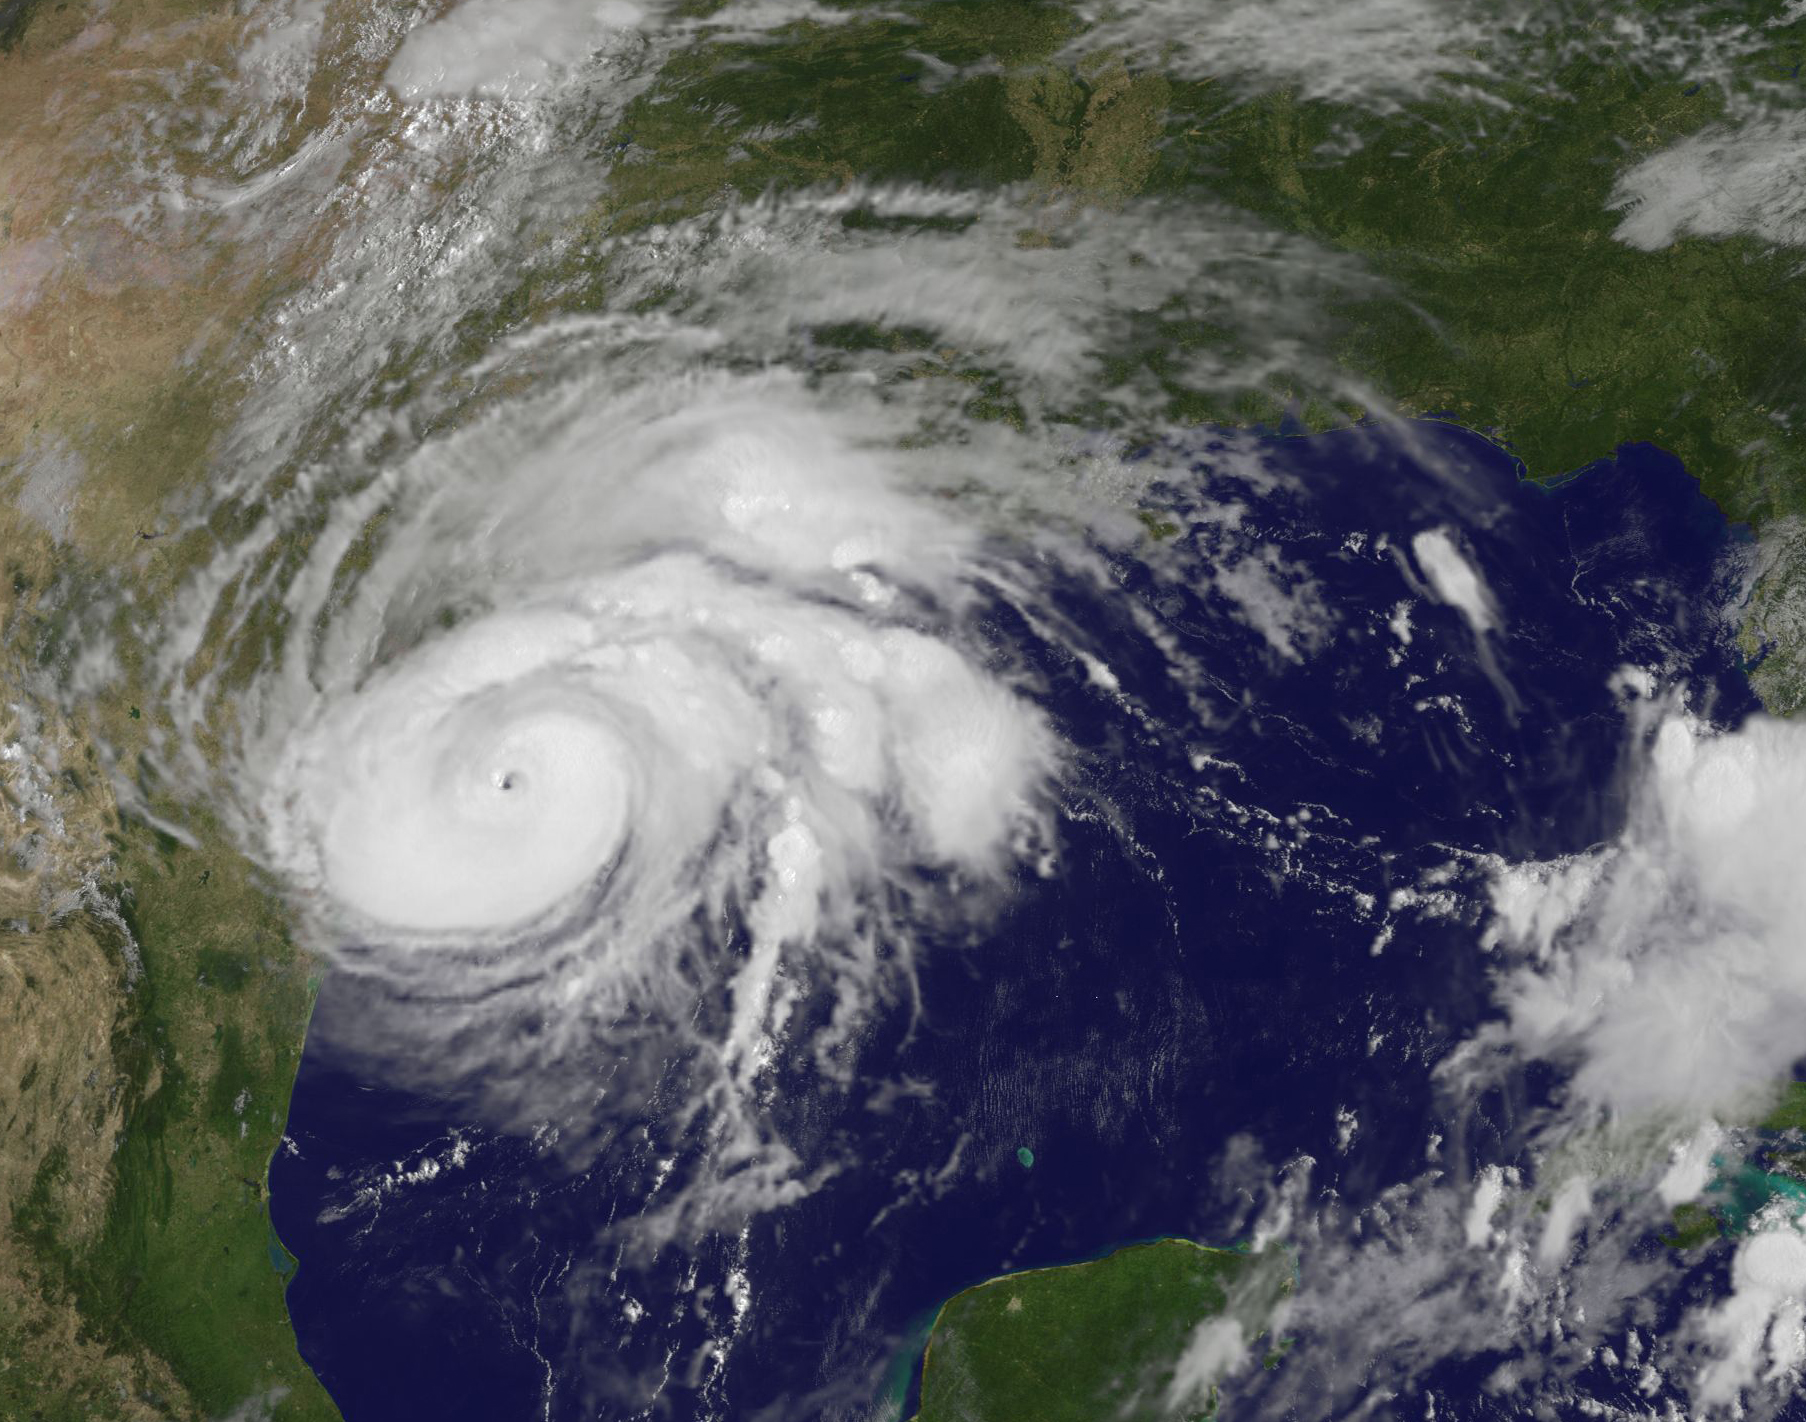
Aug. 25, 2017 – (Update #4) -Satellite Sees Harvey Now a Category 4 Hurricane Near the Texas Coastline
At 6 pm CDT today, Aug 25, the National Hurricane Center noted that Harvey had strengthened to a Category 4 Hurricane on the Saffir-Simpson Hurricane Wind Scale. Harvey’s winds had increased to 130 mph (215 kph).
At 7 p.m. CDT (8 p.m. EDT), the NHC said that the eye of Category 4 Harvey was approaching the coast between Port Aransas and Port O’Connor, Texas and that “catastrophic flooding expected due to heavy rainfall and storm surge.”
At 8:55 p.m. EDT when Harvey’s large eye was at the coast between Port Aransas and Port O’Connor, NOAA’s GOES East satellite provided an infrared picture of the massive storm. The eye appeared clear in the image created at NASA/NOAA GOES Project at NASA’s Goddard Space Flight Center, Greenbelt, Maryland.
A Storm Surge Warning is in effect for Port Mansfield to High Island Texas, a Hurricane Warning is in effect for Port Mansfield to Sargent, Texas, and a Tropical Storm Warning is in effect from north of Sargent to High Island, Texas.
At 7 p.m.CDT (0000 UTC) the National Hurricane Center said the eye of Hurricane Harvey was located by reconnaissance aircraft and NOAA Doppler radar near latitude 27.8 North, longitude 96.8 West. Harvey is moving toward the northwest near 8 mph (13 km/h), but its forward speed is expected to decrease during the next couple of days. On the forecast track, Harvey will make landfall on the middle Texas coast during the next several hours. Harvey is then likely to meander near or just inland of the middle Texas coast through the weekend.
Reports from an Air Force Reserve Hurricane Hunter aircraft indicate that maximum sustained winds remain near 130 mph (215 km/h) with higher gusts. Harvey is a category 4 hurricane on the Saffir-Simpson Hurricane Wind Scale. Little change in strength is likely before landfall. Weakening is then expected over the weekend while the center moves inland over Texas.
Hurricane-force winds extend outward up to 35 miles (55 km) from the center, and tropical-storm-force winds extend outward up to 140 miles (220 km). A Texas Coastal Ocean Observing Network station at Aransas Pass recently reported sustained winds of 79 mph (128 km/h) and a wind gust of 101 mph (163 km/h).
Following is the NHC’s forecast as of 7 p.m. CDT:
RAINFALL: Harvey is expected to produce total rain accumulations of 15 to 30 inches and isolated maximum amounts of 40 inches over the middle and upper Texas coast through next Wednesday. During the same time period Harvey is expected to produce total rain accumulations of 5 to 15 inches in far south Texas and the Texas Hill Country over through southwest and central Louisiana. Rainfall of this magnitude will cause catastrophic and life-threatening flooding.
STORM SURGE: The combination of a dangerous storm surge and the tide will cause normally dry areas near the coast to be flooded by rising waters moving inland from the shoreline. The water is expected to reach the following heights above ground if the peak surge occurs at the time of high tide…
Port Aransas to Port O’Connor…9 to 13 ft
Elsewhere N Entrance Padre Island Natl Seashore to Sargent…6 to 12 ft
Sargent to Jamaica Beach…5 to 8 ft
Port Mansfield to N Entrance Padre Island Natl Seashore…3 to 5 ft
Jamaica Beach to High Island…2 to 4 ft
Mouth of the Rio Grande to Port Mansfield…1 to 3 ft
High Island to Morgan City…1 to 3 ft
The deepest water will occur along the immediate coast near and to the northeast of the landfall location, where the surge will be accompanied by large and destructive waves. Surge-related flooding depends on the relative timing of the surge and the tidal cycle, and can vary greatly over short distances.
WIND: Hurricane conditions are occuring along the coast in the Port Aransas area and should spread over other portions of the hurricane warning area during the next several hours. Tropical storm conditions are occurring in other portions of the hurricane and tropical storm warning areas. Tropical storm conditions are likely to persist along portions of the coast through at least Sunday.
SURF: Swells generated by Harvey are affecting the Texas, Louisiana, and northeast Mexico coasts. These swells are likely to cause life-threatening surf and rip current conditions. Please consult products from your local weather office.
TORNADOES: A few tornadoes are possible through Saturday near the middle and upper Texas coast into far southwestern Louisiana.
NHC’s longer forecast says: Based on the forecast track, Harvey is expected to make landfall along the middle Texas coast tonight. After that, the track models insist that the hurricane will slow down considerably during the next 24 hours, and it is likely to move very little between 36 and 120 hours.
For forecast updates, visit: www.nhc.noaa.gov #HurricaneHarvey
Rob Gutro
NASA’s Goddard Space Flight Center
Aug. 25, 2017 (Update #3) – NASA Captures Category 4 Harvey From the International Space Station
The astronauts in the International Space Station orbiting above the Earth get a satellite’s-eye view of the devastating Category 4 hurricane Harvey. Harvey began a Category 4 hurricane at 7pm EDT. The National Hurricane Center says Harvey is “producing sustained hurricane-force winds spreading onto the middle Texas coast.” Hurricane Harvey is predicted to hit land at 1:00 am CDT according to the National Hurricane Center. It is also expected to stall once it hits land and produce catastrophic flooding across parts of Texas.
Credits: NASA
Lynn Jenner
NASA Goddard Space Flight Center
Aug. 25, 2017 (Update #2) – NASA Gets an In-Depth Look at Intensifying Hurricane Harvey
As Hurricane Harvey continued to strengthen, NASA analyzed the storm’s rainfall, cloud heights and cloud top temperatures. NASA’s GPM and Aqua satellite provided information while an animation of GOES-East satellite imagery showed Harvey’s progression toward the Texas coast.
Harvey’s intensification has been aided by movement through an environment that includes low vertical wind shear and the warm waters in the Gulf of Mexico.
Analyzing Harvey’s Rainfall
The Global Precipitation Mission (GPM) core observatory satellite flew almost directly above intensifying Hurricane Harvey on August 24, 2017 at 6:30 p.m. EDT (2230 UTC) when maximum sustained winds had increased to about 86 mph (75 knots). GPM’s Microwave Imager (GMI) instrument peered through dense storm clouds to reveal the location of intense rainfall bands near the center of the hurricane. The Goddard Profiling Algorithm (GPROF), using GMI data, indicated that powerful storms in the hurricane were dropping rain at a rate of over 2.1 inches (54 mm) per hour. GPM is a joint mission between NASA and the Japan Aerospace Exploration Agency, JAXA.
Animating Harvey’s Track and Development
An animation of NOAA’s GOES-East satellite infrared and visible imagery from August 23 to August 25 showed the redevelopment and movement of Hurricane Harvey in the western Gulf of Mexico. By today, Aug. 25, Harvey had moved along the coast of southeastern Texas.
Credits: NASA-NOAA GOES Project
Infrared Data Shows Location of Powerful Storms
The Atmospheric Infrared Sounder or AIRS instrument that flies aboard NASA’s Aqua satellite analyzed Harvey in infrared light on Aug. 25 at 3:59 a.m. EDT (0759 UTC). AIRS data showed Harvey had a strong circular area of powerful thunderstorms around the center of circulation. A thick band of powerful thunderstorms were located north to east of the center.
In both the center and the band, AIRS detected strong thunderstorms high into the troposphere with very cold cloud top temperatures. Some of the coldest cloud top temperatures exceeded minus 81 degrees Fahrenheit (minus 63 degrees Celsius). Storms with temperatures that cold are high in the troposphere and NASA research has shown they have the ability to generate heavy rain. That heavy rain is in the forecast for Texas and Louisiana, according to the National Hurricane Center (NHC).
National Hurricane Center: Harvey’s Location and Status
At 8 a.m. EDT (1200 UTC) on Aug. 25, the National Hurricane Center (NHC) noted the eye of Hurricane Harvey was located by Air Force Reserve reconnaissance aircraft and NOAA Doppler radar near 26.3 degrees north latitude and 95.8 degrees west longitude.
Harvey is moving toward the northwest near 10 mph (17 km/h), but its forward speed is expected to decrease significantly during the next couple of days. Maximum sustained winds are near 110 mph (175 kph) with higher gusts. Some strengthening is possible, and Harvey is expected to become a major hurricane before it reaches the middle Texas coast. Hurricane-force winds extend outward up to 35 miles (55 km) from the center, and tropical-storm-force winds extend outward up to 140 miles (220 km).The minimum central pressure reported by the Air Force plane was 950 millibars.
NHC Forecast: Rainfall, Storm Surge, Wind, Surf and Isolated Tornadoes
The National Hurricane Center forecast at 8 a.m. EDT on Aug. 25 outlined the threats of rainfall, storm surge, wind, surf and isolated tornadoes:
Rainfall
Harvey is expected to produce total rain accumulations of 15 to 25 inches and isolated maximum amounts of 35 inches over the middle and upper Texas coast through next Wednesday. During the same time period Harvey is expected to produce total rain accumulations of 7 to 15 inches in far south Texas and the Texas Hill Country eastward through central and southwest Louisiana, with accumulations of up to 7 inches extending into other parts of Texas and the lower Mississippi Valley. Rainfall from Harvey will cause devastating and life-threatening flooding.
Storm Surge
NHC said, the combination of a dangerous storm surge and the tide will cause normally dry areas near the coast to be flooded by rising waters moving inland from the shoreline. The water is expected to reach the following heights above ground if the peak surge occurs at the time of high tide…
- N Entrance Padre Island Natl Seashore to Sargent…6 to 12 ft
- Sargent to Jamaica Beach…5 to 8 ft
- Port Mansfield to N Entrance Padre Island Natl Seashore…5 to 7 ft
- Jamaica Beach to High Island…2 to 4 ft
- Mouth of the Rio Grande to Port Mansfield…2 to 4 ft
- High Island to Morgan City…1 to 3 ft
The deepest water will occur along the immediate coast near and to the northeast of the landfall location, where the surge will be accompanied by large and destructive waves. Surge-related flooding depends on the relative timing of the surge and the tidal cycle, and can vary greatly over short distances.
Winds, Hurricane Conditions
Hurricane conditions are likely within the hurricane warning area later on Aug.25 (today and tonight), with tropical storm conditions expected to first reach the coast in the hurricane warning area later in the morning. These conditions are likely to persist into Saturday in portions of the hurricane and tropical storm warning area.
Surf, Dangerous Swells, Rip Currents
Swells generated by Harvey will begin to affect the Texas, Louisiana, and northeast Mexico coasts later this morning. These swells are likely to cause life-threatening surf and rip current conditions
Isolated Tornadoes
Isolated tornadoes are possible across portions of the middle and upper Texas coast today.
On the forecast track, Harvey will make landfall on the middle Texas coast tonight or early Saturday. Harvey is then likely to meander near or just inland of the middle Texas coast through the weekend.
For updated forecasts, visit the NHC website: www.nhc.noaa.gov.
Top image caption: The Copernicus Sentinel-3A satellite saw the temperature at the top of Hurricane Harvey on 25 August 2017 at 04:06 GMT as the storm approached the US state of Texas. The brightness temperature of the clouds at the top of the storm, some 12–15 km above the ocean, range from about –80°C near the eye of the storm to about 20°C at the edges. Credit: Copernicus Sentinel 3-A satellite, processed by ESA
Rob Gutro / Hal Pierce
NASA’s Goddard Space Flight Center
Aug. 25, 2017 – (Update #1) Space Station Camera Captures New Views of Hurricane Harvey
The National Hurricane Center (NHC) upgraded the remnants of tropical storm Harvey to a tropical depression on August 23, 2017 at 11 a.m. EDT (1500 UTC). Harvey became better organized and was revived after moving from Mexico’s Yucatan Peninsula into the Bay of Campeche. The warm waters of the Gulf of Mexico and favorable vertical wind shear promoted the regeneration of the tropical cyclone. This video includes views from The International Space Station recorded on August 24, 2017 at 6:15 p.m. Eastern Time.
Aug. 24, 2017 – (Update #2) Tropical Storm Harvey Upgraded to Hurricane Harvey
The National Hurricane Center has reported that Harvey has been upgraded to a Category 1 (on the Saffir-Simpson scale) hurricane as of 5:00 pm EDT.
Lynn Jenner
NASA’s Goddard Space Flight Center
Aug. 24, 2017 – (Update #1) NASA Finds Heavy Rainfall in Intensifying Tropical Storm Harvey
NASA examined Harvey as it began to intensify and organize and found heavy rainfall in the system. NASA also created an animation that showed Harvey’s intensification from a low pressure area into a hurricane.
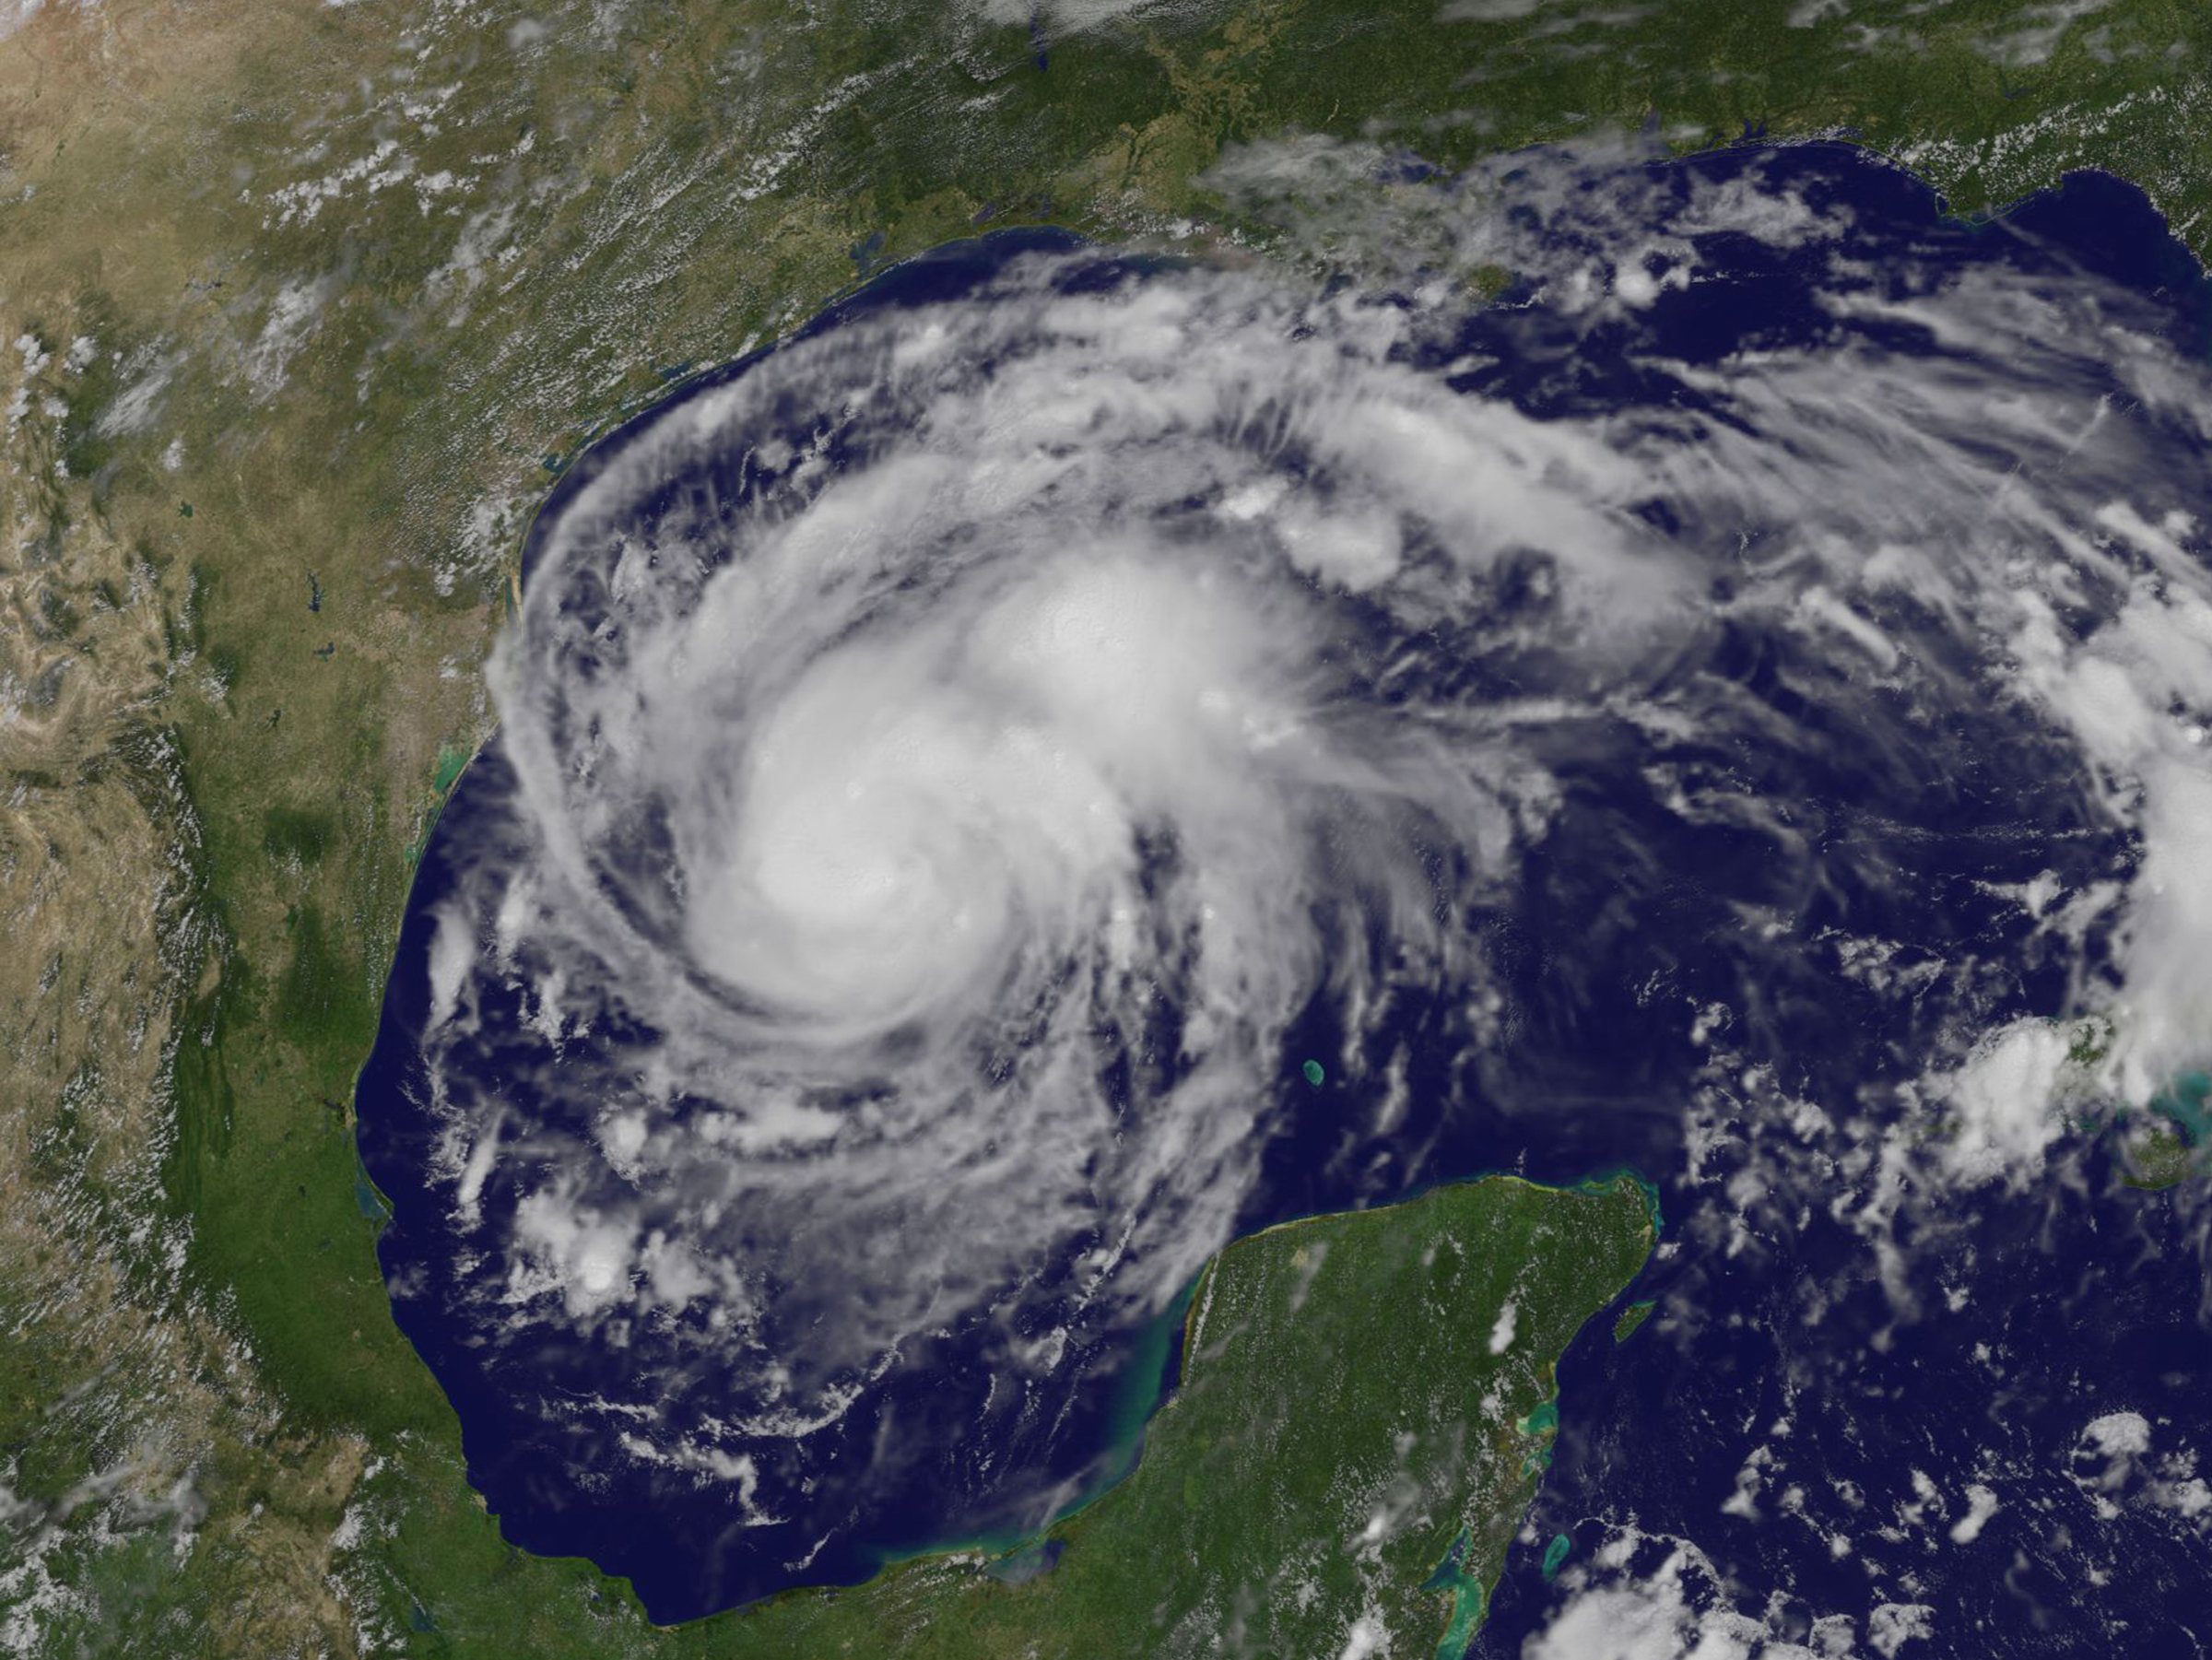
The National Hurricane Center (NHC) upgraded the remnants of tropical storm Harvey to a tropical depression on August 23, 2017 at 11 a.m. EDT (1500 UTC). Harvey became better organized and was revived after moving from Mexico’s Yucatan Peninsula into the Bay of Campeche. The warm waters of the Gulf of Mexico and favorable vertical wind shear promoted the regeneration of the tropical cyclone.
On Aug. 24, NHC noted that Harvey was quickly strengthening and is forecast to be a major Hurricane when it approaches the middle Texas coast. In addition, life-threatening storm surge and freshwater flooding expected.
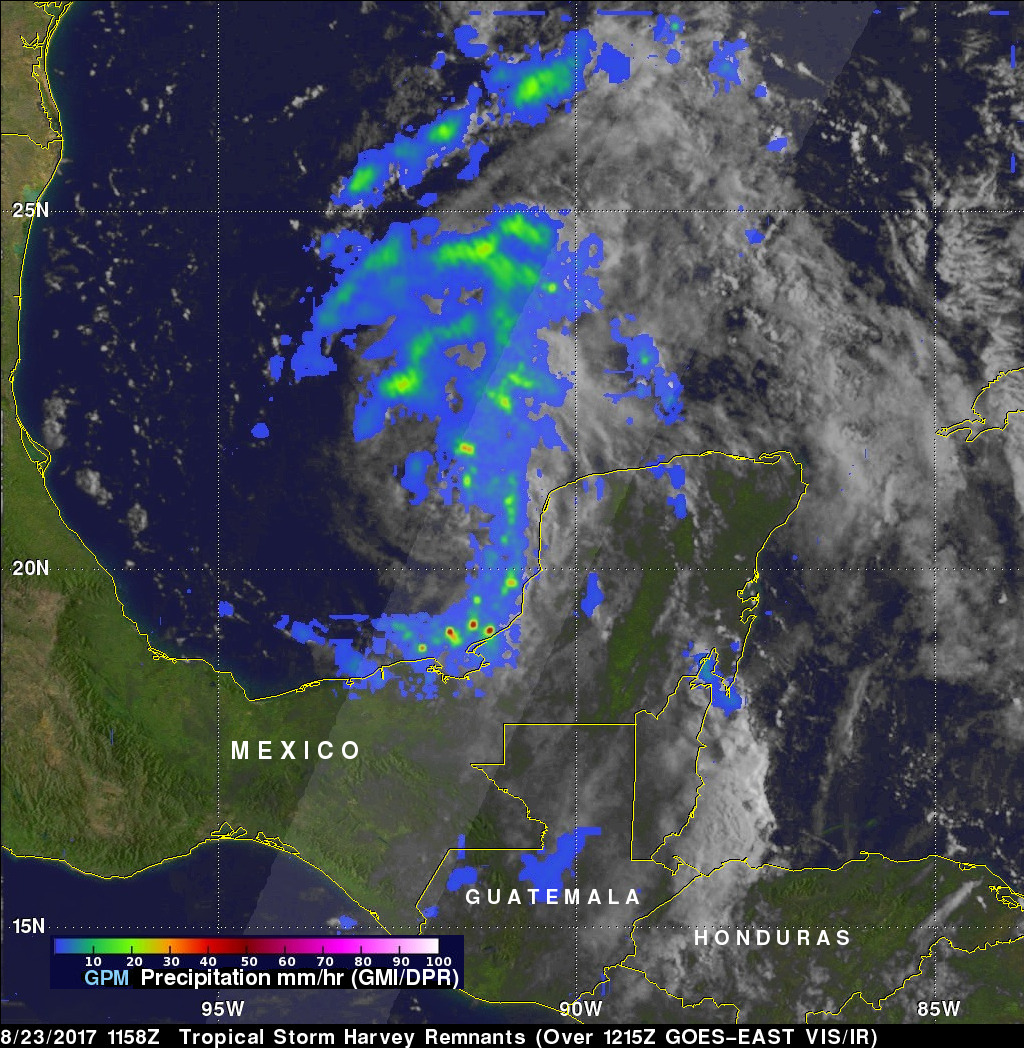
The previous day, NASA provided a look at Harvey’s intensifying rainfall. The Global Precipitation Measurement mission or GPM core observatory satellite flew over the regenerating tropical cyclone on Aug. 23 at 7:58 a.m. EDT (1158 UTC). Data collected by GPM’s Microwave Imager (GMI) and Dual-Frequency Precipitation Radar (DPR) instruments showed that Harvey’s remnants contained areas of moderate to heavy rainfall. A feeder band spiraling in from the southern side of the low contained rain falling at a rate of greater than 1.96 inches (50 mm) per hour. As Harvey intensifies its rainfall capacity can also increase.
GPM’s radar (DPR Ku band) data were used to create the rainfall structure of rainfall within regenerating tropical depression Harvey in 3-D. Those 3-D scans showed that storm tops with the feeder bands in the Bay of Campeche were reaching heights above 8.6 miles (13.9 km). GPM is a joint mission between NASA and the Japan Aerospace Exploration Agency, JAXA.
At NASA’s Goddard Space Flight Center in Greenbelt, Maryland, an animation was created using infrared and visible light data from NOAA’s GOES-East satellite imagery from August 22 to 24. The animation showed the movement of Harvey as a remnant low pressure area moving off the Yucatan Peninsula, re-forming into a tropical depression and now into a hurricane in the southwestern Gulf of Mexico.
NOAA manages the GOES series of satellites, and NASA uses the satellite data to create images and animations. The animation was created by the NASA/NOAA GOES Project at NASA’s Goddard Space Flight Center in Greenbelt, Maryland.
On Aug. 24, many warnings and watches were in effect: A Storm Surge Warning is in effect from Port Mansfield to San Luis Pass Texas. A Storm Surge Watch is in effect from south of Port Mansfield Texas to the mouth of the Rio Grande River and from north of San Luis Pass to High Island, Texas. A Hurricane Warning is in effect from Port Mansfield to Matagorda, Texas. A Tropical Storm Warning is in effect from north of Matagorda to High Island, Texas and south of Port Mansfield, Texas to the Mouth of the Rio Grande. A Hurricane Watch is in effect from south of Port Mansfield, Texas to the Mouth of the Rio Grande. A Tropical Storm Watch is in effect from south of the mouth of the Rio Grande to Boca de Catan, Mexico.
Credits: NASA/NOAA GOES Project
The heavy rainfall that the GPM core satellite observed continued to build, and on Aug. 24, the NHC noted that rainfall totals are expected to be tremendous. NHC said “Harvey is expected to produce total rain accumulations of 12 to 20 inches and isolated maximum amounts of 30 inches over the middle and upper Texas coast through next Wednesday. During the same time period Harvey is expected to produce total rain accumulations of 5 to 12 inches in far south Texas and the Texas Hill Country to central Louisiana, with accumulations of less than 5 inches extending into other parts of Texas and the lower Mississippi Valley. Rainfall from Harvey may cause life-threatening flooding.”
At 11 a.m. EDT (1500 UTC), the center of Tropical Storm Harvey was located by an Air Force Reserve Hurricane Hunter aircraft near 24.0 degrees north latitude and 93.3 degrees west longitude. That’s about 365 miles (590 km) southeast of Corpus Christi, Texas.
Data from the Hurricane Hunter plane indicate that maximum sustained winds have increased to near 65 mph (100 km/h) with higher gusts. Rapid strengthening is forecast, and Harvey is expected to become a major hurricane before it reaches the middle Texas coast. The minimum central pressure based on reconnaissance data is 982 millibars.
Harvey was moving toward the north-northwest near 10 mph (17 kph). The NHC forecast noted a turn toward the northwest is expected later today, and Harvey’s forward speed is forecast to slow down during the next couple of days. On the forecast track, Harvey will approach the middle Texas coast on Friday, Aug. 25 and make landfall Friday night or early Saturday, and then stall near the middle Texas coast through the weekend.
For updated forecasts from the NHC, visit: www.nhc.noaa.gov
Rob Gutro / Hal Pierce
NASA’s Goddard Space Flight Center
Aug. 23, 2017 – NASA Sees Tropical Depression Harvey’s Rebirth
NASA’s Aqua satellite provided an infrared look at the cloud top temperatures of newly reborn Tropical Depression Harvey.
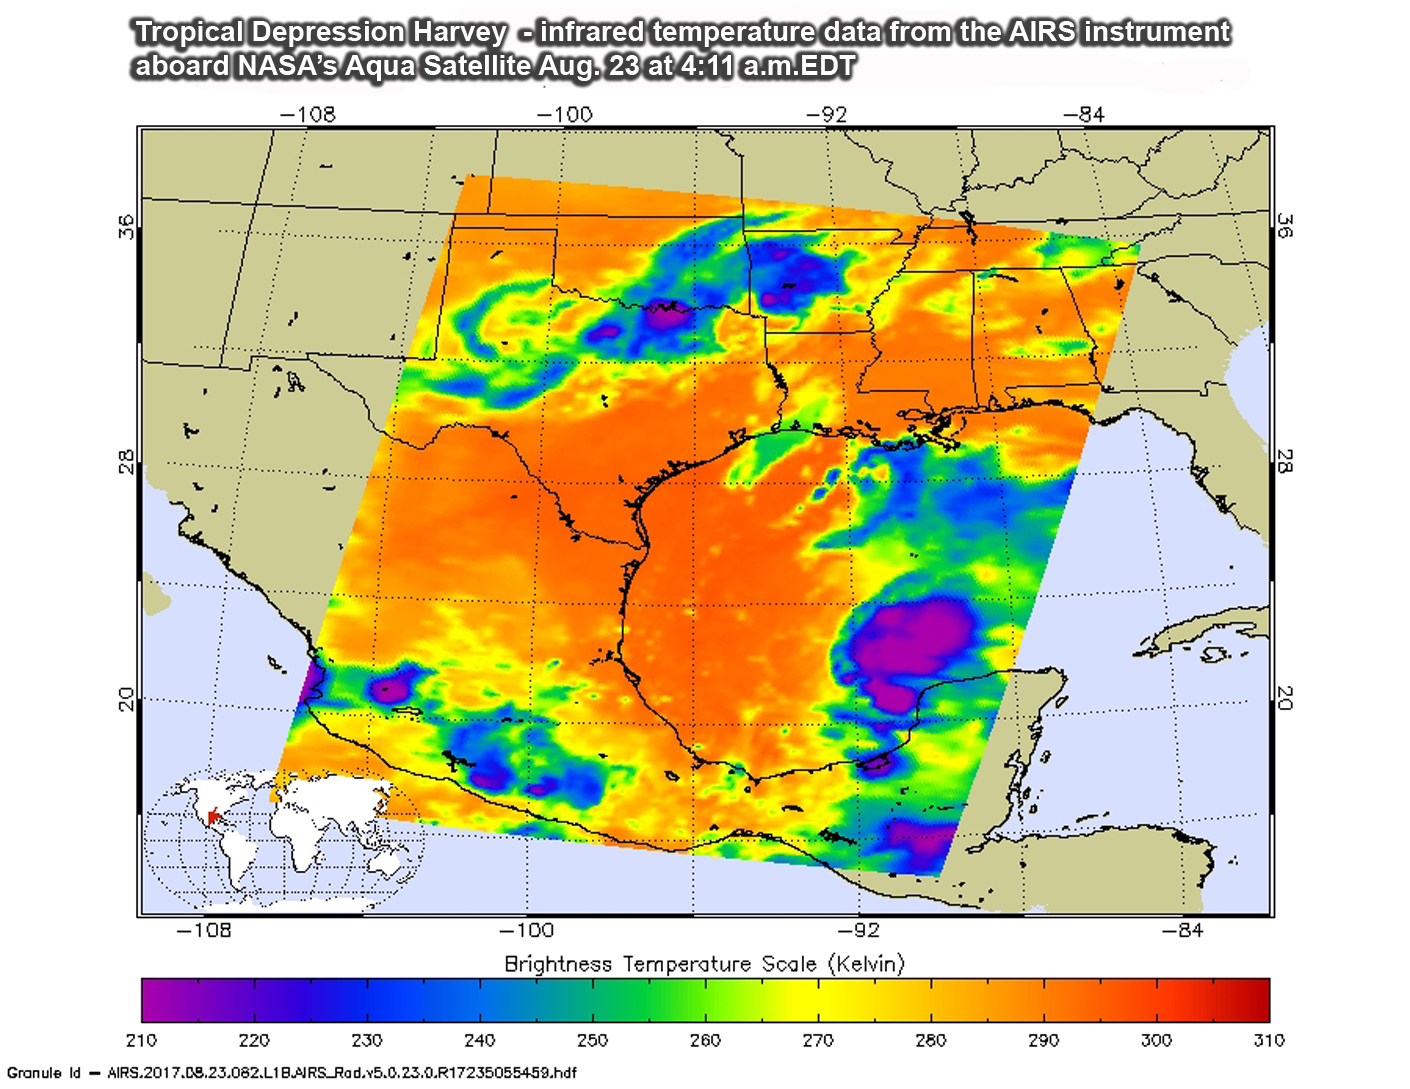
At 11 a.m. EDT on Aug. 23, Harvey regenerated into a tropical depression in the Gulf of Mexico. The National Hurricane Center issued hurricane and storm surge watches for portions of the Texas coast as Harvey is expected to strengthen.
A Storm Surge Watch has been issued for the coast of Texas from Port Mansfield to High Island. A Hurricane Watch has been issued for the coast of Texas from north of Port Mansfield to San Luis Pass. A Tropical Storm Watch has been issued for the coast of Texas from the Mouth of the Rio Grande to Port Mansfield and from north of San Luis Pass to High Island.
The Atmospheric Infrared Sounder or AIRS instrument that flies aboard NASA’s Aqua satellite analyzed Harvey in infrared light on Aug. 23 at 4:11 a.m. EDT (0811 UTC). AIRS data showed Harvey’s cloud pattern was still not well-organized and the cloud pattern is asymmetric. There were however, some strong thunderstorms within with very cold cloud top temperatures. Some of the coldest cloud top temperatures exceeded minus 63 degrees Fahrenheit (minus 53 degrees Celsius). Storms with temperatures that cold are high in the troposphere and NASA research has shown they have the ability to generate heavy rain.
That heavy rain is in the forecast for Texas and Louisiana, according to the National Hurricane Center (NHC). NHC noted “Harvey is expected to produce total rain accumulations of 10 to 15 inches with isolated maximum amounts of 20 inches over the middle and upper Texas coast and southwest Louisiana through next Tuesday, with heavy rainfall beginning as early as Friday morning, Aug. 25.”
The National Hurricane Center (NHC) noted at 11 a.m. EDT (1500 UTC), the center of Tropical Depression Harvey was located near 21.5 degrees north latitude and 92.5 degrees west longitude. That’s about 470 miles (755 km) southeast of Port Mansfield, Texas.
The depression was moving toward the northwest near 9 mph (15 kph) and a track toward the northwest or north-northwest is expected for the next 48 hours. On the forecast track, Harvey should be approaching the Texas coast late Friday, Aug. 25. Maximum sustained winds are near 35 mph (55 km/h) with higher gusts. Some strengthening is forecast during the next 48 hours, and Harvey could become a hurricane on Friday.
For updates on Harvey, storm surge and rainfall forecasts, visit the National Hurricane Center web page: www.nhc.noaa.gov
Rob Gutro
NASA’s Goddard Space Flight Center
Aug. 22, 2017 – NASA Infrared Image Shows Harvey’s Remnants Affecting Yucatan
NASA’s Aqua satellite provided an infrared look at the remnants of former Tropical Storm Harvey as it was affecting Mexico’s Yucatan Peninsula.
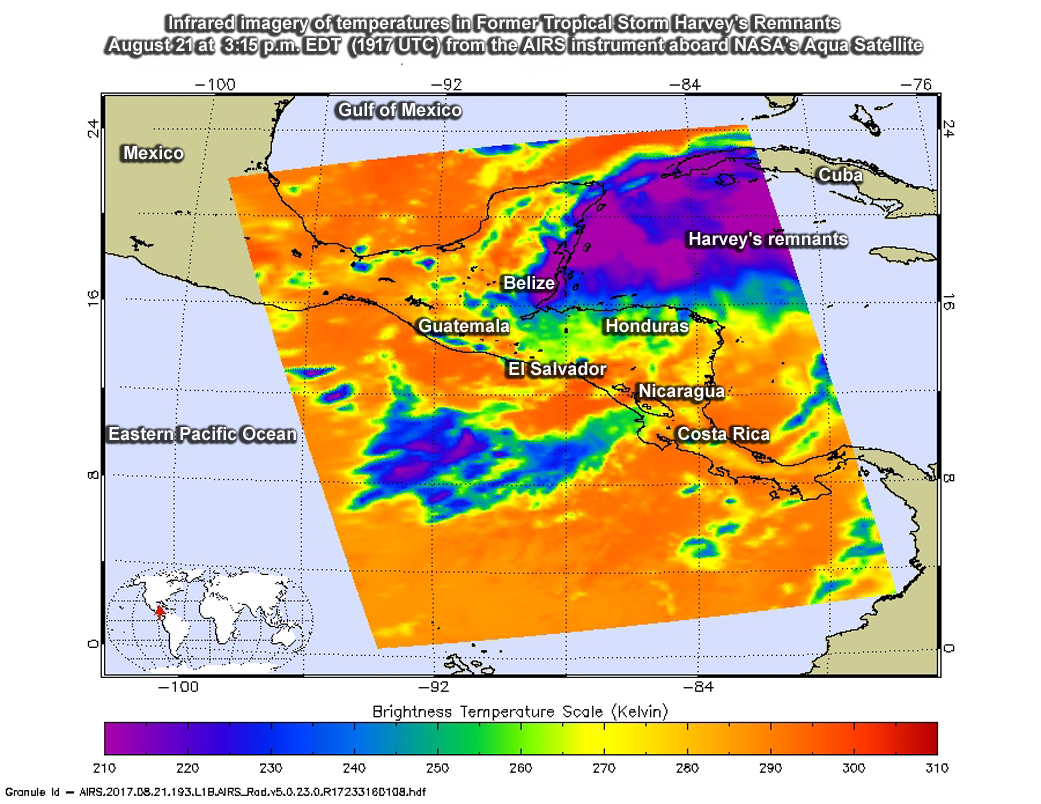
The Atmospheric Infrared Sounder or AIRS instrument aboard NASA’s Aqua satellite looked at cloud top temperatures in Harvey’s remnants using infrared light. The AIRS data were taken on August 21 at 3:15 p.m. EDT (1917 UTC). The image showed some very cold cloud top temperatures in thunderstorms over the eastern Yucatan Peninsula, Belize and western Caribbean Sea. Cloud top temperatures in those areas were as cold as minus 63 degrees Fahrenheit (minus 53 degrees Celsius). NASA research has shown that storms with cloud tops that cold are high up in the troposphere and can generate heavy rainfall.
The infrared data was false-colored at NASA’s Jet Propulsion Laboratory in Pasadena, California, where AIRS data is managed.
At 8 a.m. EDT (1200 UTC) on Aug. 22 the remnant storms associated with former Tropical Storm Harvey appeared disorganized over the Yucatan Peninsula and adjacent water areas.
The National Hurricane Center said “Environmental conditions are expected to be conducive for development when the system moves over the Bay of Campeche tonight, and a tropical depression is expected to form over the southwestern Gulf of Mexico on Wednesday, Aug. 23 or Thursday, Aug. 24.
NHC noted that regardless of development, locally heavy rainfall and gusty winds are expected to spread westward across Belize and the Yucatan Peninsula during the next day or so. The remnants have a high chance of reforming into a tropical cyclone over the next two to five days.
In addition, interests in northeastern Mexico and along the Texas coast should monitor the progress of this system.
For updates on Harvey’s remnants visit the NHC website: www.nhc.noaa.gov.
Rob Gutro
NASA’s Goddard Space Flight Center
Aug. 21, 2017 – Satellite Watches Remnants of Tropical Storm Harvey Near Honduras
NOAA’s GOES-East satellite has been watching the remnants for former Tropical Storm Harvey as it tracks west across the Caribbean Sea. Early on Aug. 21 the remnants were just off the coast of eastern Honduras.
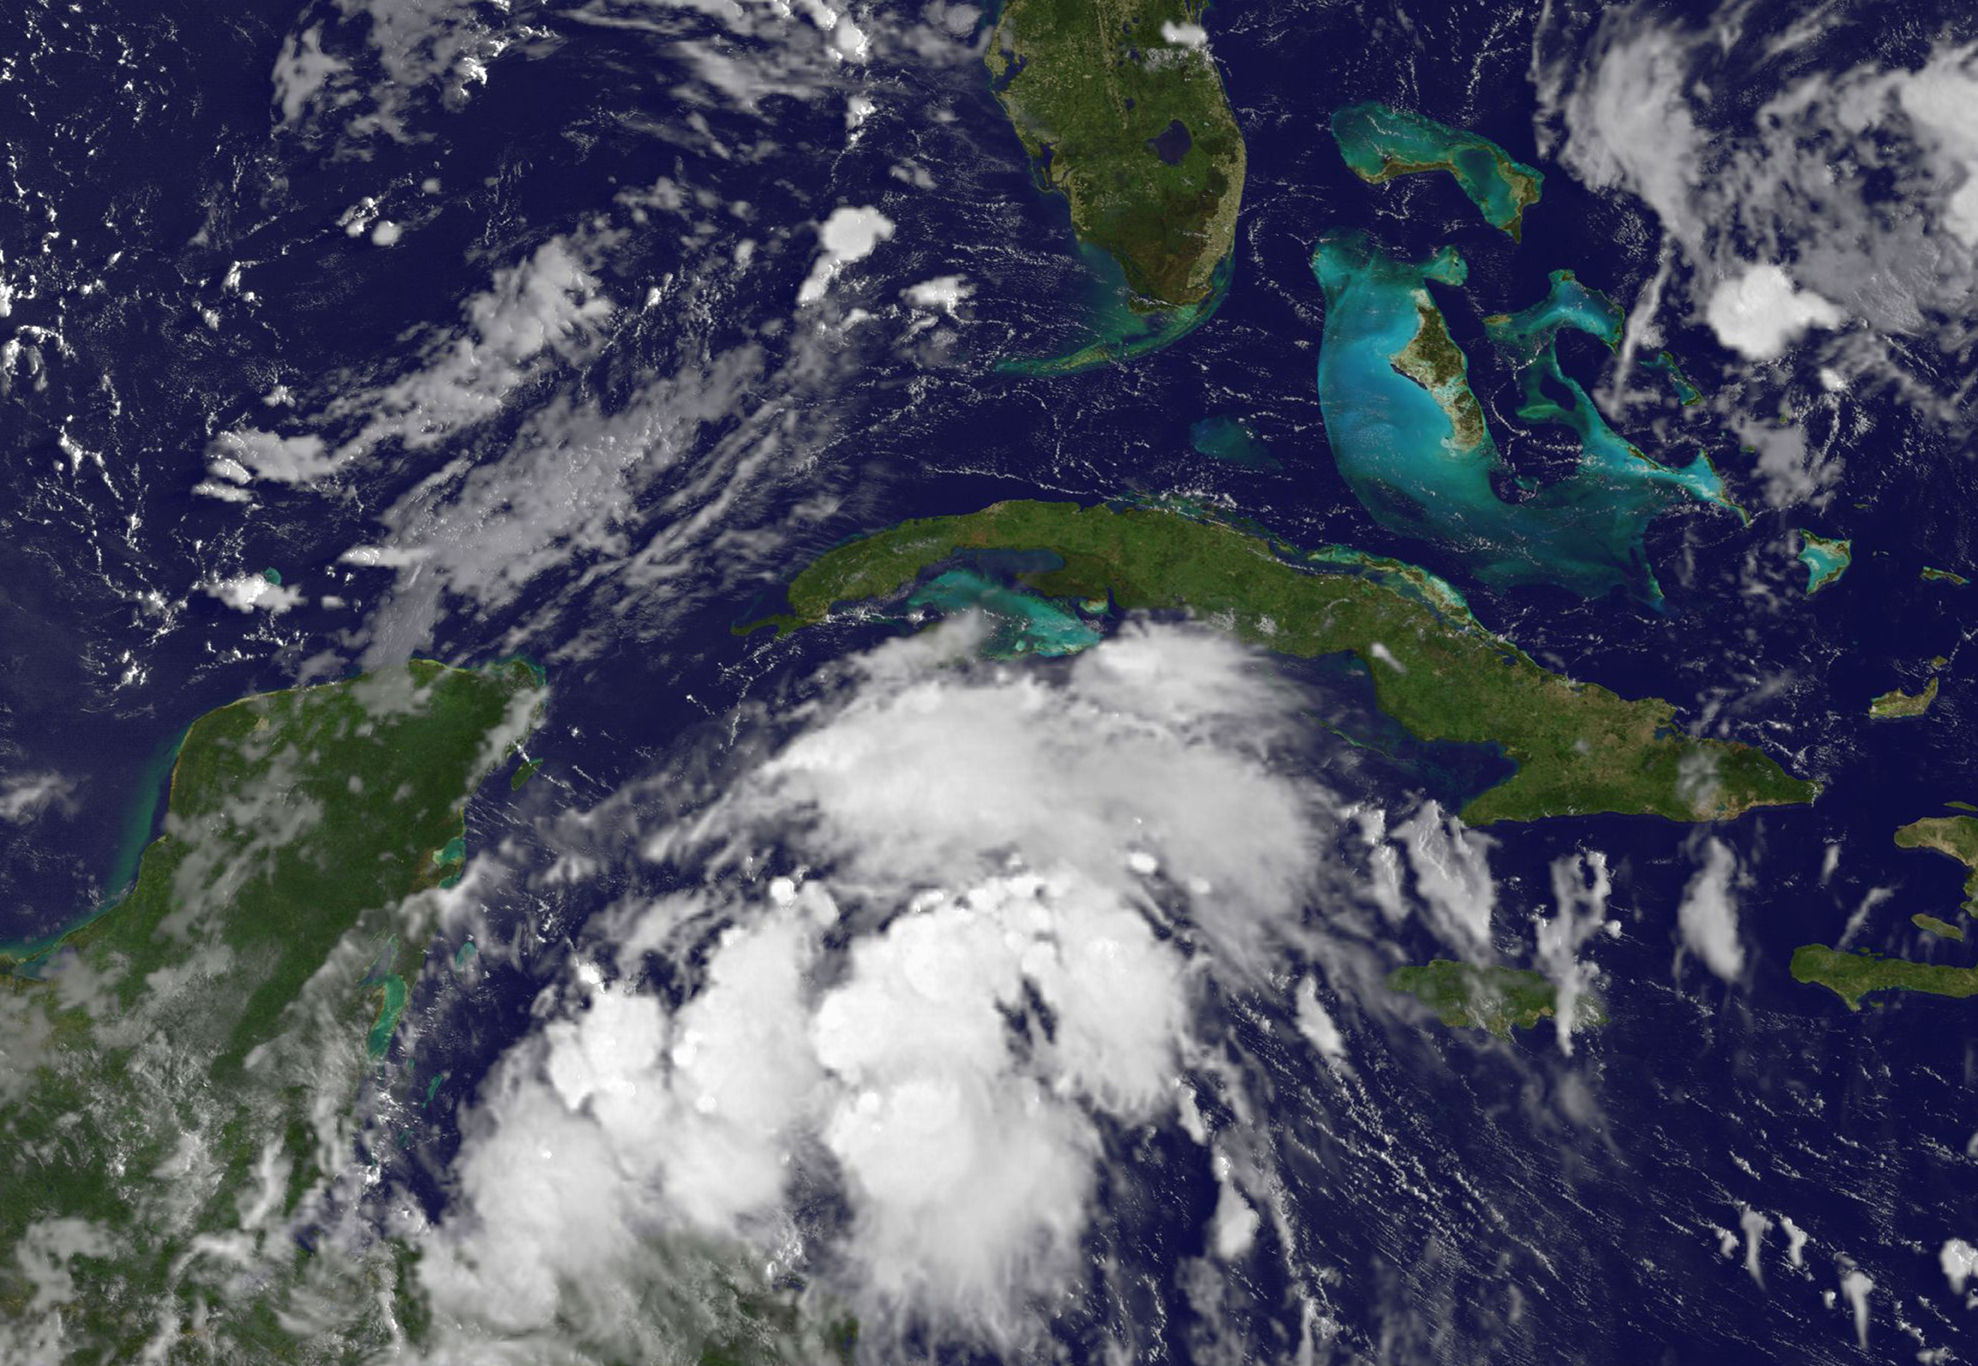
NOAA’s GOES-East satellite provided a visible-light image of the remnants in the western Caribbean Sea on Aug. 21 at 8:30 a.m. EDT (1230 UTC). The image revealed several areas of disorganized and fragmented thunderstorms. Harvey is an elongated area of low pressure, or a trough.
The NASA/NOAA GOES Project at NASA’s Goddard Space Flight Center in Greenbelt, Maryland created an image. NOAA manages the GOES series of satellites and the NASA/NOAA GOES Project creates images and animations from the data.
The National Hurricane Center (NHC) noted that regardless of development, locally heavy rainfall and gusty winds are likely to spread westward across northern Nicaragua, Honduras, Belize, and the Yucatan Peninsula during the next couple of days.
NHC noted that over the next two days, the remnants have a medium chance to re-form into a tropical cyclone, and over five days, that chance increases to a high chance. The disturbance is forecast to move into the Bay of Campeche early Wednesday, Aug. 23 where environmental conditions are expected to be more conducive for redevelopment.
For updates on Harvey’s remnants, visit: www.nhc.noaa.gov.
Rob Gutro
NASA’s Goddard Space Flight Center
Aug. 18, 2017 – NASA Looks at Rainfall in Tropical Storm Harvey
Tropical Storm Harvey is now moving into the eastern Caribbean Sea. NASA’s GPM core satellite examined the soaking rainfall the new tropical storm was generating along its path.
Credits: NASA/JAXA, Hal Pierce
The National Hurricane Center (NHC) upgraded a tropical disturbance that they were monitoring east of the Lesser Antilles to Tropical Storm Harvey on Aug. 17, 2017 at 5:00 p.m. EDT (2100 UTC).
The Global Precipitation Measurement mission or GPM core observatory satellite flew over newly designated Tropical Storm Harvey on Aug. 17 at 6:21 p.m. EDT (2221 UTC). Easterly vertical wind shear was causing the strongest convection to be pushed to the west of the tropical storm’s center of circulation.
GPM’s Microwave Imager and Dual-Frequency Precipitation Radar (DPR) found that some of these strong convective storms were dropping very heavy rainfall. DPR measured precipitation in one storm falling at a rate of almost 5.8 inches (147 mm) per hour. The GPM mission is a joint mission between NASA and the Japan Aerospace Exploration Agency.
Using GPM’s radar (DPR Ku Band) Maryland a 3-D view of the rainfall structure was created at NASA’s Goddard Space Flight Center in Greenbelt, Md. The 3-D image showed powerful convective storms west of Harvey’s center of circulation reaching altitudes above 9.8 miles (15.8 km).
By 2 p.m. EDT on Aug. 18 Harvey was moving west and away from the Leeward Islands. Tropical Storm Warnings have been dropped for Martinique, Barbados, St. Vincent, the Grenadines and St. Lucia. The Tropical Storm Watch has been dropped for Dominica.
Despite the warnings and watches being dropped, the National Hurricane Center said that Harvey is expected to produce additional rainfall totals of 1 to 2 inches with locally higher amounts across parts of the Leeward and Windward Islands from Guadeloupe southward to Grenada.
At 2 p.m. EDT (1800 UTC), the center of Tropical Storm Harvey was located near 13.2 degrees north latitude and 62.1 degrees west longitude. That’s just 60 miles (95 km) west of St. Vincent and 85 miles (135 km) west-southwest of St. Lucia.
Harvey was moving toward the west near 21 mph (33 kph) and this general motion is expected to continue for the next couple of days. Maximum sustained winds are near 40 mph (65 kph) with higher gusts. Slow strengthening is forecast during the next 48 hours.
On the forecast track, the center of Harvey should move into the central Caribbean Sea on Saturday, Aug 19.
For updated forecasts on Tropical Storm Harvey, visit: www.nhc.noaa.gov.
Hal Pierce/Rob Gutro
NASA’s Goddard Space Flight Center
Aug. 17, 2017 – NASA Sees Potential Tropical Depression 9 Form East of Lesser Antilles
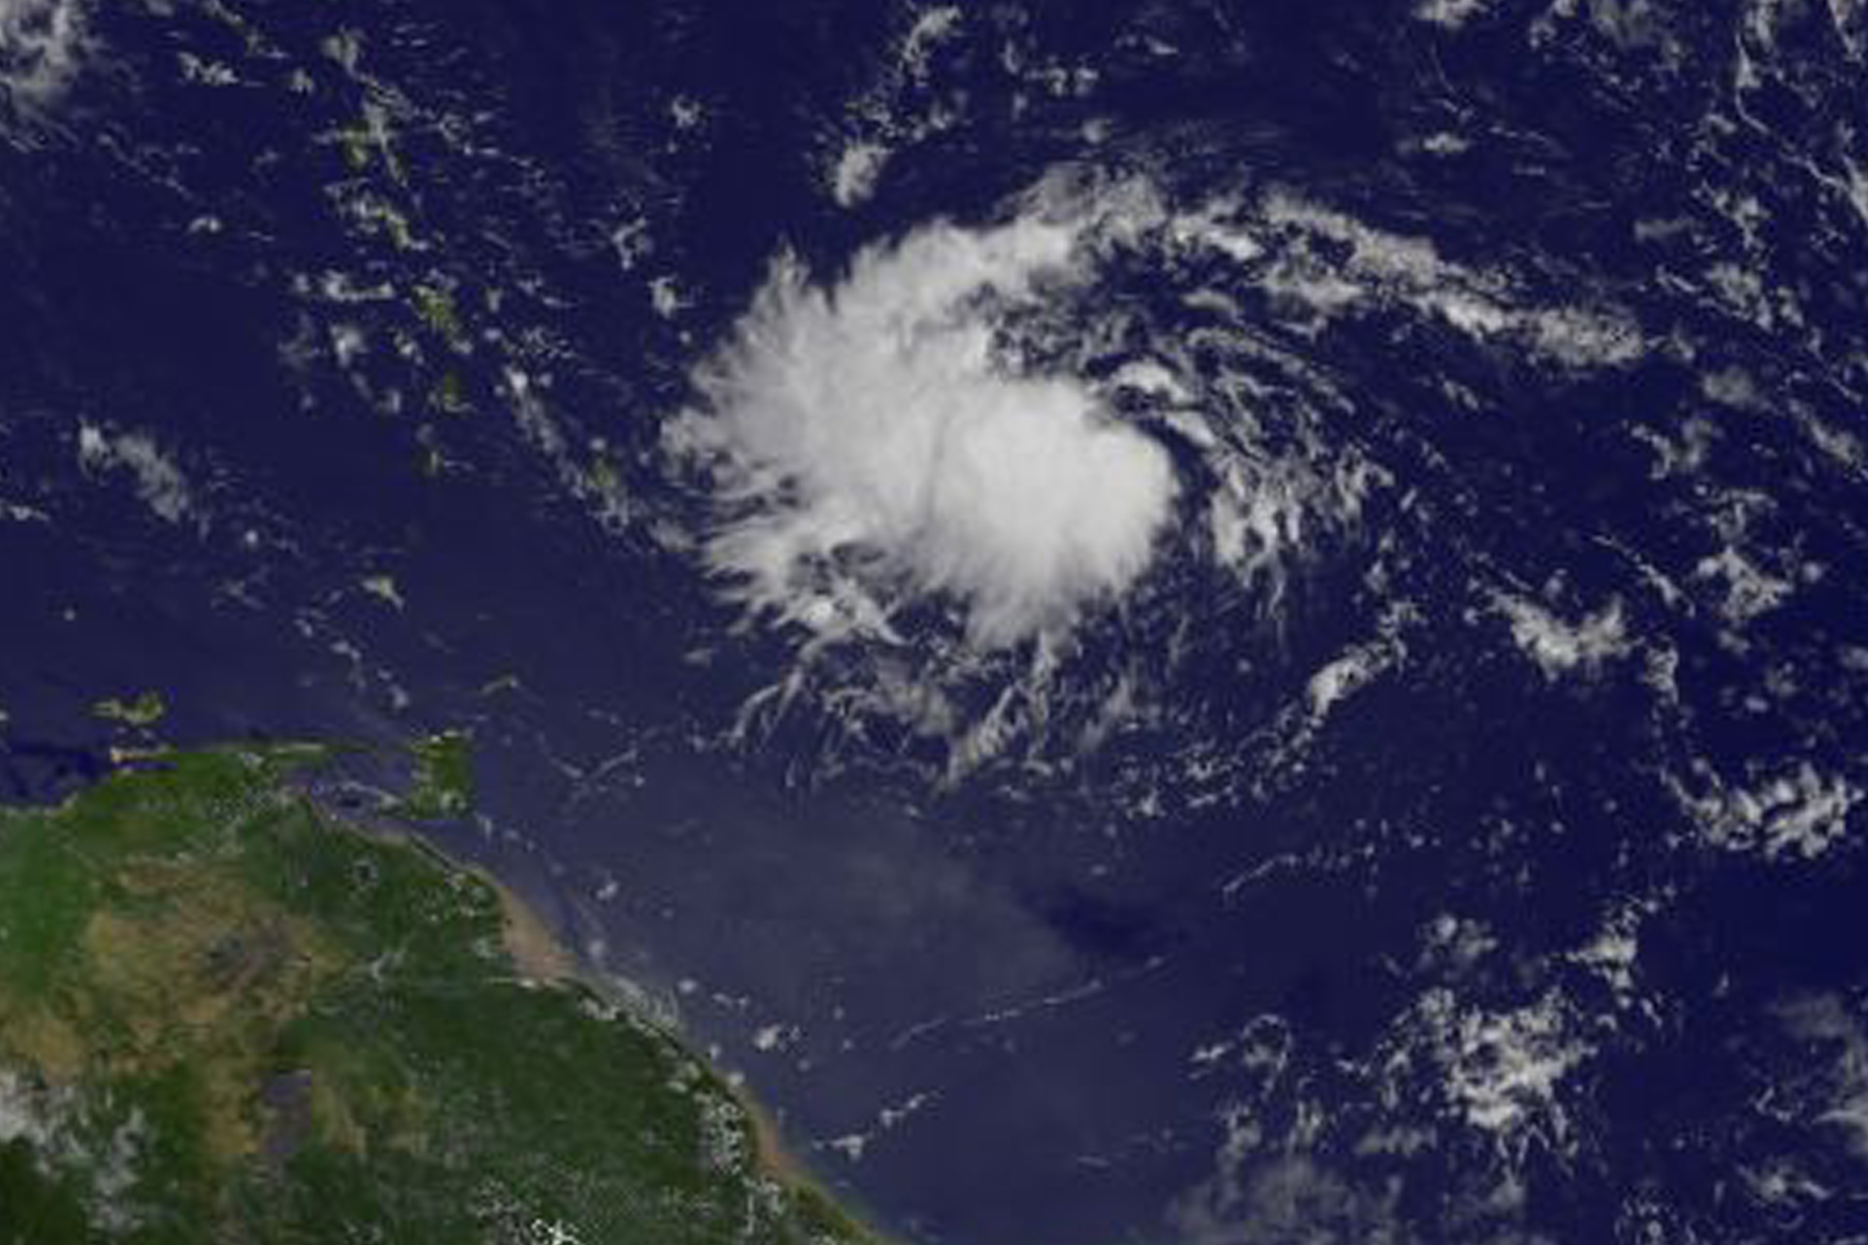
NOAA’s GOES-East Satellite spotted potential Tropical Depression 9 organizing east of the Lesser Antilles.
At 10:45 a.m. EDT (1445 UTC) on Aug. 13 NOAA’s GOES-East satellite captured a visible image of potential Tropical Depression 9. The satellite imagery showed the circulation of the low pressure area was becoming better defined and that a cluster of strong convection has formed west of the center.
NOAA manages the GOES series of satellites, and NASA uses the satellite data to create images and animations. The image was created by the NASA/NOAA GOES Project at NASA’s Goddard Space Flight Center in Greenbelt, Maryland.
The potential Tropical Depression Nine (TD9) formed around 11 p.m. EDT on Aug. 17 about 365 miles east of the Barbados and 465 miles (750 km) east of St. Lucia.
The National Hurricane Center (NHC) issued a Tropical Storm Warning for Martinique, St. Lucia, Barbados, St. Vincent and the Grenadines. A Tropical Storm Watch is in effect for Dominica. Tropical storm conditions are expected to first reach the Lesser Antilles within the warning area by early Friday, Aug. 18.
At 11 a.m. EDT (1500 UTC), the disturbance was centered near 13.1 degrees north latitude and 54.1 degrees west longitude. The system was moving toward the west near 17 mph (28 kph) and this motion is expected to continue for the next couple of days. On the forecast track, the disturbance should move through the Windward Islands and into the eastern Caribbean Sea on Aug. 18. Maximum sustained winds are near 35 mph (55 kph) with higher gusts.
The NHC noted that the depression is expected to become a tropical storm before reaching the Windward Islands.
The depression is expected to bring heavy rainfall across portions of the Windward Islands from Martinique southward to Grenada with totals between 2 and 4 inches expected. These rains could cause life-threatening flash floods and mudslides.
For forecast updates on potential Tropical Depression 9, visit: www.nhc.noaa.gov.
Rob Gutro
NASA’s Goddard Space Flight Center, Greenbelt, Md.