


Update #2 – Danny the “Degenerate” Followed by Two Lows
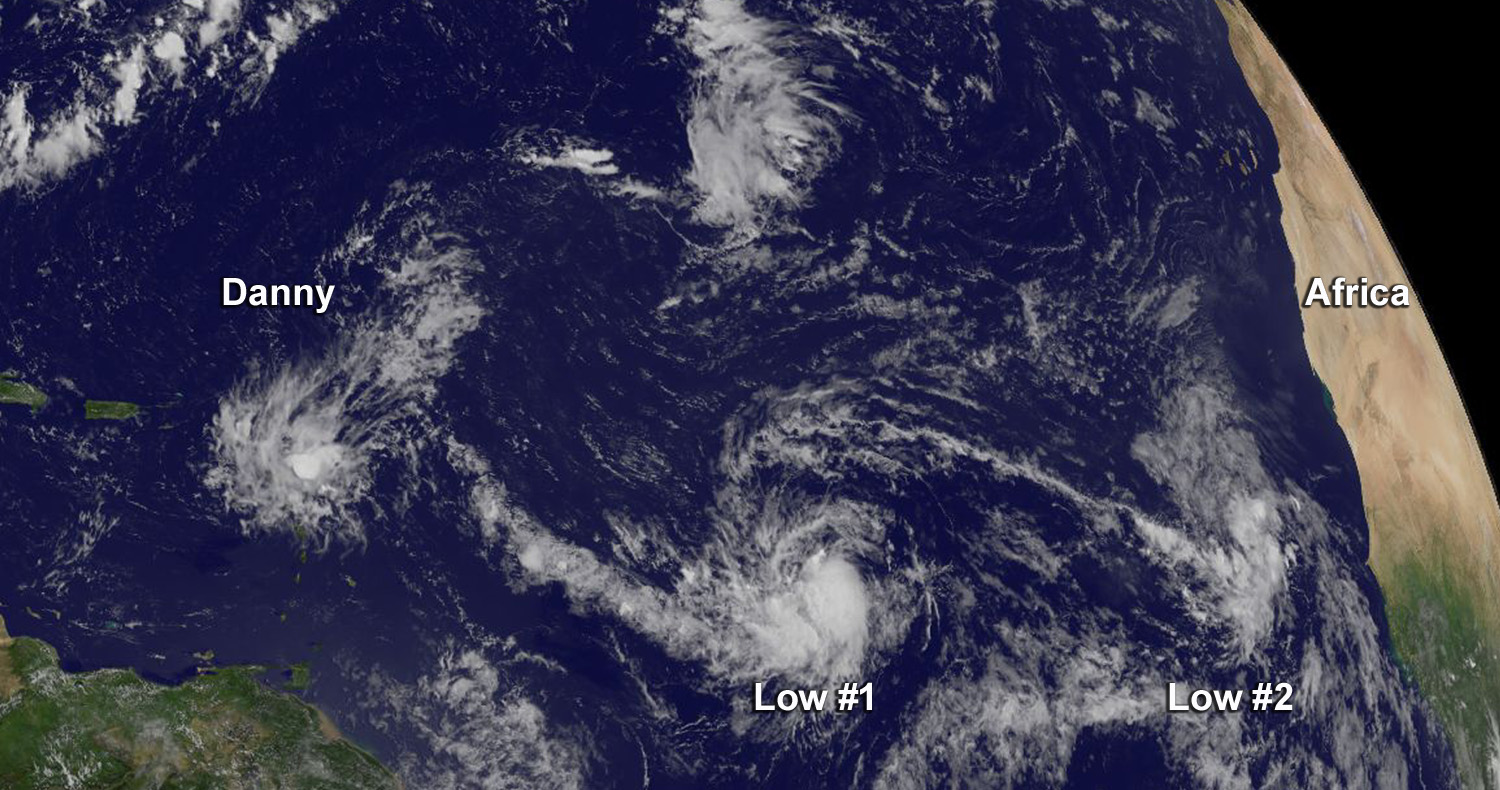
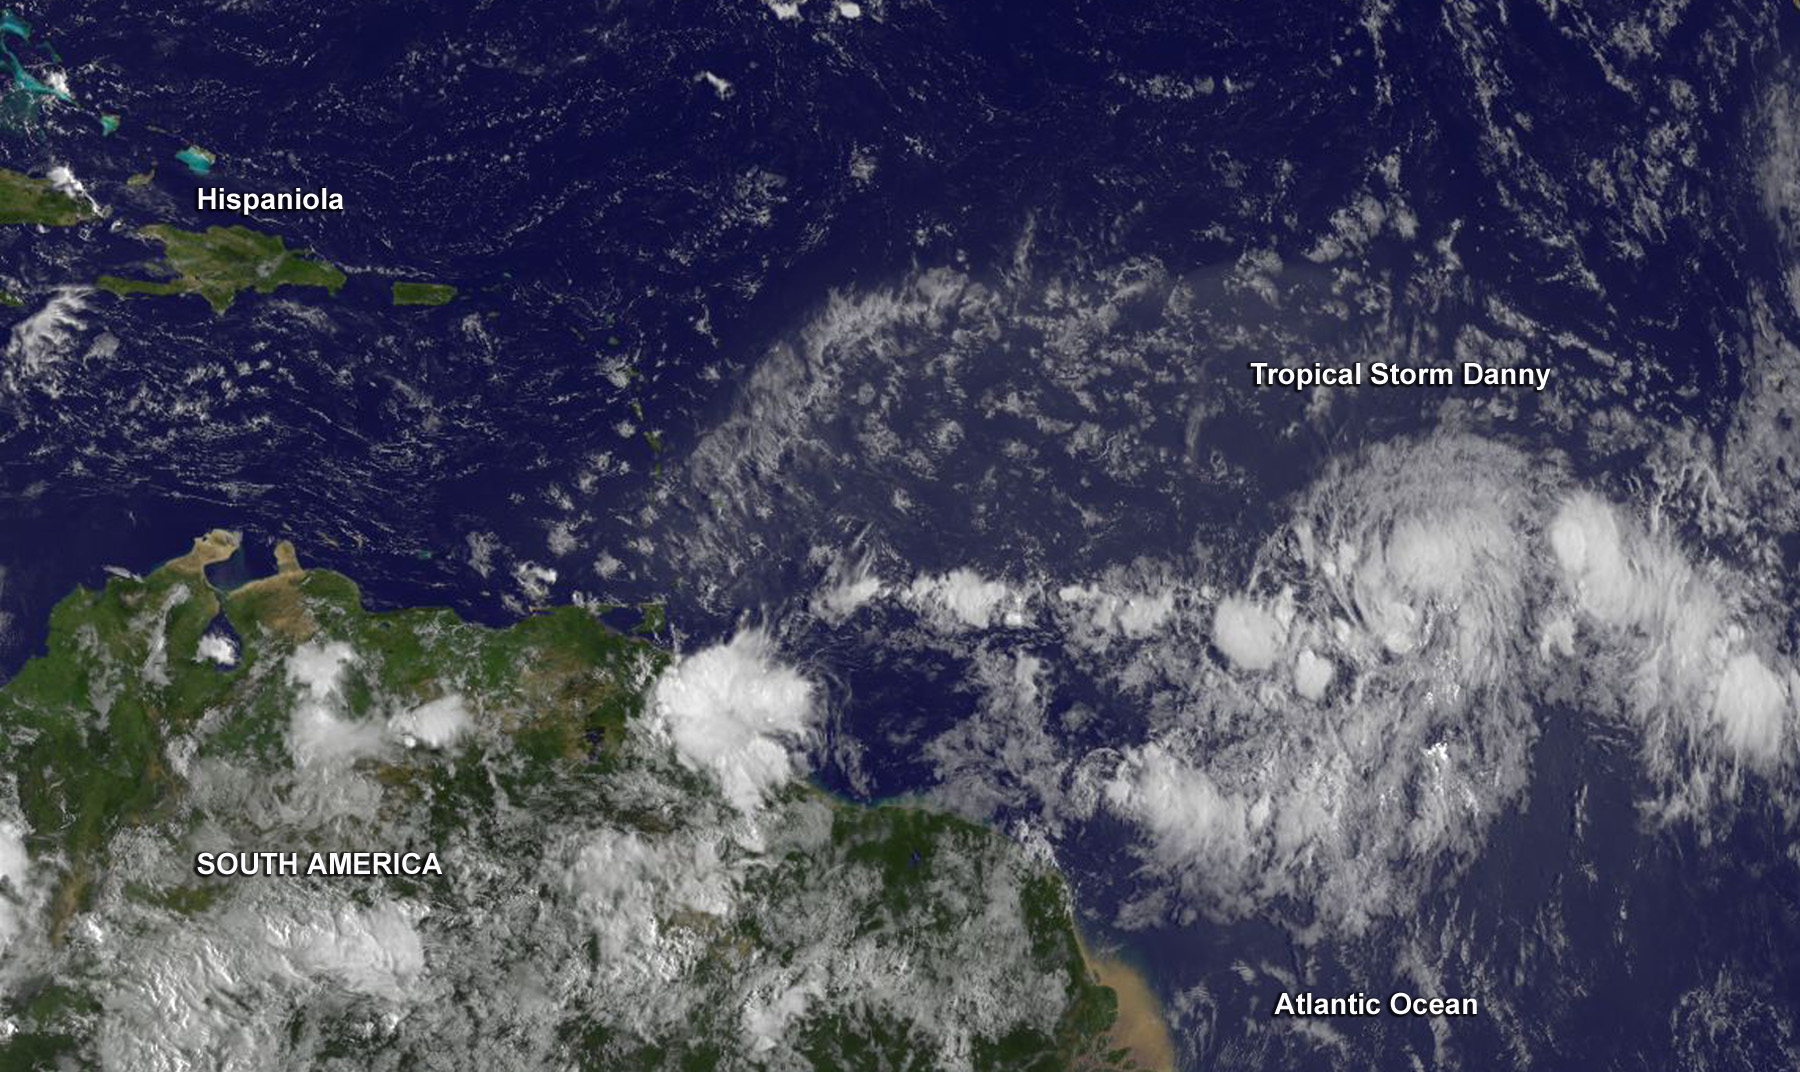
Danny has become a degenerate, that is, the tropical depression weakened. Satellite and Hurricane Hunter aircraft data showed that Danny degenerated into an elongated area of low pressure near the Windward Islands during the afternoon (local time) on August 24. Meanwhile two other developing low pressure areas lie to the east of Danny.
Satellite data from NOAA’s GOES-East satellite at 14:45 UTC (10:45 a.m. EDT) on August 24, showed Danny had become stretched out into a trough of low pressure. At 11 a.m. EDT (1500 UTC), the remnants of Danny were located near latitude 16.0 North and longitude 62.0 West. The remnants are moving toward the west near 12 mph (19 kph), and this general motion is expected to continue for the next day or two. Maximum sustained winds have decreased near 30 mph (45 kph).
The National Hurricane Center said that the remnants of Danny are expected to produce 2 to 4inches of rain over the Leeward Islands, the U.S. and British Virgin Islands, Puerto Rico, and the Dominican Republic through Tuesday night, August 25.
The trough is expected to dissipate during the next couple of days.
Shower and thunderstorm activity associated with low pressure system closest to Danny’s remnants were located about 950 miles east of the Lesser Antilles. That low pressure area appears ripe for development and the National Hurricane Center (NHC) noted that the system is likely to become a tropical depression or a tropical storm during the next day or so while it moves westward near 20 mph.
The second low pressure area is associated with a tropical wave far in the eastern Atlantic Ocean. That low is located near the Cape Verde Islands is accompanied by disorganized showers and thunderstorms. However, the NHC noted that environmental conditions are not expected to be conducive for significant development of this system while it moves westward at 15 to 20 mph over the next few days.
Rob Gutro
NASA’s Goddard Space Flight Center
Aug. 24, 2015 – Update #1 – NASA Sees Tropical Depression Danny Affecting Leeward Islands
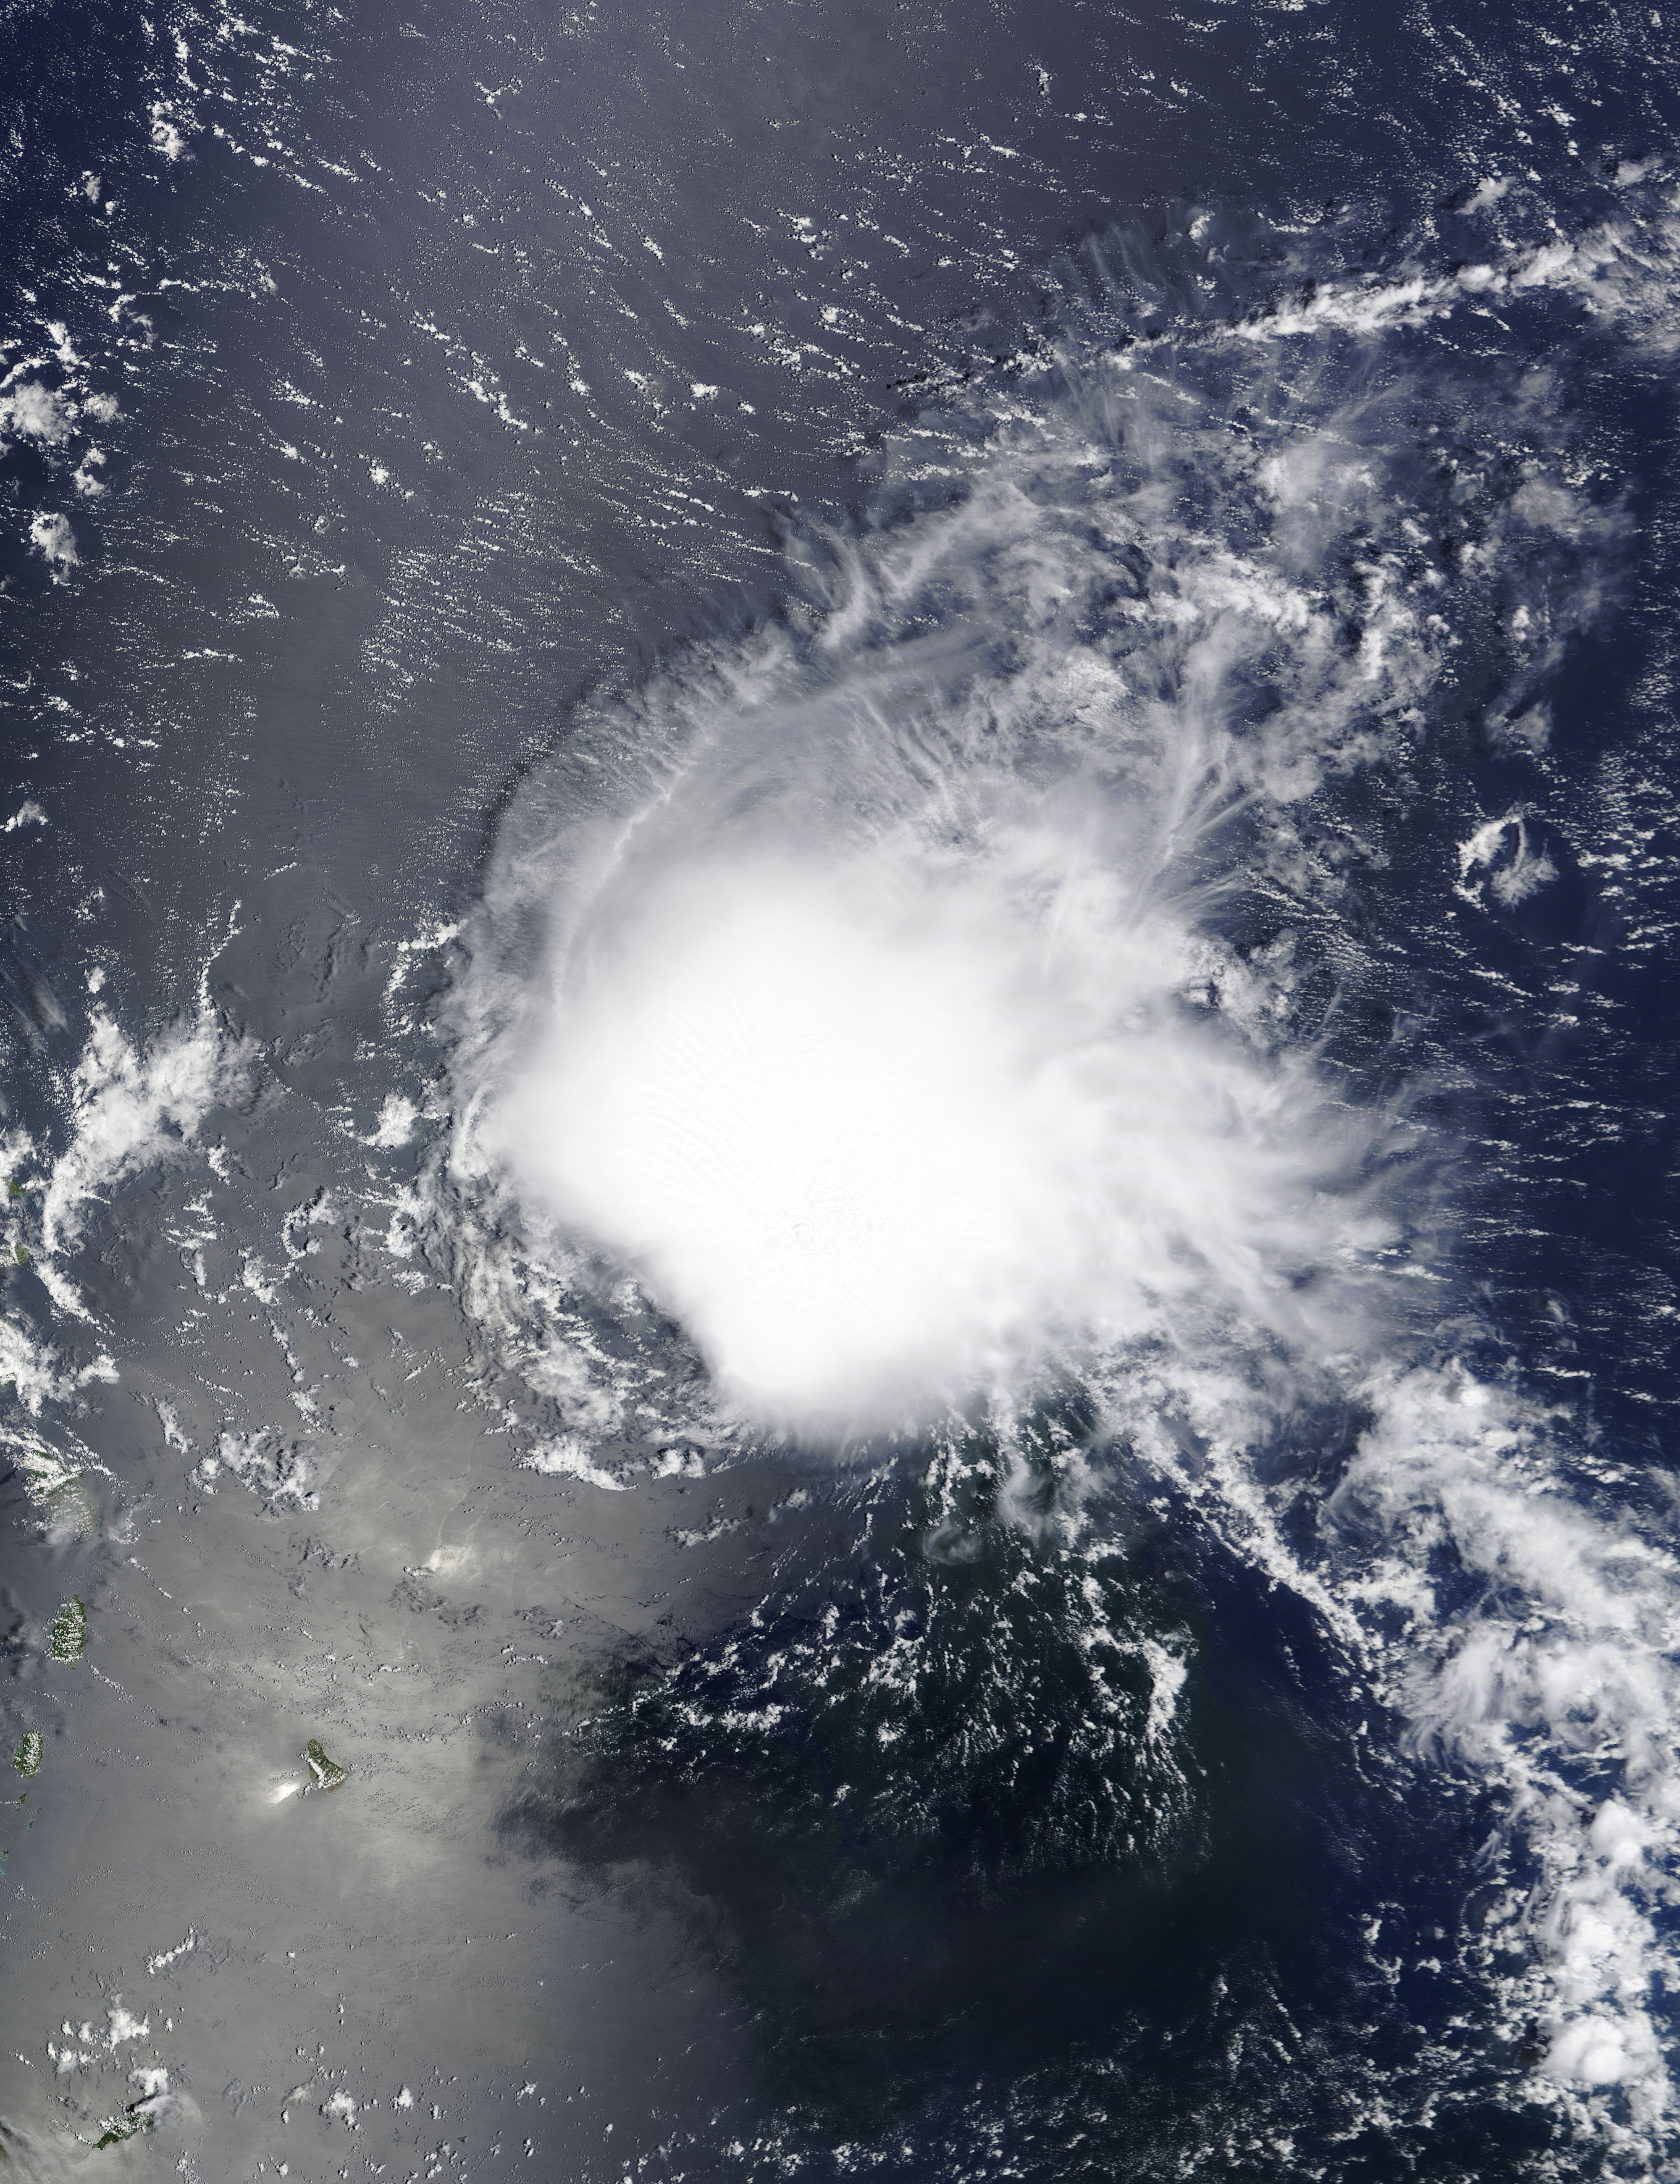
Tropical Depression Danny was already affecting the Leeward Islands when NASA’s Terra satellite passed overhead.
The National Hurricane Center noted on August 24, that Danny is expected to produce 2 to 4 inches of rain over the Leeward Islands, the U.S. and British Virgin Islands, and Puerto Rico through Tuesday, August 25.
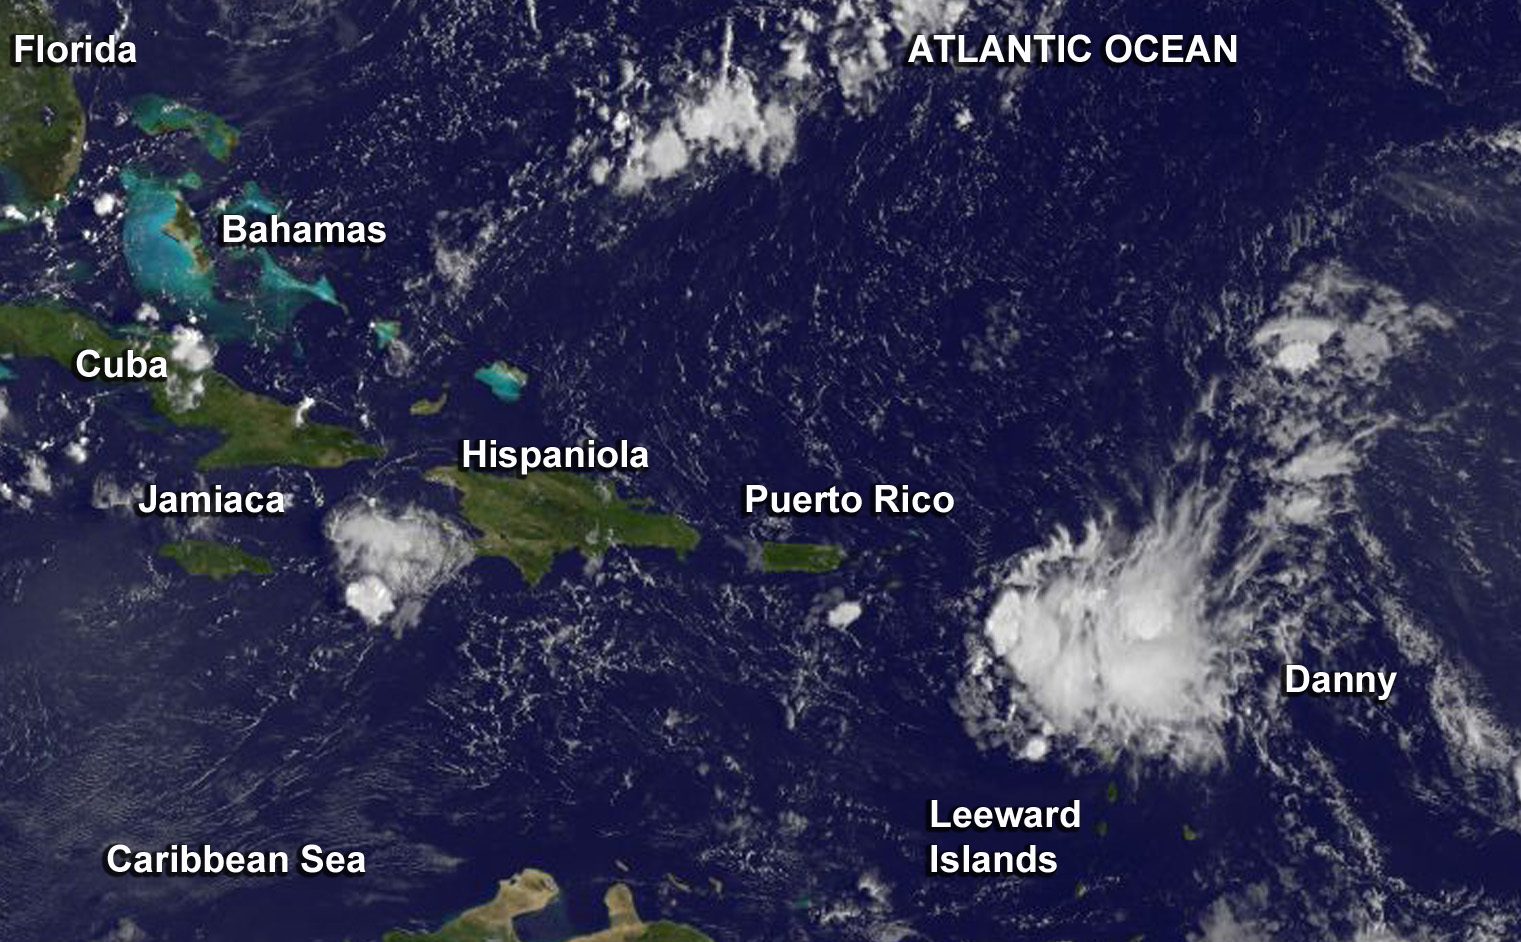
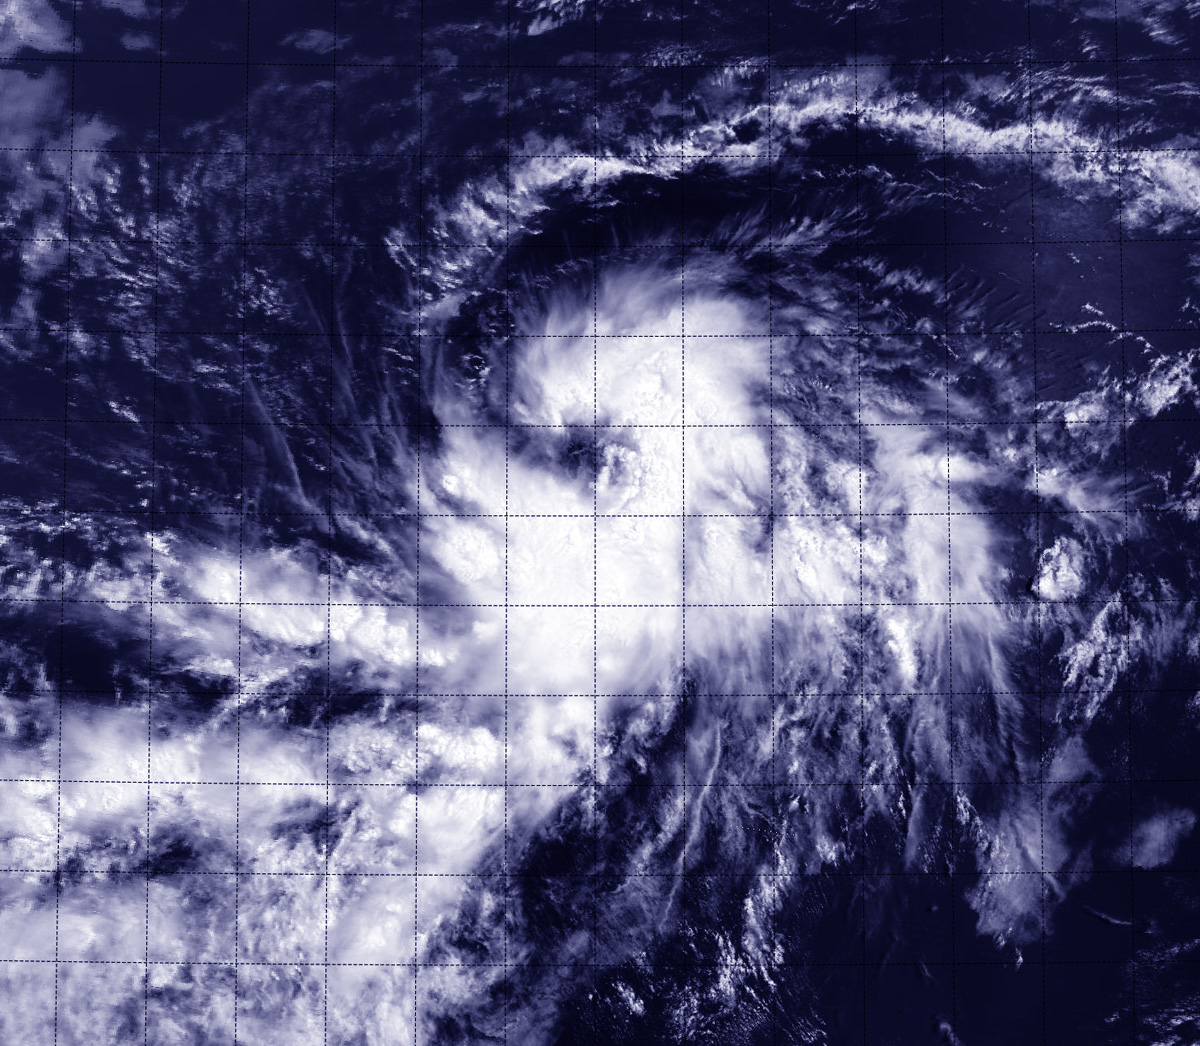
NASA’s Terra satellite flew over Danny on August 23 at 14:45 UTC (10:45 a.m. EDT) as it neared the Leeward Islands. The MODIS instrument aboard captured a visible image of the storm when it was still a tropical storm and it still appeared circular. However, the circulation became less apparent in satellite imagery on August 24.
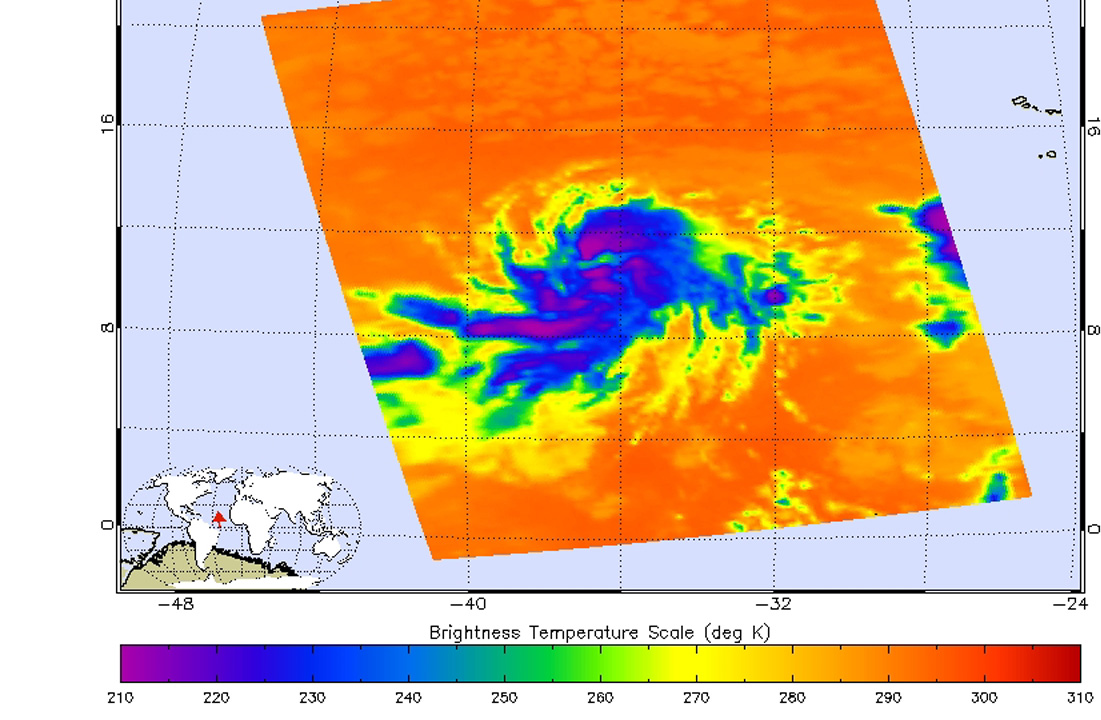
On August 24, NHC reported a strong burst of deep convection (rising air that forms the thunderstorms that make up a tropical cyclone) with cloud top temperatures of -80 degrees Celsius (-112 Fahrenheit) and intense lightning activity that has developed near the alleged center. Infrared instruments, such as the Atmospheric Infrared Sounder that flies aboard NASA’s Aqua satellite provide temperature measurements. Cloud top temperatures that high indicate very high, strong thunderstorms with the capability to generate heavy rainfall.
NOAA’s GOES-East satellite captured this visible image of Tropical Depression Danny on August 24, 2015 at 11:45 UTC (7:45 a.m. EDT) when it was just 20 miles south of Guadeloupe. The center of Danny’s circulation was difficult to pinpoint in the visible GOES image and the storm appeared less circular than it did on the previous day’s MODIS image.
At 8 a.m. EDT (1200 UTC) on August 24, Danny had weakened to a depression. The center of Tropical Storm Danny was located near latitude 15.9 North, longitude 61.5 West. That’s about 20 miles (30 km) south of Guadeloupe. Danny was moving toward the west near 12 mph (19 kph). Maximum sustained winds had decreased to near 35 mph (55 kph) and NHC forecasts further weakening during the next two days. The estimated minimum central pressure is 1009 millibars.
According to NHC, Danny is now encountering west-northwesterly mid-level wind shear. The subtropical ridge (an elongated area of high pressure moving counter clockwise) located to the north of Danny is expected to remain strong for the next few days, which should force Danny on a westward to west-northwestward track until the system dissipates in about 72 hours.
Rob Gutro
NASA’s Goddard Space Flight Center
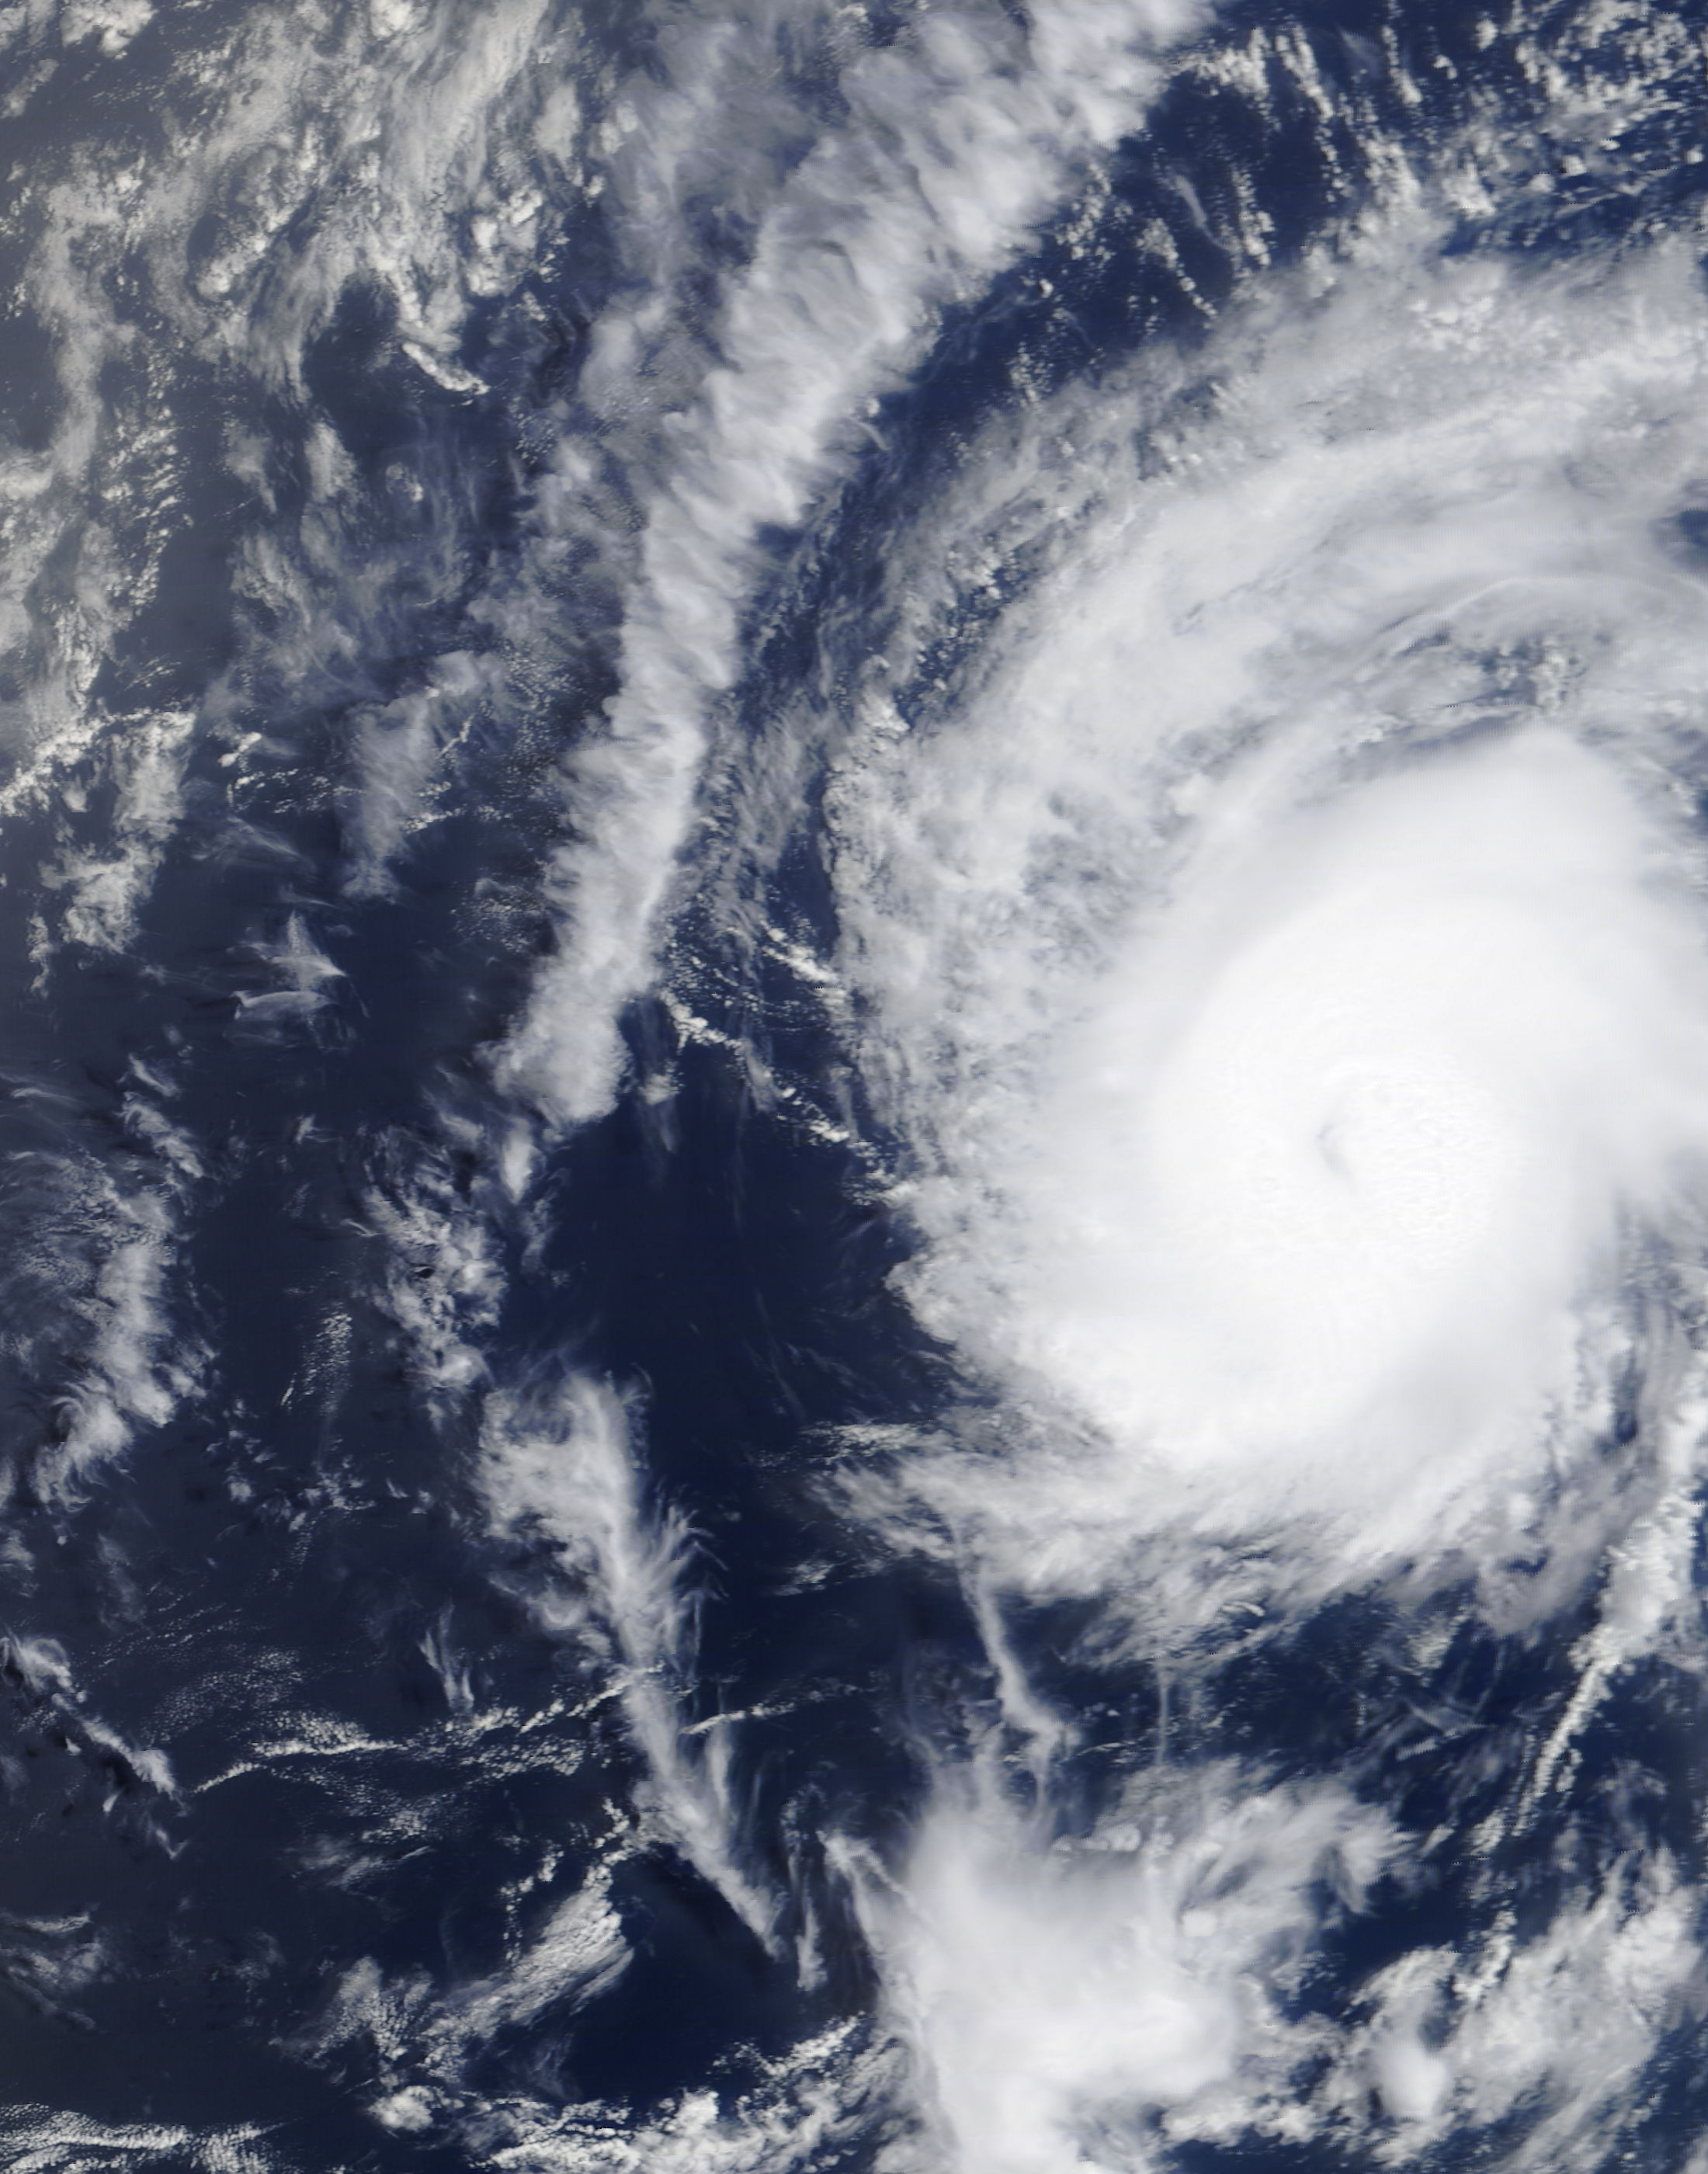
Aug. 21, 2015 – NASA Sees Diminutive Hurricane Danny from Space

Astronauts aboard the International Space Station captured an image of Hurricane Danny moving through the Central Atlantic Ocean. Satellite data indicates that Danny is a small Category 2 hurricane, in which hurricane-force winds only extend 15 miles from the eye.
A NASA GOES Project animation of visible and infrared imagery of Hurricane Danny was created at NASA’s Goddard Space Flight Center in Greenbelt, Maryland to show the development and movement of the storm. The animation shows the eastern and central Atlantic Ocean from Aug. 18 to 21, 2015.
Forecaster Cangialosi of the National Hurricane Center noted that the eye of the compact hurricane has become more distinct recently and the cloud tops have cooled in the eyewall. Infrared data, such as that gathered by the Atmospheric Infrared Sounder (AIRS) instrument that flies aboard NASA’s Aqua satellite is used to determine cloud top temperature. The colder the cloud tops, the higher they are in the atmosphere, and they are usually stronger.
At 11 a.m. EDT (1500 UTC) on August 21, the eye of Hurricane Danny was located near latitude 14.0 North, longitude 48.2 West. That puts the center of Danny about 930 miles (1,195 km) east of the Leeward Islands. Maximum sustained winds have increased to near 105 mph (165 kph), making Danny a Category 2 hurricane on the Saffir-Simpson Hurricane Wind Scale. The estimated minimum central pressure is 976 millibars.
Credits: NASA/NOAA GOES Project
Satellite data shows that hurricane force winds extend outward up to 15 miles (30 km) from the center and tropical storm force winds extend outward up to 70 miles (110 km).
Danny is moving toward the west-northwest near 10 mph (17 kph), and this general motion is expected to continue during the next day or so.
On August 22, Danny is expected to move into an area of increased southwesterly shear and drier air. These factors should induce a weakening trend. The National Hurricane Center (NHC) expects Danny to weaken below hurricane strength as it approaches the Caribbean islands.
Rob Gutro
NASA’s Goddard Space Flight Center
Aug. 20, 2015, Second Update – NASA Sees Danny Become the 2015 Atlantic Season’s First Hurricane
NASA’s Terra satellite passed over the Atlantic Ocean as Tropical Storm Danny intensified into the season’s first hurricane.
The Moderate Resolution Imaging Spectroradiometer, or MODIS, instrument that flies aboard NASA’s Terra satellite flew over Danny at 10:15 a.m. EDT (14:15 UTC) on Aug. 20, just as it was classified as the 2015 Atlantic Ocean Season’s first hurricane. The MODIS image showed that Danny is a small tropical cyclone.
Hurricane-force winds only extend outward up to 10 miles (20 km) from the center and tropical-storm-force winds extend outward up to 60 miles (95 km).
At 11 a.m. EDT (1500 UTC), the center of the eye of Hurricane Danny was located by satellite near latitude 12.5 North and longitude 44.8 West. That puts the center of Danny about 1,090 miles (1,755 km) east of the Windward Islands. The National Hurricane Center noted that Danny is moving toward the west-northwest near 12 mph (19 kph) and this general motion is expected to continue for the next couple of days. Danny’s maximum sustained winds had increased to near 75 mph (120 kph) with higher gusts.
The NHC forecast noted that some additional strengthening is forecast during the next two days.
Rob Gutro
NASA’s Goddard Space Flight Center, Greenbelt, Md.
Aug. 20, 2015, First Update – NASA’s GPM Satellite Analyzes Tropical Storm Danny’s Rain Structure
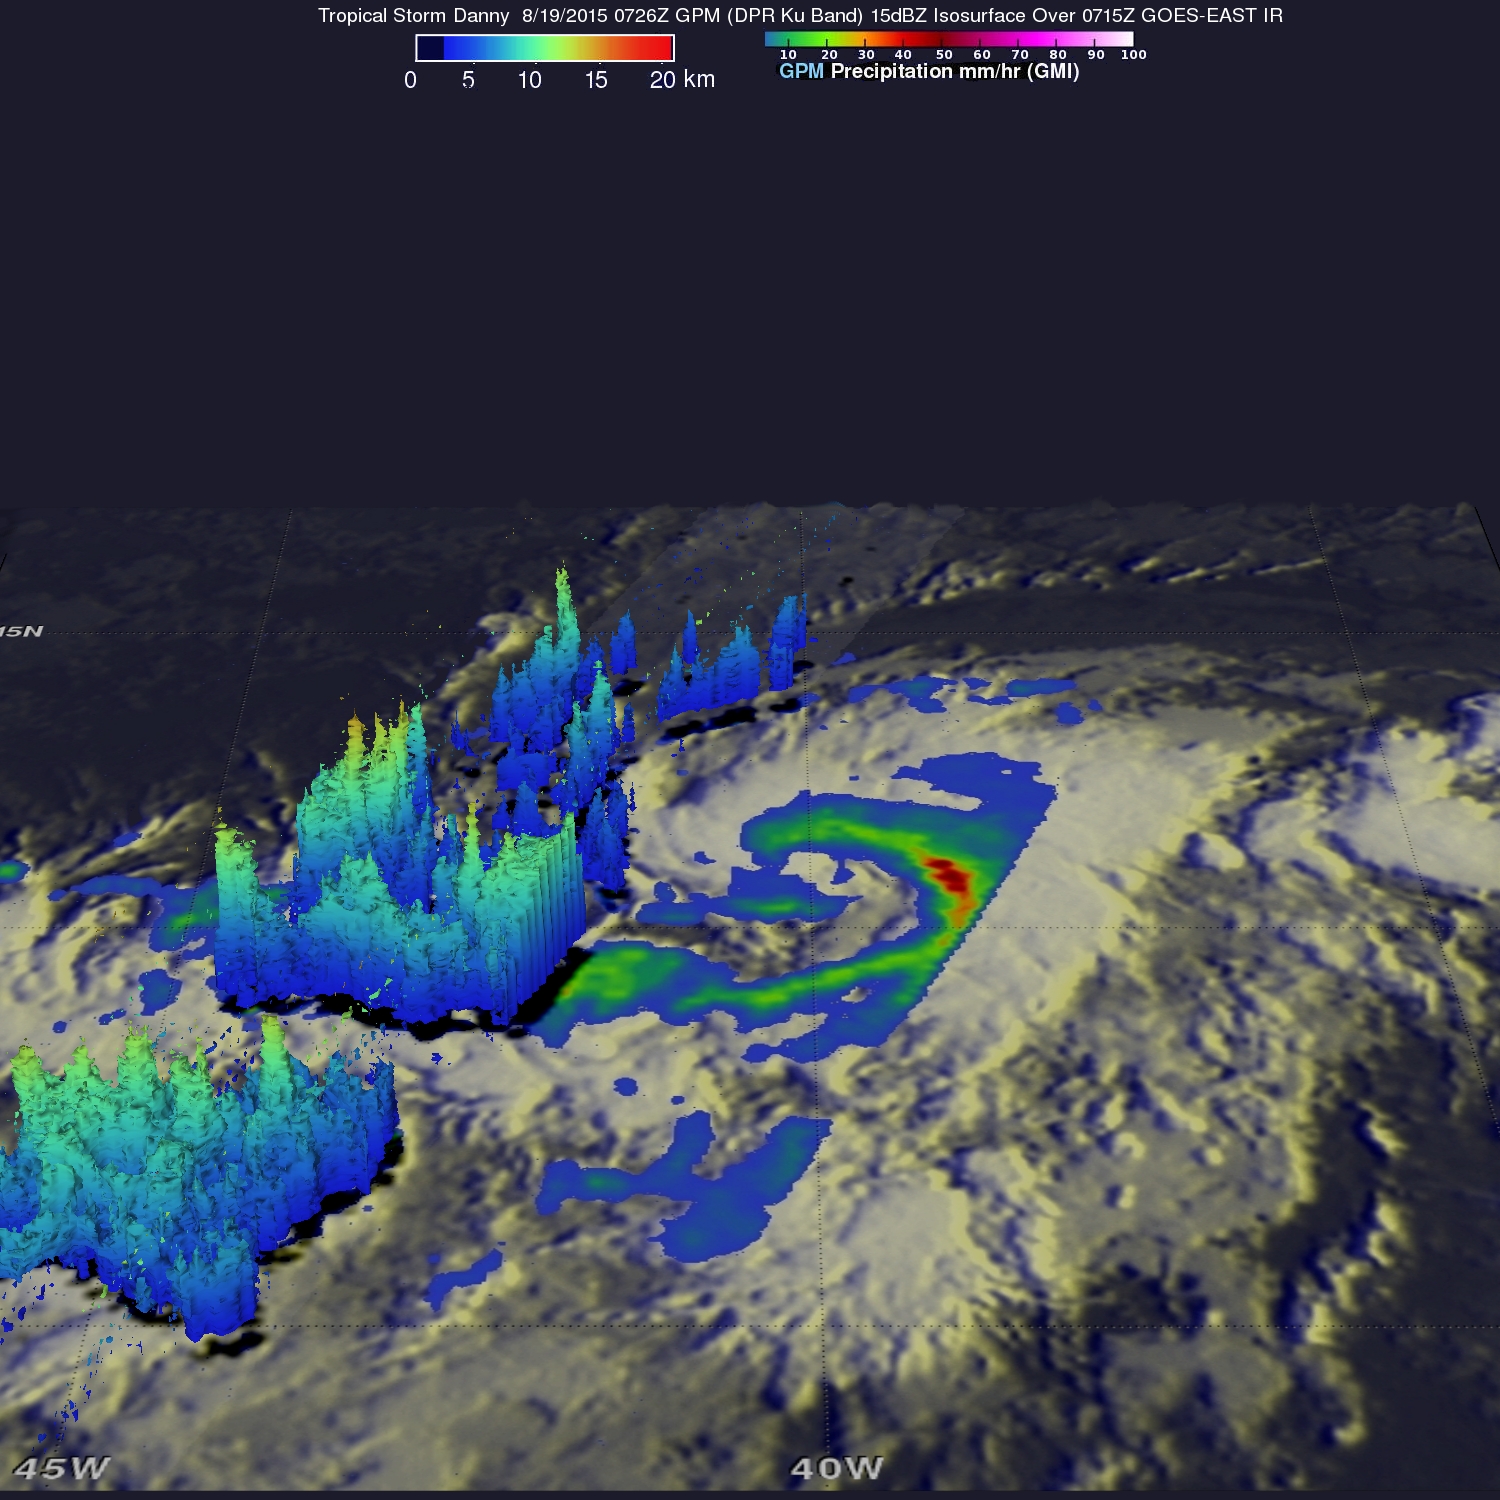
Tropical Storm Danny became the fourth named storm of the season on August 18 when it formed in the central Atlantic about 1,660 miles east of the Windward Islands. The Global Precipitation Measurement (GPM) mission core satellite passed over Danny the next day and analyzed the structure of its rainfall.
Danny originated from an African easterly wave that moved off of the coast of Africa 4 days earlier on the 14th of August. Storms that form in this region are known as Cape Verde storms and typically form towards the height of hurricane season.
In a typical season, there are about 10 named storms and 6 hurricanes. With this year being a potentially strong El Nino year, Atlantic hurricanes are usually suppressed. However, it only takes one. Hurricane Andrew, which devastated south Florida back in 1992, formed during an El Nino. Also, not all El Nino’s are alike.
The GPM core satellite is a joint effort. It is managed by both NASA and the Japan Aerospace Exploration Agency.
Credits: SSAI/NASA, Hal Pierce
GPM captured an image of Danny at 07:26 UTC (3:26 am EST) on August 19 and showed rain rates from the GMI overlaid on GOES-East satellite infrared data that showed the extend of Danny’s clouds.
At NASA’s Goddard Space Flight Center in Greenbelt, Maryland, a 3-D rendering of Danny was made using data from the GPM DPR (Dual-frequency Precipitation Radar). GPM showed that Danny was still in the process of becoming organized. The rain structure was still very asymmetric as noted by a large rain band being located mainly on the eastern side of the storm. Within this rain band, GPM detected rain rates of up to 73.9 mm/hour. At the time of this image, Danny was still a minimal tropical storm with sustained winds estimated at 50 mph by the National Hurricane Center (NHC).
At 5 a.m. EDT (0900 UTC) on August 20, the center of Tropical Storm Danny was located near latitude 12.2 North, longitude 43.7 West. That’s about 1,200 miles (1,930 km) east of the Lesser Antilles. Danny was moving toward the west near 10 mph (17 kph). A turn to the west-northwest with no change in forward speed is expected during the next 48 hours.
Maximum sustained winds remain near 50 mph (85 km/h) with higher gusts. Some strengthening is still possible, and the NHC said that Danny could become a hurricane on Friday. The estimated minimum central pressure is 1000 millibars.
Danny is over warm water, and the wind shear is light. Danny is still forecast to become the first hurricane of the Atlantic season within the next day or so and remain a hurricane as it approaches the Windward Islands.
Stephen Lang
SSAI/NASA Goddard Space Flight Center
Aug. 19, 2015 – NASA’s Aqua Satellite Takes Tropical Storm Danny’s Temperature
Tropical Depression 4 strengthened into Tropical Storm Danny late on August 19, as NASA’s Aqua satellite passed overhead and took its “temperature.” That is, infrared data from the AIRS instrument aboard measured cloud top temperatures and sea surface temperatures around the new tropical storm.
On August 18 at 15:47 UTC (1:47 p.m. EDT) the AIRS instrument aboard NASA’s Aqua satellite gathered infrared data on Danny as it was strengthening into a tropical storm. In a false-colored image of the data created at NASA’s Jet Propulsion Laboratory in Pasadena, California, cloud top temperatures were near -63F/-52C from northeast to east and south of the center. Cloud top temperatures that cold indicate very high, powerful thunderstorms with the capability for generating heavy rainfall.
AIRS data also showed that the sea surface temperatures around the storm were warmer than 300 kelvin (80.3 Fahrenheit/26.8 Celsius), warm enough to maintain and strengthen the tropical cyclone.
On Wednesday, August 19, Forecaster Avila of the National Hurricane Center (NHC) noted that the convection (rising air that forms the thunderstorms that make up the tropical storm) near the center has been intermittent, while a band of thunderstorm has been developing on the eastern semicircle. He said that “the center is difficult to locate on infrared images, and there are some indications that Danny could be moving a little faster.”
At 500 AM AST (0900 UTC), the center of Tropical Storm Danny was located near latitude 11.3 North, longitude 40.2 West. About 1,445 miles (2,325 km) east of the Lesser Antilles. Danny was moving toward the west near 14 mph (22 kph), and a track to the west-northwest is expected during the next two days. Maximum sustained winds remain near 50 mph (85 km/h) with higher gusts. Some strengthening is forecast during the next two days. The estimated minimum central pressure is 1000 milllibars.
Danny could become a hurricane on Thursday, August 20. The current forecast by the NHC indicates that Danny will likely reach maximum sustained winds near 105 mph on August 23 before weakening.
Rob Gutro
NASA’s Goddard Space Flight Center
Aug. 18, 2015 – NASA’s Terra Satellite sees Birth of Atlantic Tropical Depression Four
The fourth tropical depression of the Atlantic Ocean hurricane season formed today, August 18, 2015 as NASA’s Terra satellite passed overhead.
On Aug. 18 at 8:45 a.m. EDT the Moderate Resolution Imaging Spectroradiometer or MODIS instrument aboard NASA’s Terra satellite captured a visible image of newborn Tropical Depression 4 in the central Atlantic Ocean. The image showed thunderstorms banding around the center of circulation in all quadrants except the northwest.
The National Hurricane Center (NHC) also uses measurements from the Advanced Scatterometer or ASCAT instrument that flies aboard the EUMETSAT METOP satellite. NHC Forecaster Stewart noted that an “ASCAT-B overpass indicated the system has a well-defined circulation, and there was also a large field of 30-knots and greater wind vectors in the eastern semicircle.”
At 11 a.m. EDT (1500 UTC), Tropical Depression Four (TD4) had maximum sustained winds are near 35 mph (55 kph). The center of TD4 was located near latitude 10.6 North, longitude 36.5 West. That puts the center of the depression about 1,665 miles (2,675 km) east of the Windward Islands. The depression was moving toward the west near 13 mph (20 kph) and it is expected to turn toward the west-northwest by Wednesday, August 19. The estimated minimum central pressure is 1009 millibars.
The NHC noted that gradual strengthening is forecast during the next 48 hours, and the depression is expected to become a tropical storm later today, August 18. The storm is expected to reach hurricane strength on August 21.