


GPM Sees Weakening Tropical Storm Ignacio Headed Toward Canada
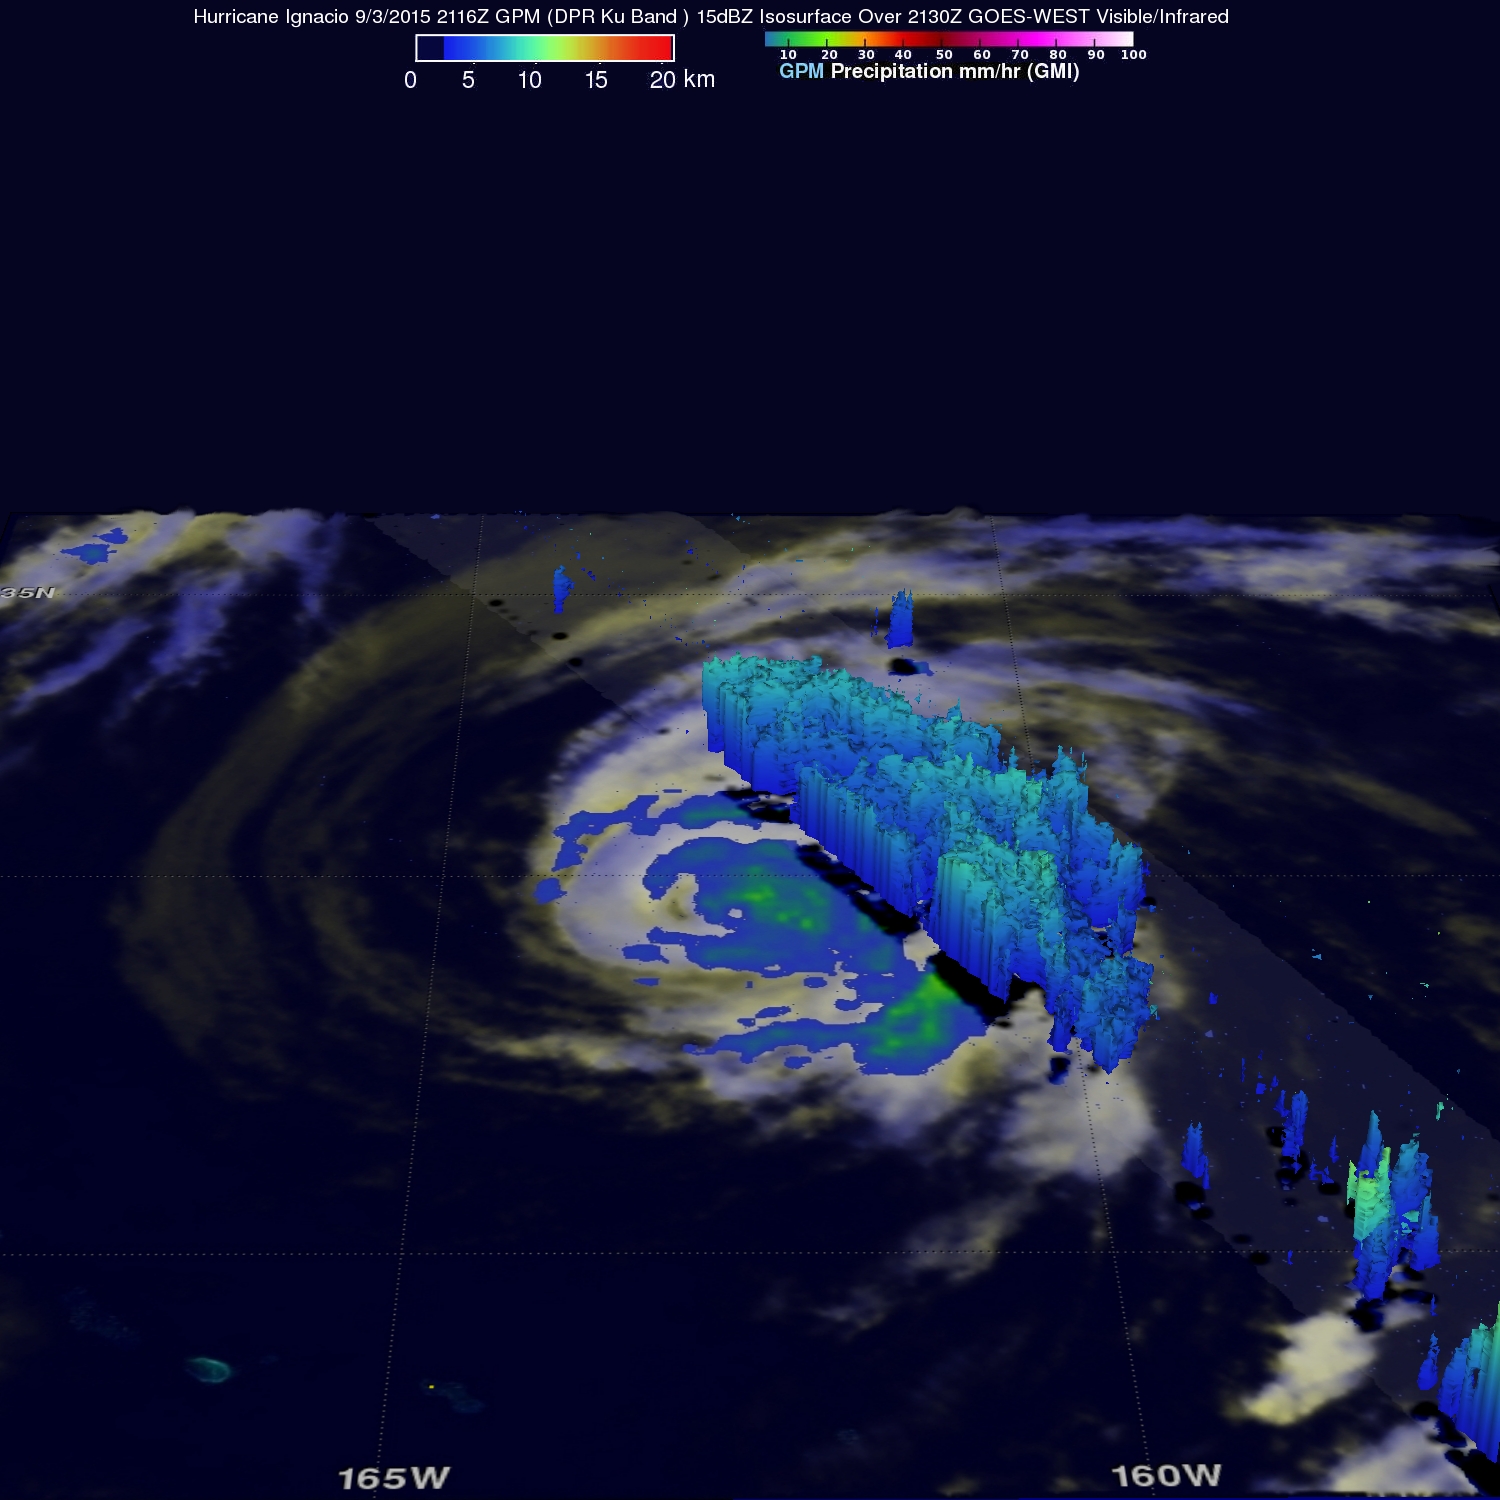
Hurricane Ignacio continues weakening as it moves over the colder waters of the Pacific Ocean far to the north of Hawaiian Islands. The Global Precipitation Measurement of GPM mission core satellite flew over Ignacio and analyzed the weaker storm’s precipitation.
Ignacio peaked as a category four hurricane with winds of 125 knots (144 mph) less than a week ago when it was southeast of Hawaii. Ignacio had weakened to strong tropical storm intensity with winds of about 60 knots (69 mph) when the GPM core observatory satellite flew over on September 3, 2015 at 2116 UTC.
GPM’s Microwave Imager (GMI) and Dual-Frequency Precipitation Radar (DPR) found with this pass that the maximum rainfall rate was only about 74.0 mm (2.9 inches) per hour. GPM is a joint mission between NASA and the Japan Aerospace Exploration Agency, JAXA.
On September 4, 2015 at 11 a.m. EDT (5 a.m. HST/1500 UTC) the center of Hurricane Ignacio was located near latitude 32.4 north and longitude 164.2 west. That puts the center about 860 miles (1,380 km) north-northwest of Honolulu, Hawaii and about 600 miles (965 km) north-northeast of French Frigate Shoals. The estimated minimum central pressure is 980 millibars. Maximum sustained winds are near 75 mph (120 kph) and weakening.
Ignacio was moving toward the north-northwest near 13 mph (20 kph) and is expected to turn north on September 5, then northeast the following day. For updated forecasts visit NOAA’s Central Pacific Hurricane Center at: http://www.prh.noaa.gov/cphc.
Ignacio could buffet western Canada’s coast near Queen Charlotte Islands as a sub-tropical storm during the week of September 7.
Harold F. Pierce
SSAI/NASA Goddard Space Flight Center
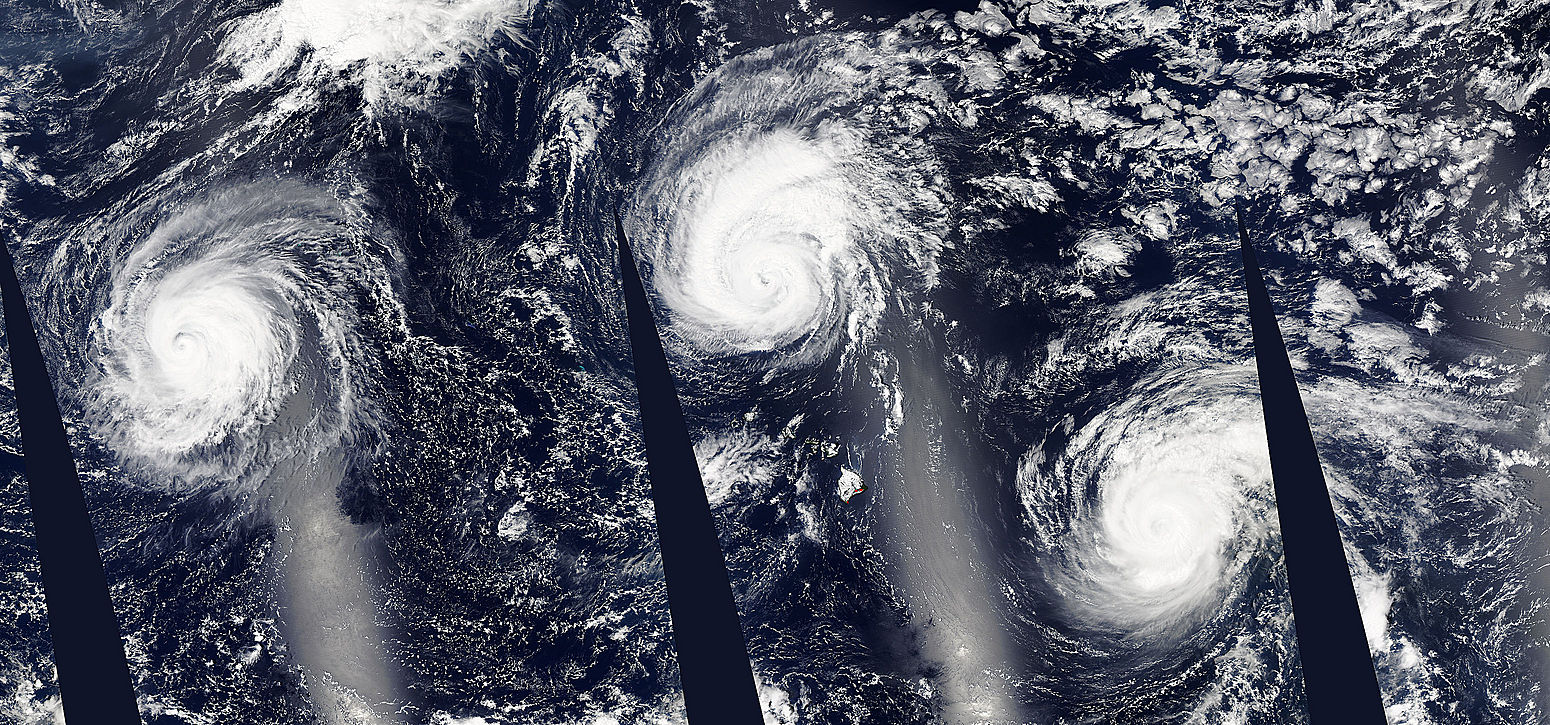
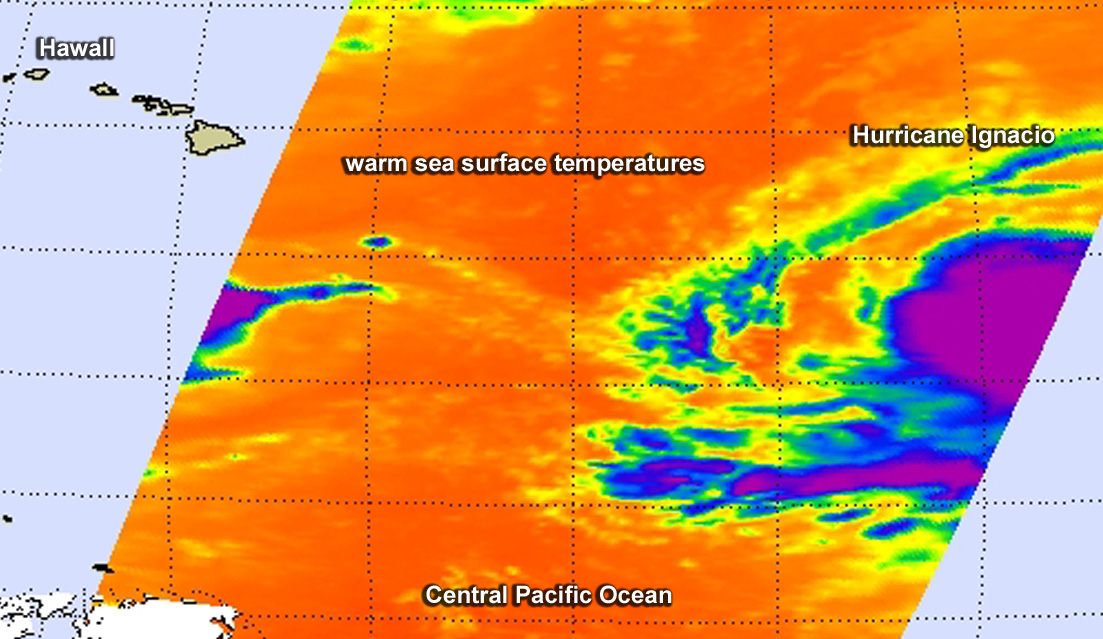
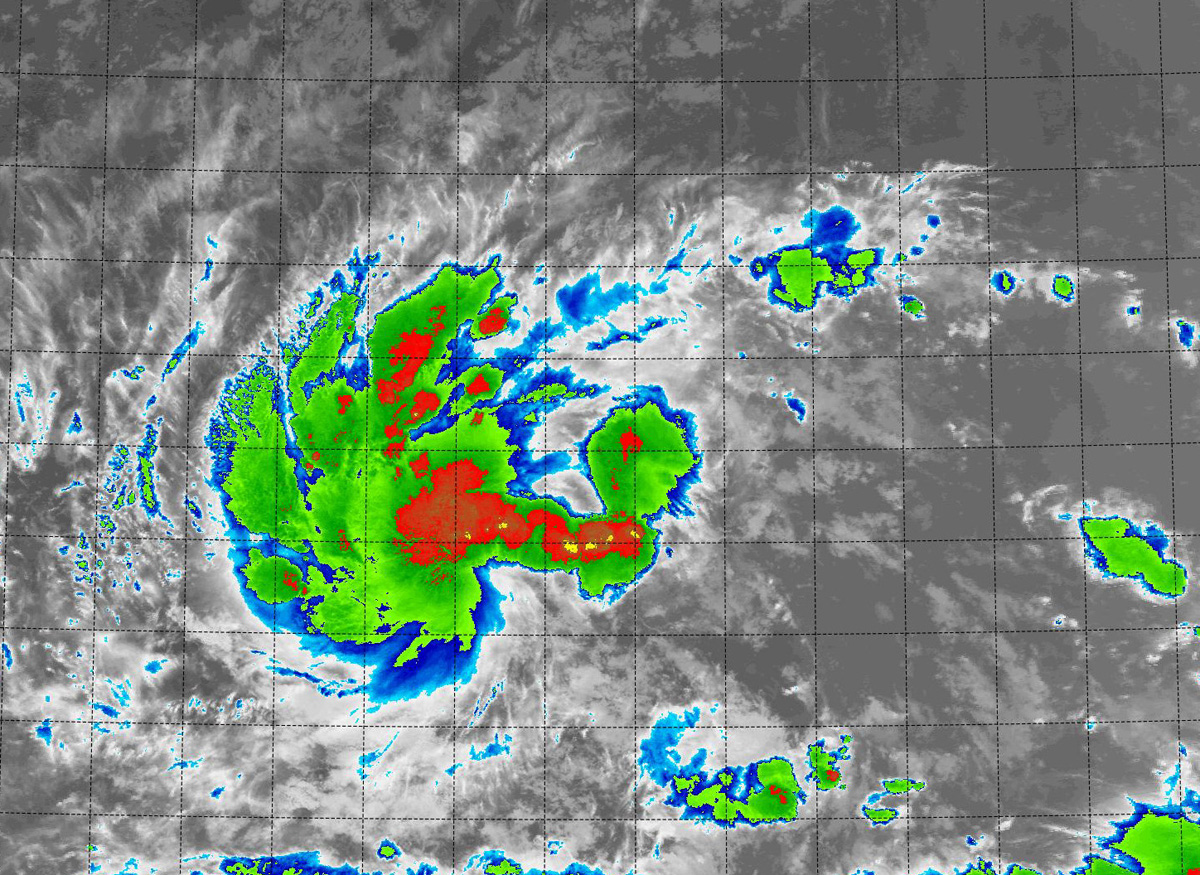
Sep. 03, 2015 – NASA’s Aqua Satellite Sees Ignacio in a Trio Across the Pacific
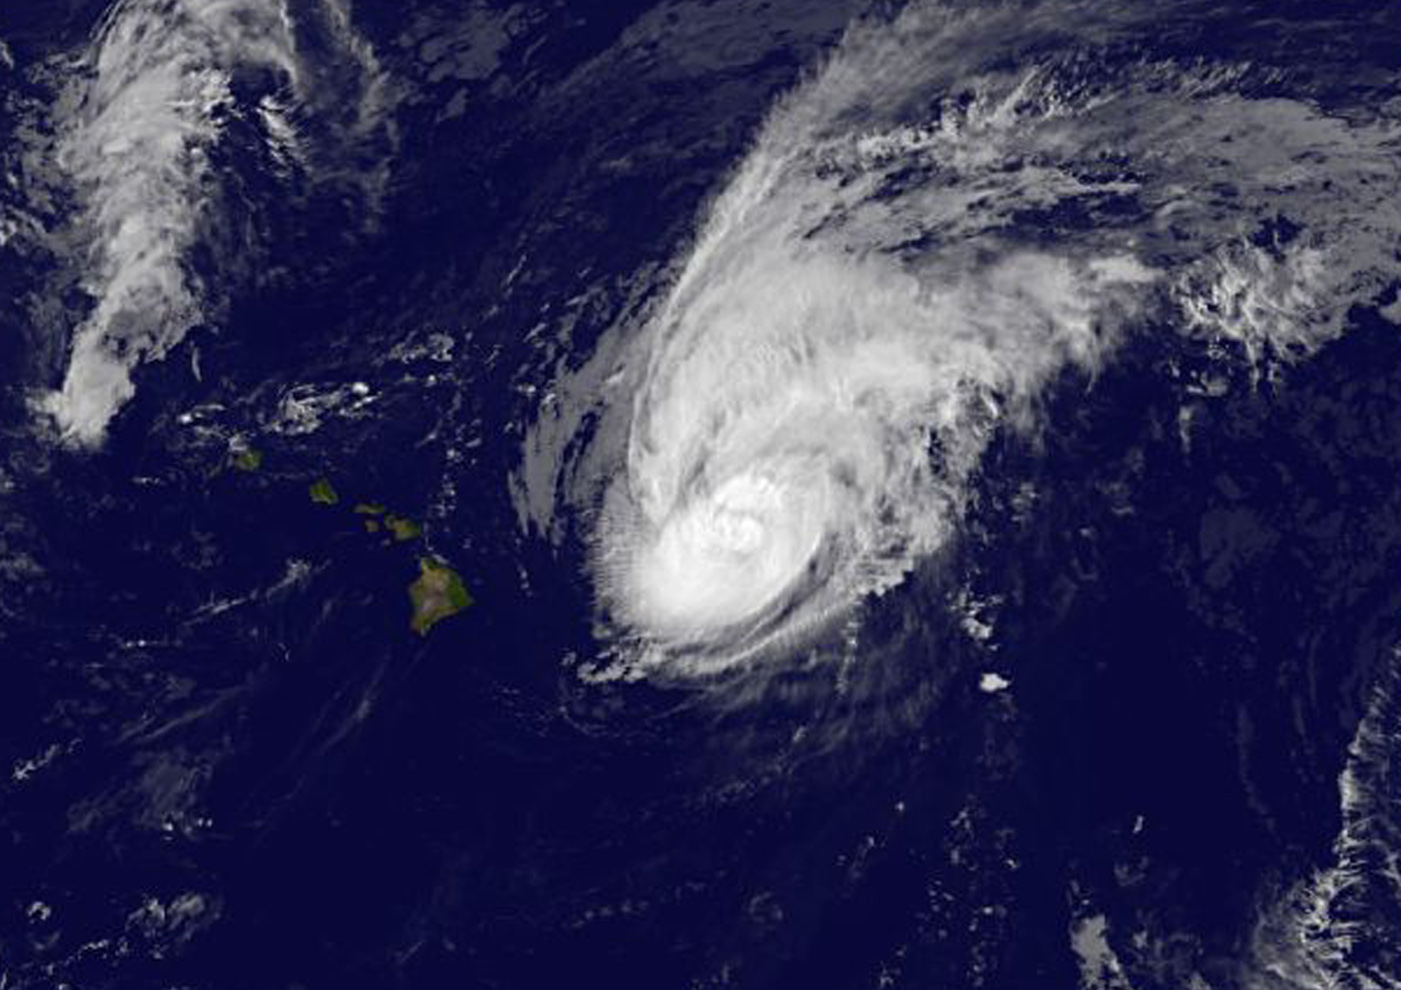
The tropical trio of tropical cyclones continued on September 3 when NASA’s Aqua satellite passed over the Pacific Ocean. Images taken from several overpasses were put together to create a panorama of the Pacific that included Typhoon Kilo, Hurricane Ignacio and Hurricane Jimena.
Hurricane Ignacio lies northeast of Hawaii in the Central Pacific Ocean and is sandwiched between Kilo in the Northwestern Pacific and Jimena in the Central Pacific. After Ignacio regained hurricane status, Aqua passed overhead and the Moderate Resolution Imaging Spectroradiometer or MODIS instrument took an image of the storm that showed a re-developed eye and thick bands of thunderstorms wrapping into the low-level center.
At 11 a.m. EDT (5 a.m. HST/1500 UTC) the center of Hurricane Ignacio was located near latitude 28.8 north and longitude 161.7 west. The Central Pacific Hurricane Center (CPHC) noted Ignacio was moving toward the northwest near 14 mph (22 kph) and this motion is expected to continue through today followed by a turn toward the north Friday and Saturday.
Maximum sustained winds are near 75 mph (120 kph) and gradual weakening is expected over the next two days. The estimated minimum central pressure is 983 millibars.
NOAA’s CPHC noted that after September 3, ocean swells generated from Ignacio will fade but swells from Hurricane Jimena, located east-southeast of the Hawaiian Islands, will then become the dominant surf producer.
Rob Gutro
NASA’s Goddard Space Flight Center
Sep. 02, 2015 – NASA Sees a Weaker Tropical Storm Ignacio North of Hawaiian Islands
Late on August 31 at 11 p.m. EDT the RapidScat instrument that flies aboard the International Space Station observed Ignacio’s strongest winds surrounded the center of storm near 30 meters per second (108 kph/67 mph). Those winds weakened over the next 36 hours.
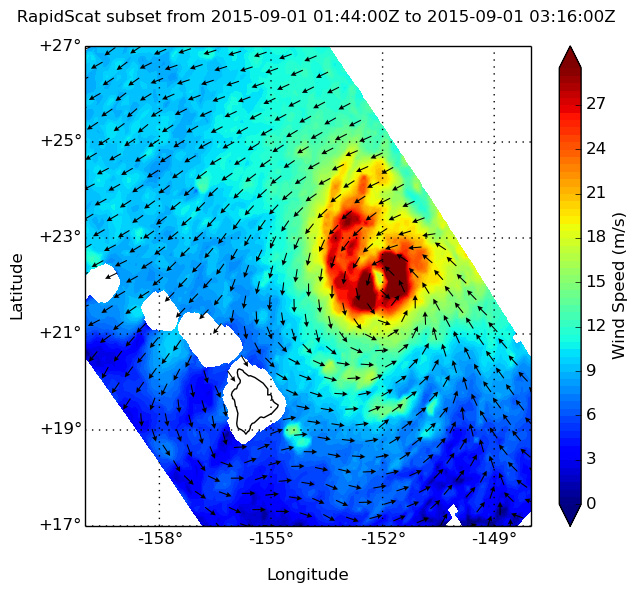
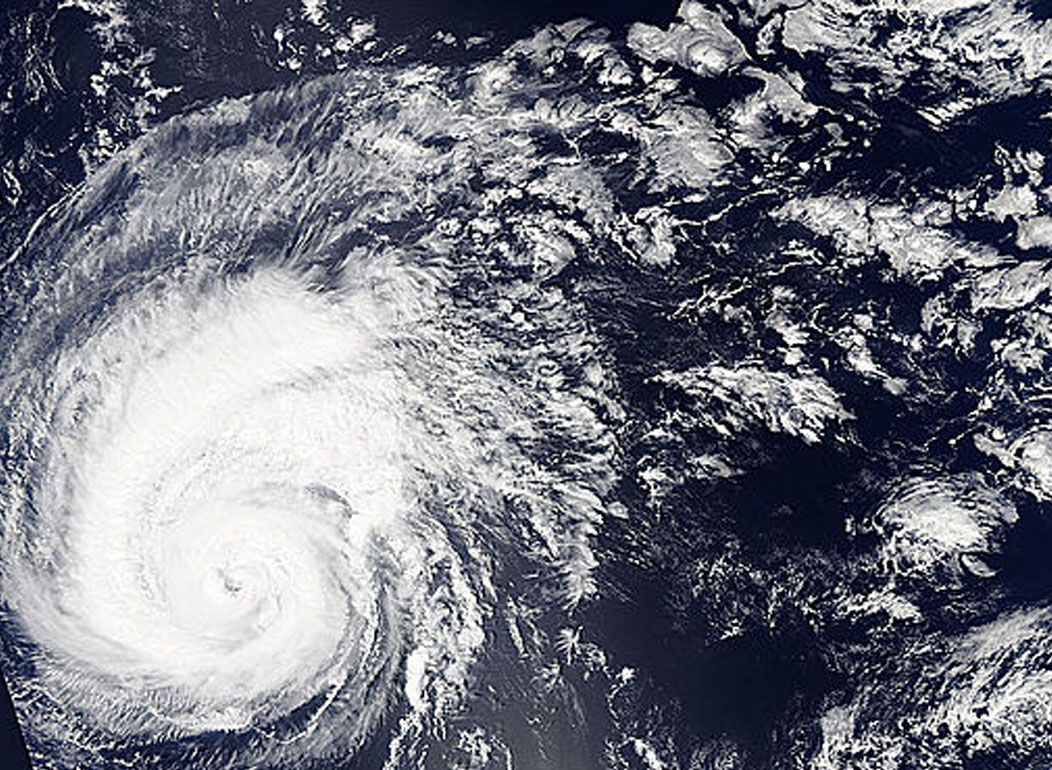
At 21:10 UTC (5:10 p.m. EDT) the MODIS instrument aboard Terra captured a visible image of Tropical Storm Ignacio well north of the Hawaiian Islands. As the storm weakened from a hurricane to a tropical storm, the eye was no longer visible.
At 11 a.m. EDT on September 2, there are no coastal watches or warnings in effect for Hawaii as Ignacio passing well north of the main Hawaiian Islands. There was no eye visible on satellite imagery, but the center of the storm was indicated by a “warm spot” on infrared imagery that stood out from the colder cloud top temperatures of the thunderstorms surrounding Ignacio’s center. Those thunderstorms, however, had weakened since the previous day.
The center of Tropical Storm Ignacio was located near latitude 26.1 north and longitude 157.1 west. That’s about 335 miles (540 km) north of Honolulu. Ignacio was moving toward the northwest near 12 mph (19 kph) and the storm is expected to turn to the north-northwest late on September 3. Maximum sustained winds were near 70 mph (110 kph) and slow weakening is expected starting on Thursday, September 3.
Rob Gutro
NASA’s Goddard Space Flight Center
When NASA’s Terra satellite passed over Tropical Storm Ignacio on Sept. 1 it gathered cloud and wind data on the weakening storm.
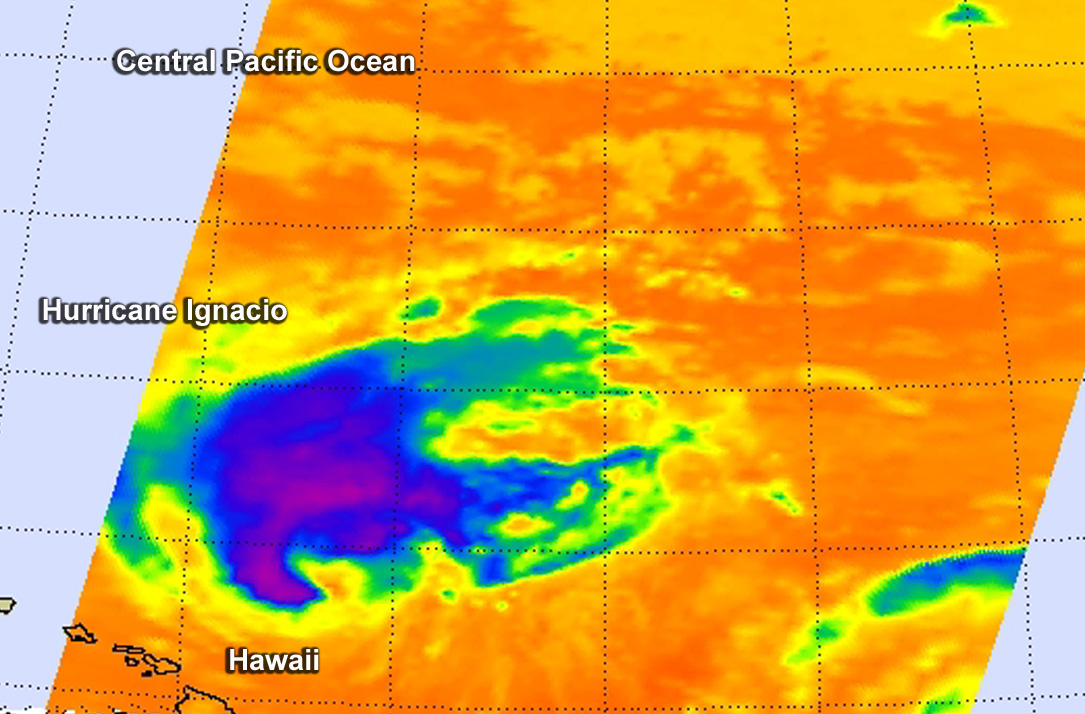
Sep. 01, 2015 – NASA Sees Wind Shear Affecting Hurricane Ignacio

Hurricane Ignacio is staying far enough away from the Hawaiian Islands to not bring heavy rainfall or gusty winds, but is still causing rough surf. Infrared satellite data on September 1 shows that wind shear is adversely affecting the storm and weakening it.
The Atmospheric Infrared Sounder or AIRS instrument that flies aboard NASA’s Aqua satellite gathers infrared data that reveals temperatures. When NASA’s Aqua satellite passed over Ignacio on September 1 at 11:41 UTC (7:41 a.m. EDT), the AIRS data and showed some high, cold, strong thunderstorms surrounded the center where cloud top temperatures were near -63F/-53C. However, AIRS also showed that southwesterly wind shear was pushing the thunderstorms to the northeast of the low-level center.
The National Hurricane Center noted that infrared data showed the central dense overcast clouds had now been completely sheared away and replaced with a “warmer banding feature across the western and northern semicircles.” That means weaker thunderstorms with less cold cloud top temperatures, because there wasn’t as much uplift in the atmosphere to push them higher.
On September 1 at 8:00 a.m. EDT an infrared image from NOAA’s GOES-West satellite clearly showed that that southwesterly vertical wind shear was affecting the storm. In the image it appeared that Ignacio developed a tail that extended to the northeast as its clouds and thunderstorms were being pushed in that direction.
At 11 a.m. EDT (1500 UTC/5 a.m. HST), the center of Hurricane Ignacio was near latitude 23.5 north and longitude 153.7 west. That’s about 310 miles (495 km) east-northeast of Honolulu, Hawaii, and 275 miles (445 km) north-northeast of Hilo. The estimated minimum central pressure is 984 millibars.
Ignacio’s maximum sustained winds dropped to near 80 mph (130 kph). That means that Kilo is a category one hurricane on the Saffir-Simpson Hurricane wind scale. The Central Pacific Hurricane Center expects Ignacio to slowly weaken through early Thursday, September 3.
NOAA’s Central Pacific Hurricane Center noted that large swells generated by Ignacio will continue along east and northeast facing shores of the Hawaiian Islands over the next couple of days. Resultant surf will be large…potentially damaging and life-threatening.
Rob Gutro
NASA’s Goddard Space Flight Center
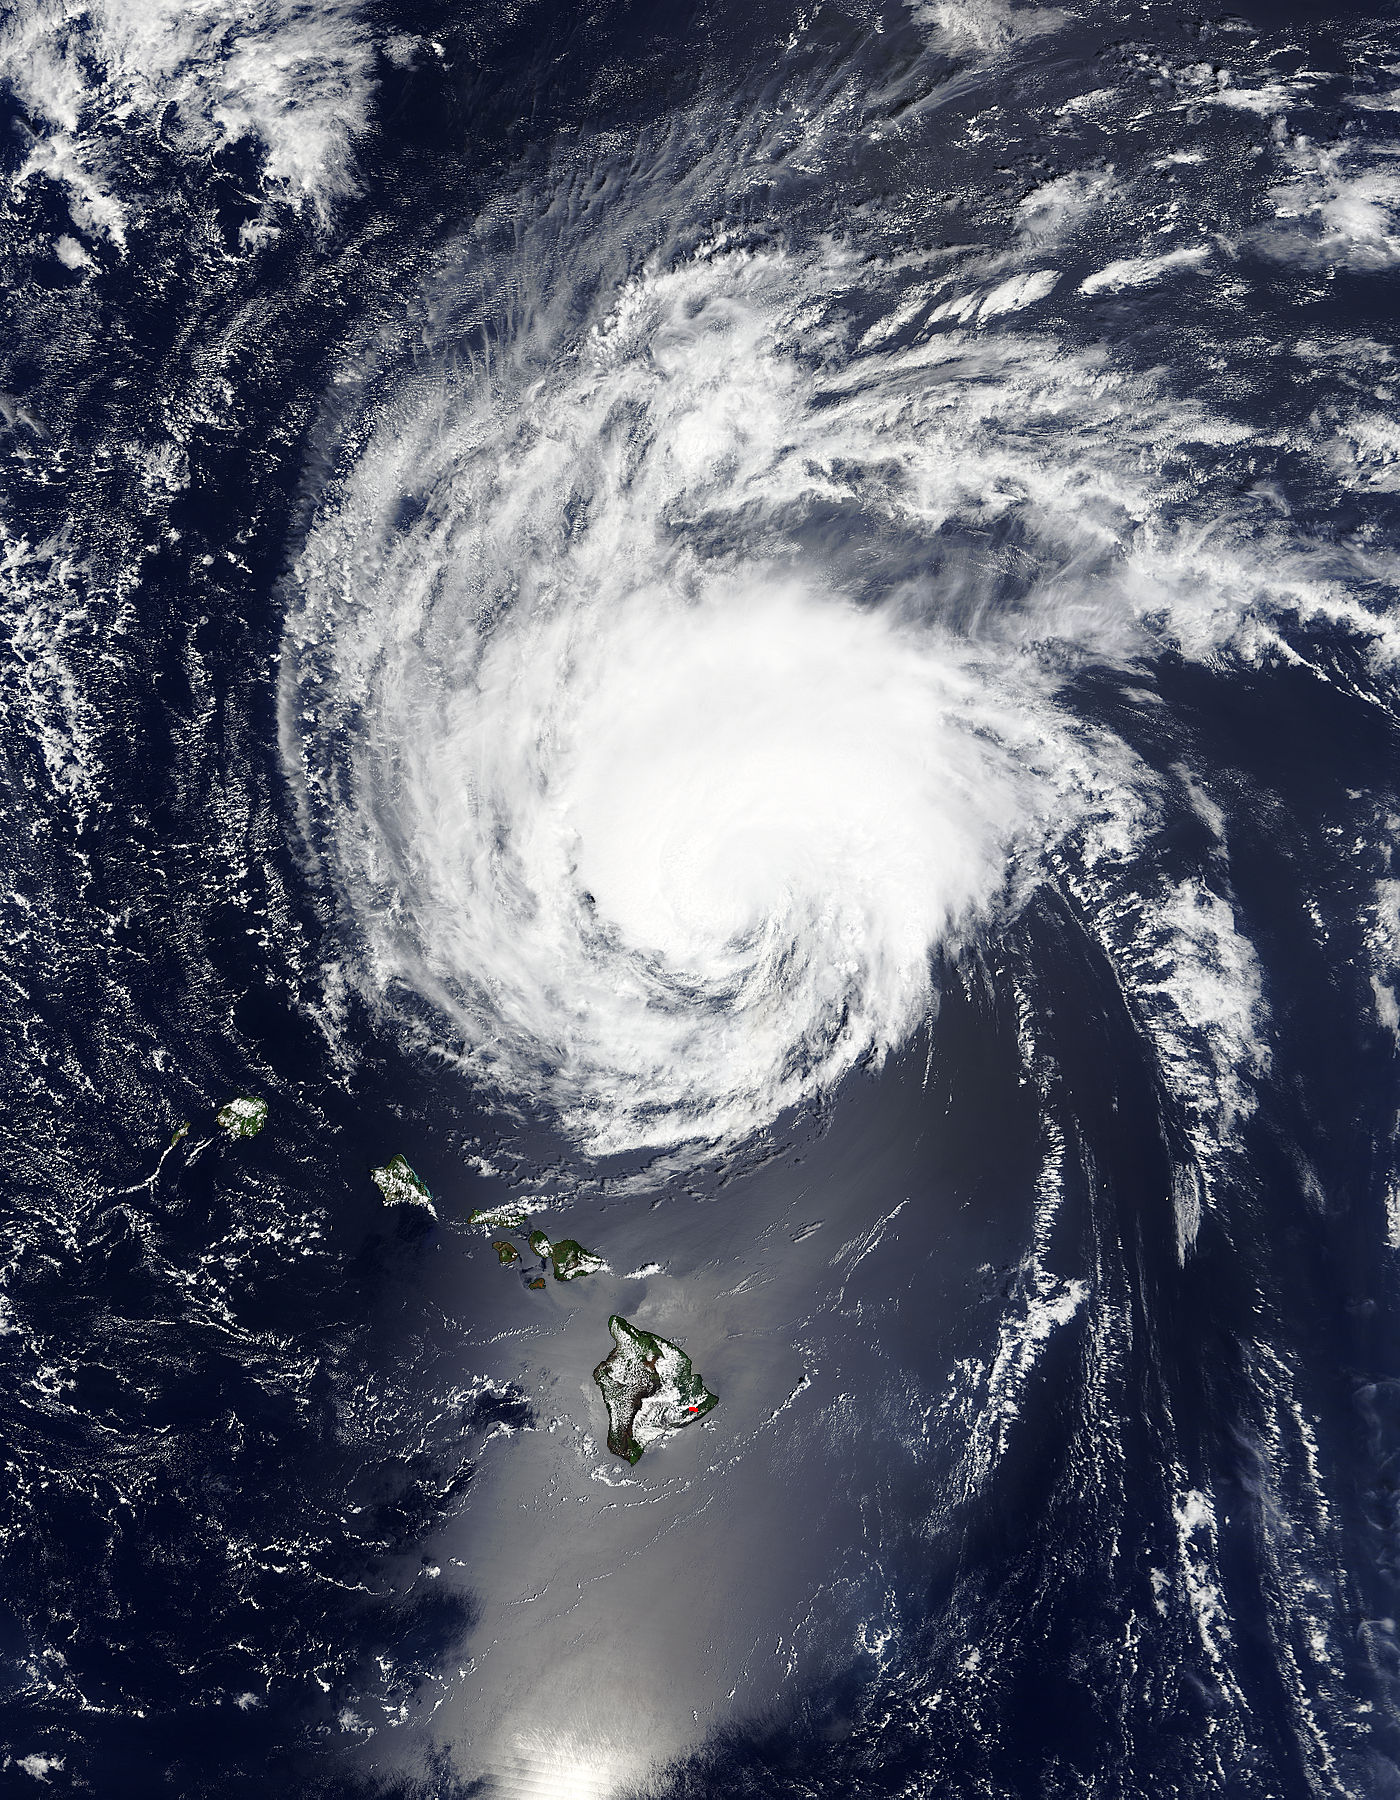
Aug. 31, 2015 – NASA Sees a Weakening Hurricane Ignacio Moving Parallel to Hawaiian Islands

NASA’s Aqua satellite passed over Hurricane Ignacio and viewed the storm in infrared light, providing valuable temperature data. Aqua saw a weaker Ignacio moving parallel to the Hawaiian Islands.
The Atmospheric Infrared Sounder or AIRS instrument aboard Aqua gathers infrared data that shows temperatures. That AIRS data was made into a false-colored infrared image from August 30 at 22:47 UTC (6:47 p.m. EDT) and showed high, cold, strong thunderstorms surrounded the center of Hurricane Ignacio.
AIRS imagery also showed a thick band of thunderstorms spiraling into the northern quadrant of the storm from the east. Coldest cloud top temperatures were as cold as -63F/-53C around the center of the hurricane, somewhat warmer than they were the day before. NASA research has shown that thunderstorms with cloud tops that cold and high in the troposphere have the potential to generate heavy rainfall. As Ignacio weakens, those cloud tops will drop and become less cold. When infrared data shows that cloud tops are warmer, it means the uplift in the storm is weakening.
On August 31, NOAA’s Central Pacific Hurricane Center (CPHC) stated that infrared satellite images show that Ignacio continued to steadily weaken…down from a peak intensity that was reached on August 30, with a cloud-filled eye barely discernible.
On August 31 at 1500 UTC (11 a.m. EDT/5 a.m. HST), the center of Hurricane Ignacio was located near latitude 20.9 north and longitude 150.8 west. That’s about 460 miles (735 km) east of Honolulu, and about 335 miles (540 km) east of Hana, Hawaii. The estimated minimum central pressure is 966 millibars.
Maximum sustained winds are near 105 mph (165 kph) and the CPHC expects significant weakening over the next couple of days.
Wednesday. Hurricane force winds extend outward up to 60 miles (95 km) from the center and tropical storm force winds extend outward up to 175 miles (280 km). Because Ignacio remains several hundred miles from land, Hawaii is not experiencing the hurricane-force winds.
Ignacio is moving toward the northwest near 10 mph (17 kph) and this motion Is expected to continue for the next couple of days.
The CPHC forecast calls for Ignacio to track in a general north-northwesterly direction over the next several days, paralleling the Hawaiian Islands to the east, but never making landfall. Ignacio is also forecast to weaken to a tropical storm by September 2 as it continues heading northwest. For updated forecasts, visit NOAA’s CPHC website: http://www.prh.noaa.gov/cphc.
Rob Gutro
NASA’s Goddard Space Flight Center
Aug. 28, 2015 – NASA’s GPM Sees Heavy Rain in Hurricane Ignacio

Hurricane Ignacio continued to strengthen as NASA’s Global Precipitation Measurement or GPM core satellite analyzed its rainfall. Ignacio is forecast to move near Hawaii over the weekend of August 29 and 30.
Hurricane Ignacio is the latest tropical cyclone in this busy 2015 eastern Pacific hurricane season to pose potential danger for the Hawaiian Islands. Guillermo passed close to the north, Hilda curved to the south and Kilo’s course was threatening before a course change moved it to the south of the islands. The Central Pacific Hurricane Center (CPHC) in Honolulu Hawaii predicts that Ignacio will still be a hurricane when it passes to the northeast of Hawaii in the next several days.
Rainfall associated with hurricane Ignacio was measured by the GPM core observatory satellite’s Microwave Imager (GMI) on August 27, 2015 at 1121 UTC (7:21 a.m. EDT). GPM’s GMI instrument found that rain was falling at a rate of over 60 mm (~2.4 inches) per hour south of the hurricane’s eye. GPM is co-managed by NASA and the Japan Aerospace Exploration Agency.
On August 28, the heaviest rainfall shifted slightly to the southeast side of the storm. Infrared satellite data, such as those from the Atmospheric Infrared Sounder instrument aboard NASA’s Aqua satellite showed cloud top temperatures in that quadrant of the storm were as cold as -80 Fahrenheit (-62.2 Celsius).
At 5 a.m. EDT (0900 UTC) on August 28, 2015, the center of hurricane ignacio was located near latitude 13.9 north and longitude 143.1 west. That puts the center about 890 miles (1,430 km) east-southeast of Hilo, Hawaii and about 1,100 miles (1,770 km) east-southeast of Honolulu, Hawaii. Maximum sustained winds are near 90 mph (150 kph). Ignacio is expected to slowly strengthen through late Saturday, August 29 and peak at 110 mph (177 kph). Ignacio is expected to start weakening slightly on August 31.
Ignacio is moving toward the west-northwest near 12 mph (19 kph) and is expected to continue in that direction for the next day. The estimated minimum central pressure is 982 millibars.
The CPHC forecast puts the center of Hurricane Ignacio east of the Big Island of Hawaii on Monday, August 31 and expects the storm to move in a northwesterly direction, paralleling the Hawaiian Islands. For updates, visit the CPHC website at: http://www.prh.noaa.gov/cphc.
Hal Pierce / Rob Gutro
NASA’s Goddard Space Flight Center
Aug. 27, 2015 – NASA Data Shows Hurricane Ignacio’s Very Cold Cloud Tops Indicate Quick Strengthening
When cloud top temperatures get colder, the uplift in tropical cyclones gets stronger and the thunderstorms that make up the tropical cyclones have more strength. NASA’s Aqua satellite passed over Hurricane Ignacio and infrared data revealed cloud top temperatures had cooled from the previous day.
Ignacio strengthened to a hurricane at 11 p.m. EDT on August 26. It became the seventh hurricane of the Eastern Pacific Ocean hurricane season.
A false-colored infrared image of Hurricane Ignacio was made at NASA’s Jet Propulsion Laboratory in Pasadena California, using data from the Atmospheric Infrared Sounder or AIRS instrument that flies aboard NASA’s Aqua satellite The AIRS data from August 27 at 11:23 UTC (7:23 a.m. EDT) showed that cloud top temperatures had cooled within Ignacio indicating that the uplift of air within the storm was stronger than it was on August 26. AIRS data showed the strongest thunderstorms had cloud top temperatures in excess of -63F/-53C.
Forecaster Blake at NOAA’s National Hurricane Center noted that “Very cold cloud tops persist near the center of Ignacio, although the overall cloud pattern is not very symmetric and no eye is present in conventional satellite data. However, microwave images show an eye beneath the cirrus clouds.”
At 5 a.m. EDT (2 a.m. PDT/0900 UTC) on Thursday, August 27 the center of Hurricane Ignacio was located near latitude 12.6 North, longitude 138.5 West. That’s about 1,205 miles (1,940 km) east-southeast of Hilo, Hawaii. Ignacio was moving toward the west-northwest near 13 mph (20 kph) and this general motion is expected to continue through Friday. Maximum sustained winds have increased to near 85 mph (140 kph). The estimated minimum central pressure is 985 millibars.
The NHC noted that further strengthening seems likely with Ignacio over the next couple of days as the storm moves through an area with light-to-moderate easterly shear, warm water and a moist atmosphere. Ignacio’s strength is expected to peak on August 29 when the maximum sustained winds are forecast to be near 110 knots (115 mph) before weakening commences.
The current five day forecast from the NHC brings Ignacio east of the Big Island of Hawaii. Ignacio has now moved into the Central Pacific Ocean, and forecasts will be covered by NOAA’s Central Pacific Hurricane Center. For updates, visit: http://www.prh.noaa.gov/hnl/cphc/.
Rob Gutro
NASA’s Goddard Space Flight Center
Aug. 26, 2015 – NASA Measures Rainfall in Stronger Tropical Storm Ignacio
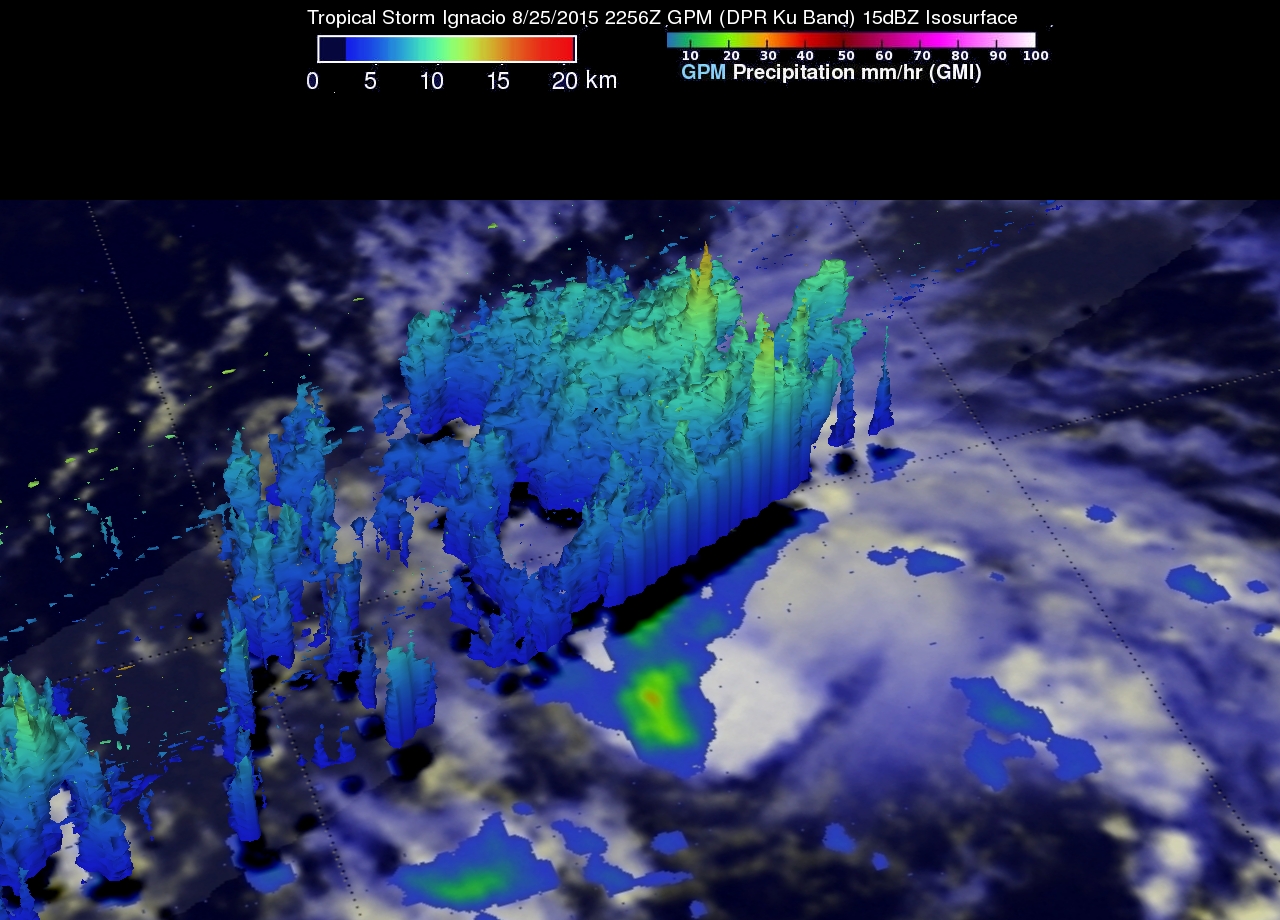
The Global Precipitation Measurement or GPM mission core satellite measured rainfall as Tropical Depression Twelve was upgraded to Tropical Storm Ignacio.
Tropical Depression 12E strengthened into Tropical Storm Ignacio at 5 p.m. EDT yesterday, August 25. At that time, it became the ninth named tropical storm of the Eastern Pacific hurricane season.
The GPM core observatory satellite saw Ignacio on August 25, 2015 at 2256 UTC. GPM’s Dual-Frequency Precipitation Radar (DPR) found rain falling at a rate of over 74 mm (2.9 inches) per hour with storm tops reaching to altitudes of close to 15 km (8.7 miles). GPM is managed by both NASA and the Japan Aerospace Exploration Agency.
On August 26, the strongest convection (rising air that form the thunderstorms that make up a tropical cyclone) has been persisting mainly over the western half of the circulation. That means more thunderstorm development on that side of the storm. Recent microwave images show increased banding of thunderstorms.
At 5 a.m. EDT (0900 UTC) on August 26, the center of Tropical Storm Ignacio was located near latitude 12.3 North, longitude 134.1 West. That’s about 1,485 miles (2,385 km) east-southeast of Hilo, Hawaii. Ignacio currently poses no threat to land areas.
Ignacio is moving toward the west near 7 mph (11 km/h). This westward motion is expected to continue today with an increase in forward speed. A turn toward the west-northwest is forecast on Thursday.
Maximum sustained winds have increased to near 50 mph (85 kph) and the National Hurricane Center expects Ignacio to become a hurricane by Thursday, August 27. The estimated minimum central pressure is 1001 millibars. For updated forecasts, visit: www.nhc.noaa.gov.
Hal Pierce
SSAI/NASA’s Goddard Space Flight Center
Aug. 25, 2015 – NASA’s Terra Satellite Sees Birth of Tropical Depression 12E
The twelfth tropical depression of the Eastern Pacific Ocean hurricane season was born today, August 25, 2015, as NASA’s Terra satellite flew overhead.
At 3:10 a.m. EDT on August 25, the MODIS instrument aboard NASA’s Terra satellite gathered infrared data on newborn Tropical Depression 12E. The infrared data measures temperatures of cloud tops and found that the coldest and highest thunderstorms were mostly to the west of the circulation center. That’s because the depression is being battered by southeasterly wind shear.
At 200 AM PDT (0900 UTC), the center of Tropical Depression Twelve-E was located near latitude 13.2 North, longitude 131.7 West. That’s about 1,610 miles (2,595 km) east-southeast of Hilo, Hawaii. Maximum sustained winds remain near 35 mph (55 kph)
The depression was moving toward the west near 5 mph (7 kph) and this general motion with some increase in forward speed is forecast during the next day or so. The estimated minimum central pressure is 1006 millibars.
National Hurricane Center’s forecaster Cangialosi said that the wind shear is expected to lessen later in the day on August 25. Lighter wind shear and warm sea surface temperatures will help the storm intensify over the next several days. NHC currently expects the depression to reach hurricane status on August 28.