


![Request for Information – Potential [Placeholder for Prize]](https://assets.science.nasa.gov/dynamicimage/assets/science/missions/a-step/FFR_Earth_Background_20251120%20.png?w=1024)


NASA field campaigns – which study Earth from air, sea, and on the ground – return vast troves of valuable data. Sometimes, however, processing so much raw information and related satellite imagery can slow the pace of scientific discovery.
To combat that lag in output, researchers and programmers have developed a prototype 3D video dashboard for data from field campaigns that will make information easier to process and more readily available to anyone across the Earth science community.
“Navigating and visualizing thousands of raw data files collected during a field campaign is an extraordinarily tedious task, and – left as is – might reduce the scientific return of the campaign,” said Larry Di Girolamo, a professor of atmospheric sciences at the University of Illinois.
Di Girolamo collaborated with programmers and designers from the Advanced Visualization Lab (AVL) at the University of Illinois Urbana-Champaign National Center for Supercomputing Applications in Urbana, Illinois, to prototype a new process for communicating data from field expeditions.
The final visualization prototypes include a three-minute video in 3D, as well as a longer data dashboard video depicting 76 different data variables. These visualizations – as well as the raw data from the CAMP2Ex field campaign – meet NASA’s Open Source Science requirements and are freely available to the public.
The project was supported by the Advanced Information Systems Technology (AIST) program in NASA’s Earth Science Technology Office (ESTO).
Credits: NASA / Katie Jepson
The process brought together a combination of commercially available, open source, and home-grown software to transform raw data from NASA’s recent Cloud, Aerosol and Monsoon Processes Philippines Experiment (CAMP2Ex), into a 3D animation and a data dashboard video. CAMP2Ex explored the impact air pollution may have on weather patterns in the Philippines, and these visualizations made it easier for researchers to locate patterns within the thousands of data points collected during the field campaign.
The Camp2EX campaign data dashboard video is the first to incorporate such a dynamic array of data sources for a NASA field expedition.
In the Philippines, high-altitude clouds can impede satellite observations of the interaction between lower-altitude clouds and the airborne particles, such as pollution, that affect rainfall and the weather. To fill the gap, additional data for Camp2EX was collected by research planes, a U.S. Navy research vessel, and the Manila Observatory in Quezon City.
Using these myriad instruments to compile a robust record gave scientists the complete data picture they needed to conduct their research, but also left them with the challenge of finding patterns within so many different data points.
“How do you build a comprehensive picture from hundreds of thousands of files from different data sources?” asked Di Girolamo.
To solve this problem, Di Girolamo and the creative team at AVL prototyped two visualization products using data from CAMP2EX’s Research Flight 09.
The first visualization was a 3D animated video that depicts the journey of NASA’s P3 research aircraft as it navigates the open ocean south of Luzon. The second was a prototype of a potential interactive dashboard that presents data gathered by airborne, seaborne, and spaceborne instruments supporting that research flight.
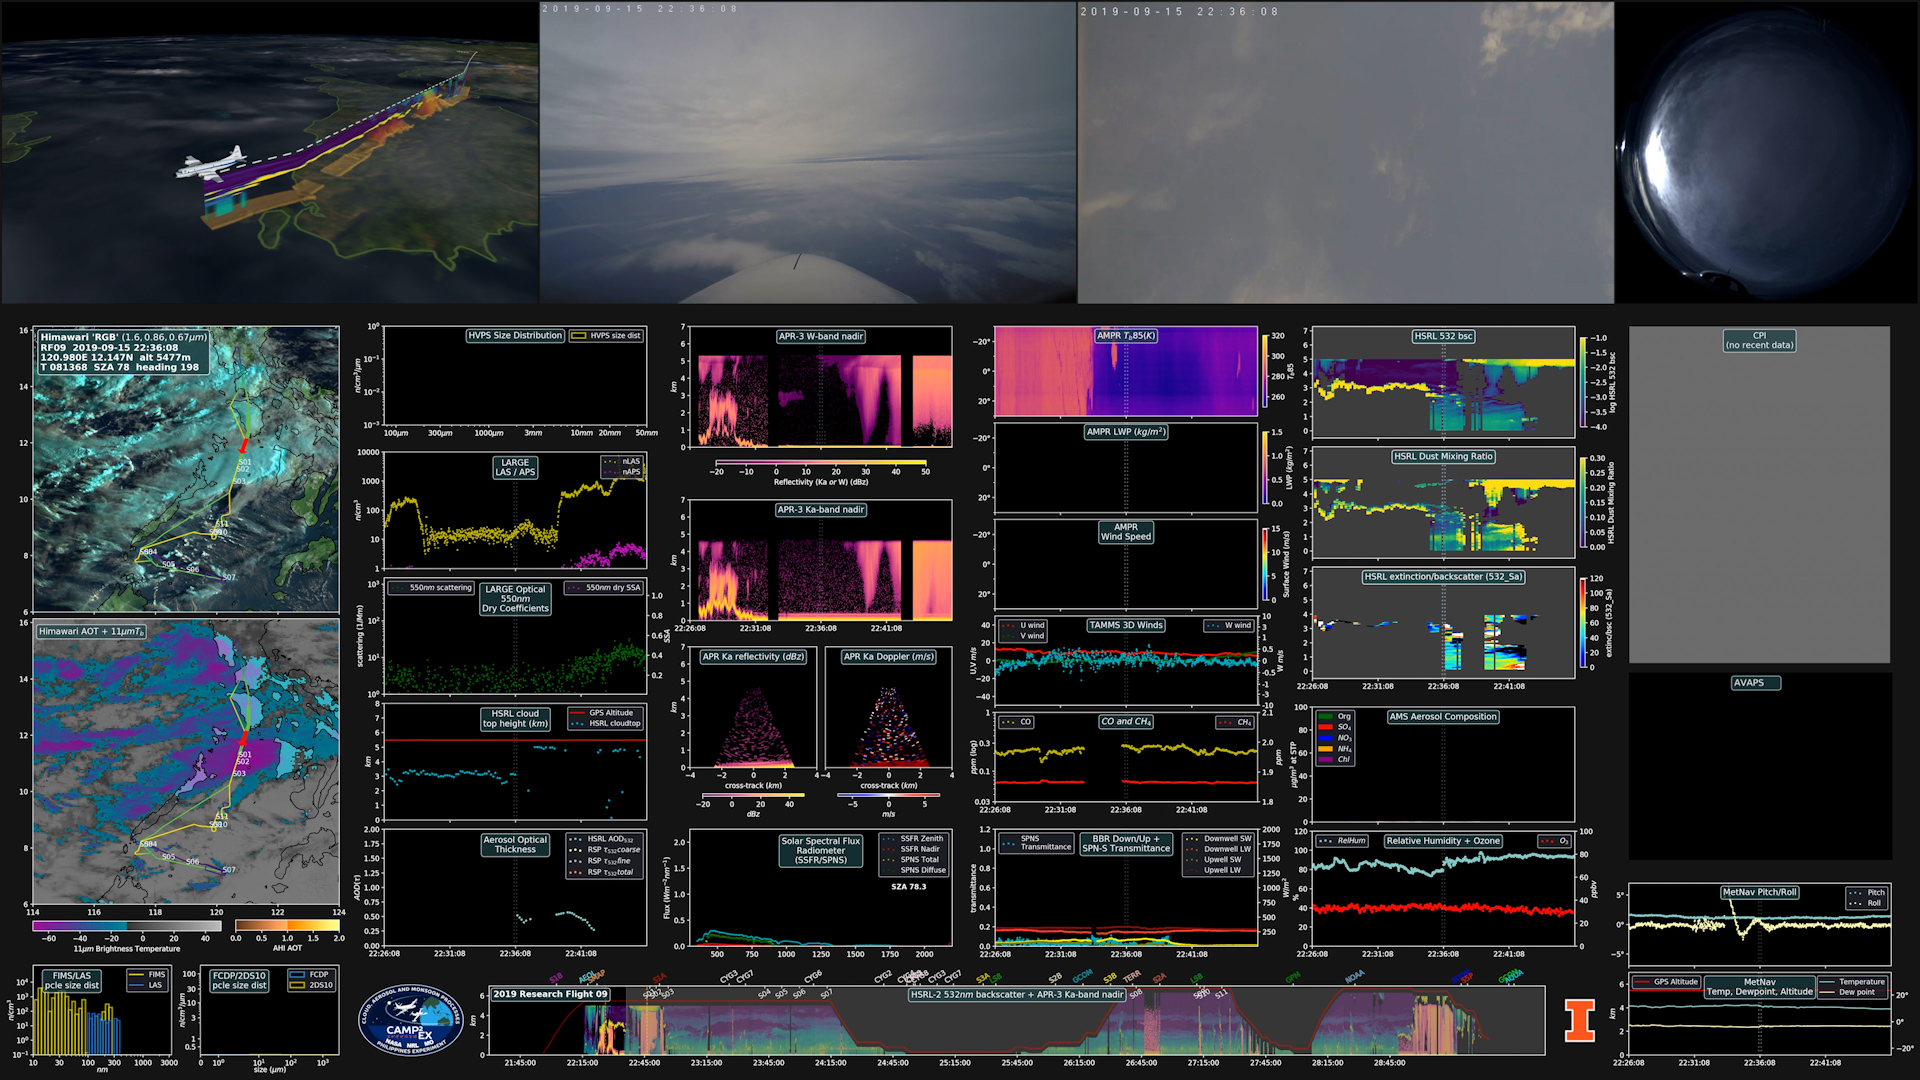
“In one place, you have all the information you need to locate patterns between these different data sets,” said Stuart Levy, a senior programmer and system administrator at AVL. “As the video plays, the data in the dashboard changes in real time, so you can see exactly when and where a certain data point appeared in the record.”
“These visualizations could revolutionize how we communicate our data to other researchers and members of the public. It could make field data easier to understand for anyone interested in fundamental research,” said Di Girolamo.
Kalina Borkiewicz, a senior research programmer at AVL, noted that, “The scope of this project made it unique. We had to work with data from numerous instruments in different spatial scales, temporal scales and data formats. Making sure the final product was seamless took a lot of work.”
The visualizers used the Blue Waters Supercomputer at the National Center for Supercomputing Applications to generate 216,000 individual images and more than 1.5 million intermediate images, which they stitched together into a product package that organized the CAMP2Ex data visually across space and time.
“We’re excited for the possibility of organizing our other datasets like this and sharing this process with other researchers handling Earth-science data,” said Di Girolamo.
NASA’s Advanced Information Systems Technology (AIST) program identifies, develops, and supports novel software and information systems like the CAMP2Ex visualization process that will help Earth scientists learn more about the world we live in.
Download this video in HD formats from NASA Goddard’s Scientific Visualization Studio
By Gage Taylor
NASA’s Earth Science Technology Office
Media Contact: Ellen Gray