


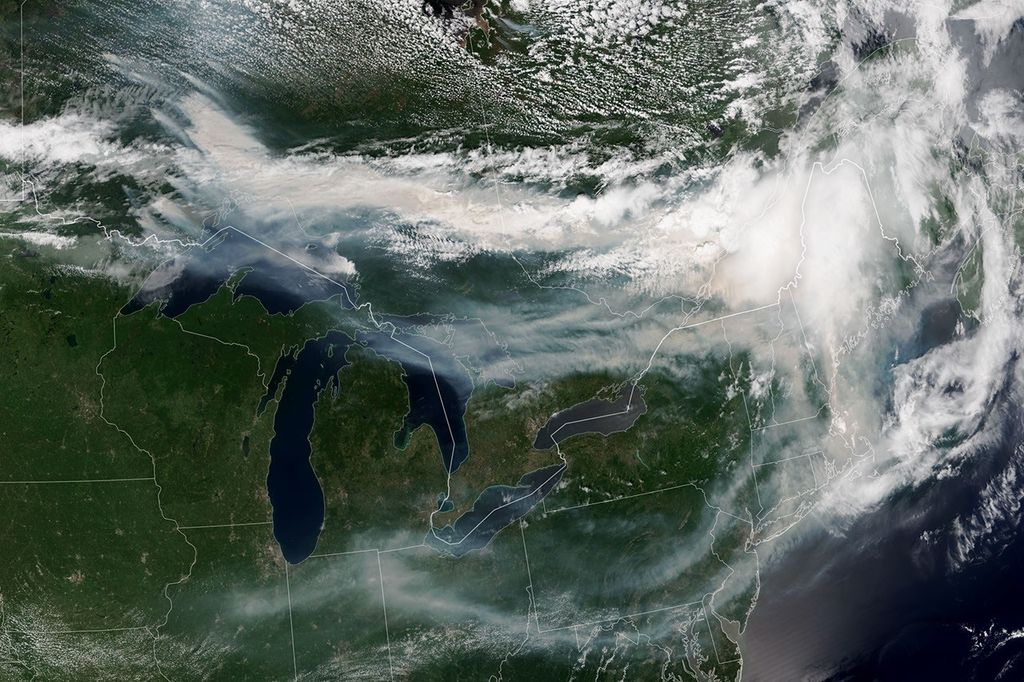


New findings have revealed a coastal realm highly sensitive to changes in runoff and rainfall on land.
After helping stoke record heat in 2023 and drenching major swaths of the United States this winter, the current El Niño is losing steam this spring. Scientists have observed another way that the climate phenomenon can leave its mark on the planet: altering the chemistry of coastal waters.
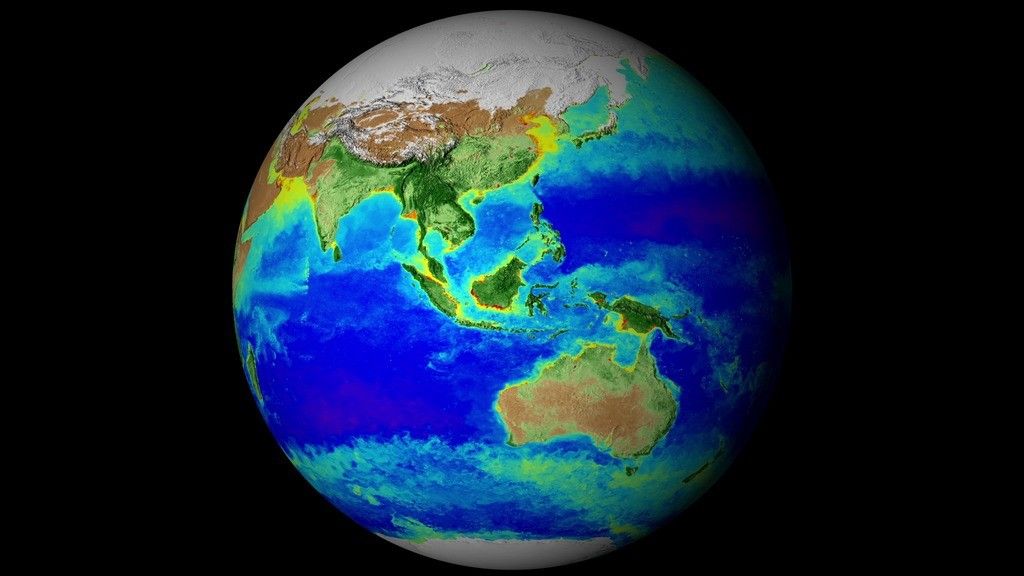
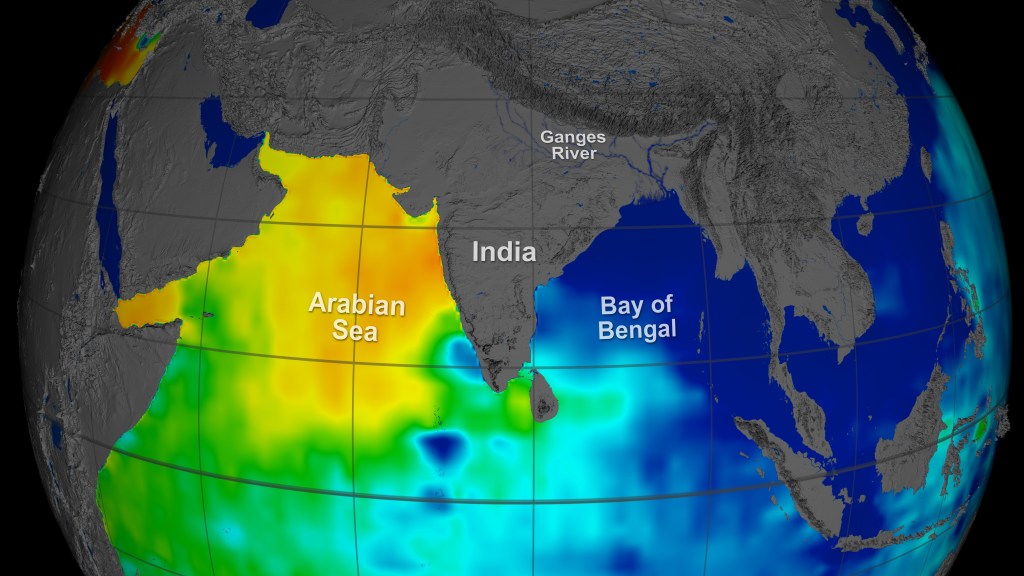
A team at NASA’s Jet Propulsion Laboratory in Southern California used satellite observations to track the dissolved salt content, or salinity, of the global ocean surface for a decade, from 2011 to 2022. At the sea surface, salinity patterns can tell us a lot about how freshwater falls, flows, and evaporates between the land, ocean, and atmosphere – a process known as the water cycle.
The JPL team showed that year-to-year-variations in salinity near coastlines strongly correlate with El Niño Southern Oscillation (ENSO), the collective term for El Niño and its counterpart, La Niña. ENSO affects weather around the world in contrasting ways. El Niño, linked to warmer-than-average ocean temperatures in the equatorial Pacific, can lead to more rain and snowfall than normal in the southwestern U.S., as well as drought in Indonesia. These patterns are somewhat reversed during La Niña.
During the exceptional El Niño event of 2015, for example, the scientists traced a particularly distinct global water cycle effect: Less precipitation over land led to a decrease in river discharge on average, which in turn led to notably higher salinity levels in areas as far as 125 miles (200 kilometers) from shore.
At other times, the opposite was found: Areas with higher-than-normal rainfall over land saw increased river discharge, reducing salinity near those coasts.
“We’re able to show coastal salinity responding to ENSO on a global scale,” said lead author Severine Fournier, an ocean physicist at JPL.
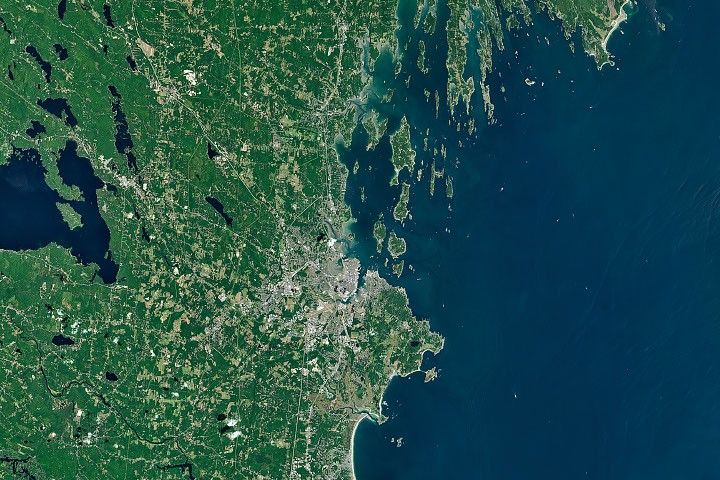
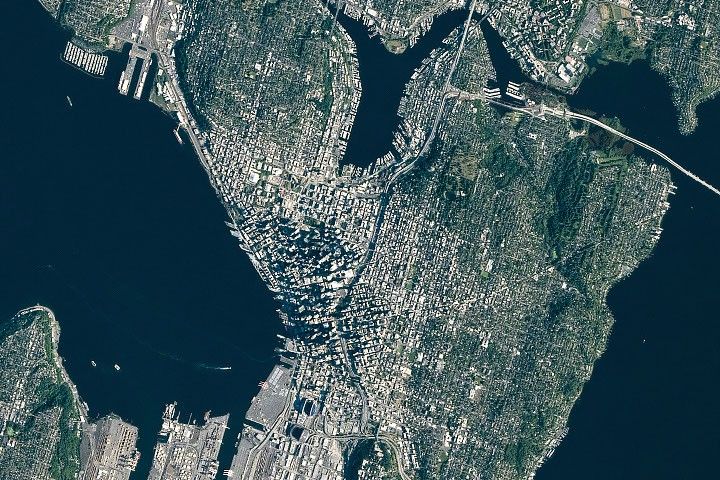
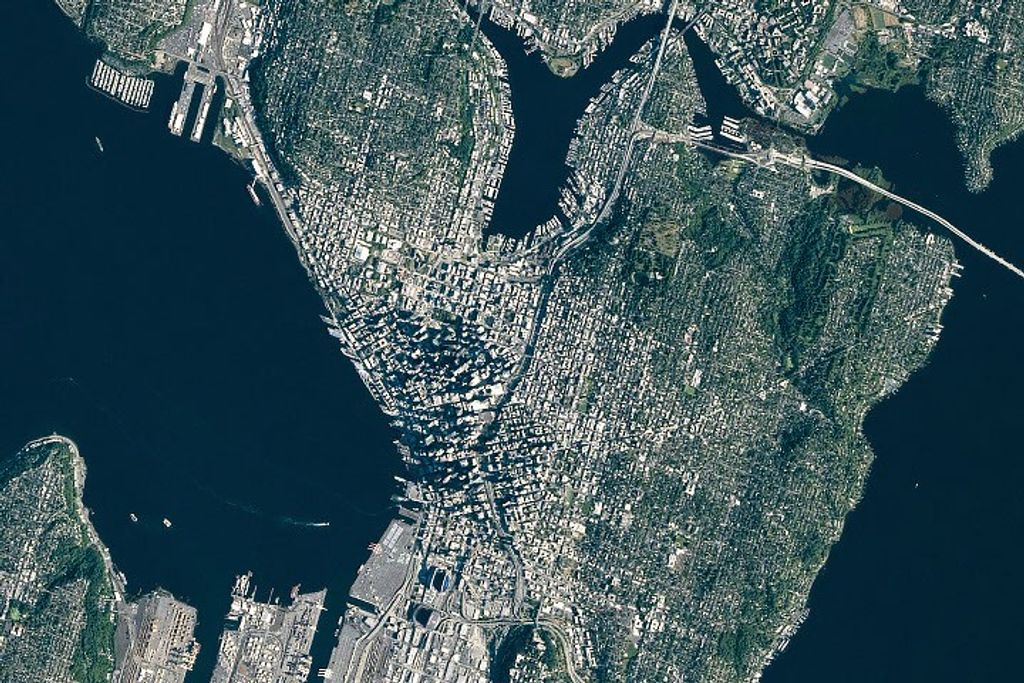
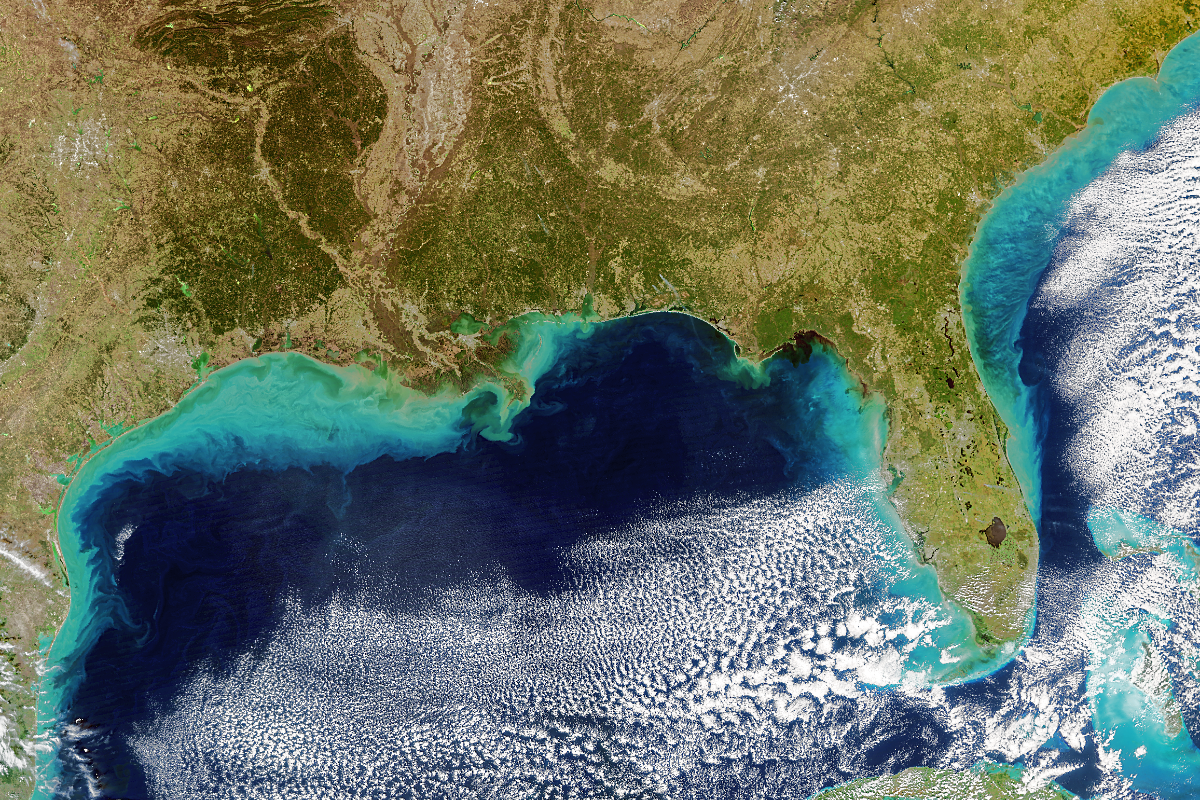
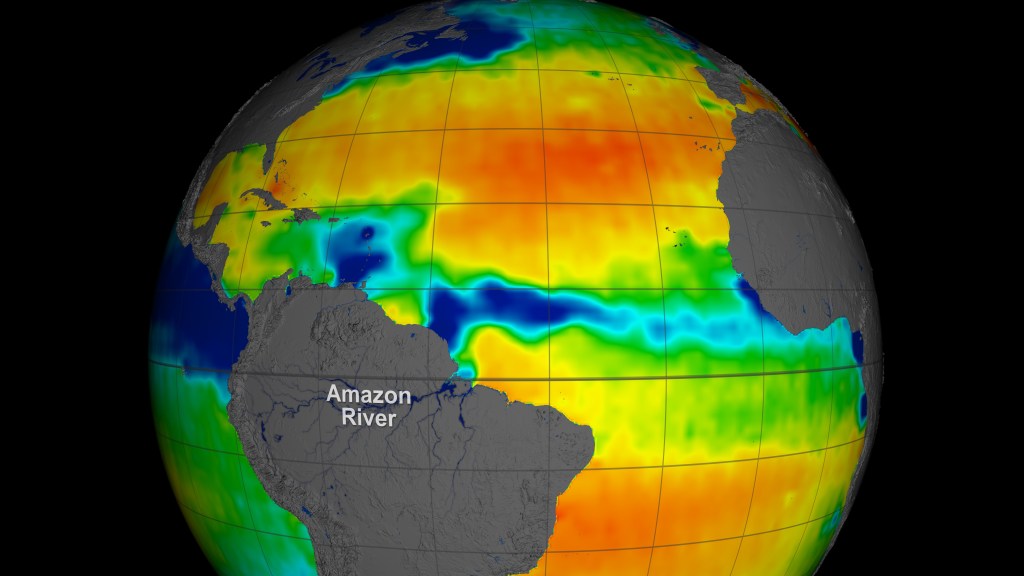
The team found that salinity is at least 30 times more variable in these dynamic zones near coasts than in the open ocean. The link between rain, rivers, and salt is especially pronounced at the mouths of large river systems such as the Mississippi and Amazon, where freshwater plumes can be mapped from space as they gush into the ocean.
Salt as Signal
With global warming, researchers have been observing changes in the water cycle, including increases in extreme precipitation events and runoff. At the intersection of land and sea, coastal waters may be where the impacts are most detectable.
“Given the sensitivity to rainfall and runoff, coastal salinity could serve as a kind of bellwether, indicating other changes unfolding in the water cycle,” Fournier said.
She noted that some of the world’s coastal waters are not well studied, despite the fact that about 40% of the human population lives within about 60 miles (100 kilometers) of a coastline. One reason is that river gauges and other on-sitemonitors can be costly to maintain and cannot provide coverage of the whole planet, especially in more remote regions.
That’s where satellite instruments come in. Launched in 2011, the Aquarius mission made some of the first space-based global observations of sea surface salinity using extremely sensitive radiometers to detect subtle changes in the ocean’s microwave radiation emissions. Aquarius was a collaboration between NASA and Argentina’s space agency, CONAE (Comisión Nacional de Actividades Espaciales).
Today, two higher-resolution tools – the ESA (European Space Agency) Soil Moisture and Ocean Salinity (SMOS) mission and NASA’s Soil Moisture Active Passive (SMAP) mission – allow scientists to zoom to within 25 miles (40 kilometers) of coastlines.
Using data from all three missions, the researchers found that surface salinity in coastal waters reached a maximum global average (34.50 practical salinity units, or PSU) each March and fell to a minimum global average (34.34 PSU) around September. (PSU is roughly equal to parts per thousand grams of water.) River discharge, especially from the Amazon, drives this timing.
In the open ocean, the cycle is different, with surface salinity reaching a global average minimum (34.95 PSU) from February to April and a global average maximum (34.97 PSU) from July to October. The open ocean does not show as much variability between seasons or years because it contains a significantly larger volume of water and is less sensitive to river discharge and ENSO. Instead, changes are governed by planet-scale precipitation minus total global evaporation, plus other factors like large-scale ocean circulation.
The study was published in the journal Geophysical Research Letters.
News Media Contacts
Jane J. Lee / Andrew Wang
Jet Propulsion Laboratory, Pasadena, Calif.
818-354-0307 / 626-379-6874
jane.j.lee@jpl.nasa.gov / andrew.wang@jpl.nasa.gov
Written by Sally Younger
2024-035