


![Request for Information – Potential [Placeholder for Prize]](https://assets.science.nasa.gov/dynamicimage/assets/science/missions/a-step/FFR_Earth_Background_20251120%20.png?w=1024)


Science
Examples of Common Projects
-
Vertical Profiles at RRV, NV
AJAX has a long-term record of measurements over Railroad Valley (RRV), NV since June 2011 with the primary purpose of collecting GHG measurements for validation of GOSAT and OCO-2 satellite data products. RRV is a desert playa site in Nevada (38.497◦ N, 115.691◦ W,
1435 m above mean sea level) used to calibrate various satellite radiometers due to its high reflectance and its uniform, high-altitude desert site where local sources and sinks are expected to be minimal. AJAX data is used to validate different algorithms for GOSAT and OCO-2 data retrieval. Lengthening the data record allows for further validation as satellites evolve over their mission lifetimes, providing a unique dataset and a powerful asset for the development of additionally vertically resolved data products in the future. (Tadić et al., 2014; Tanaka et al., 2016)

-
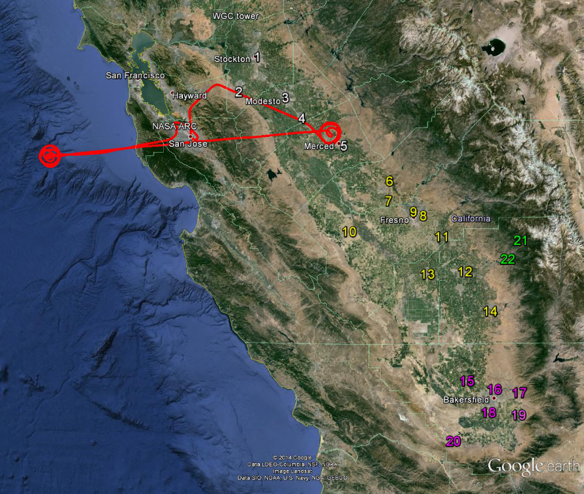
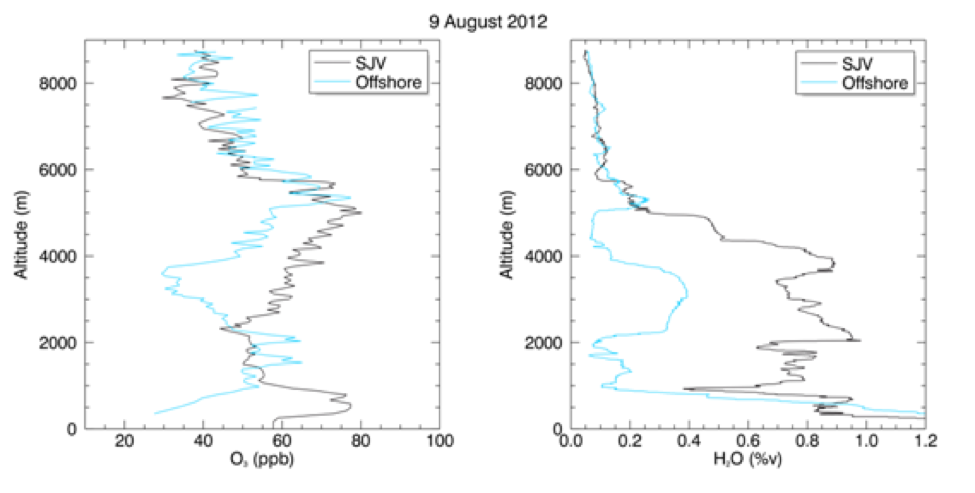
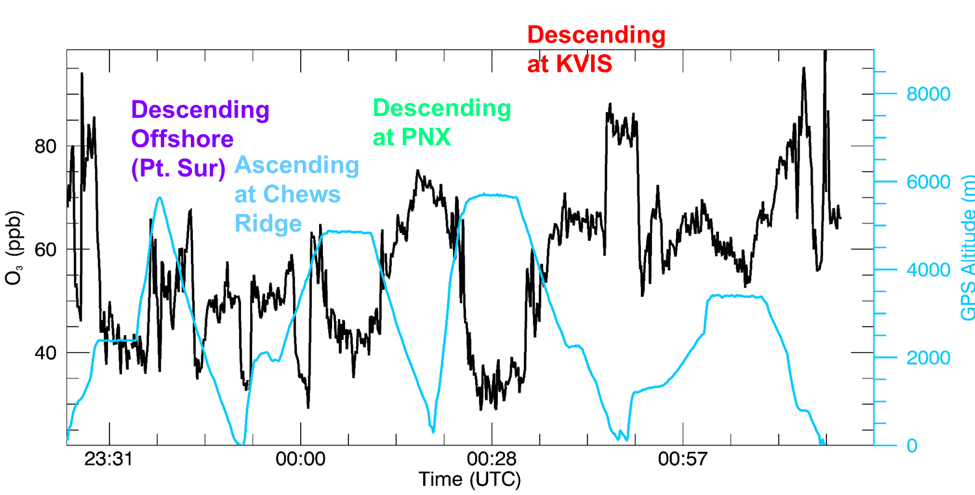
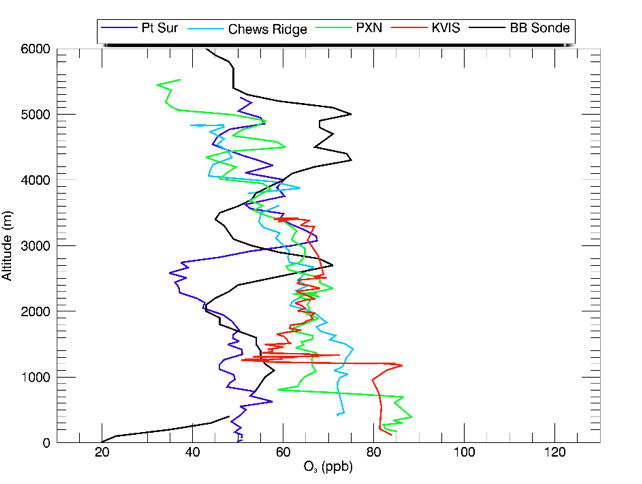
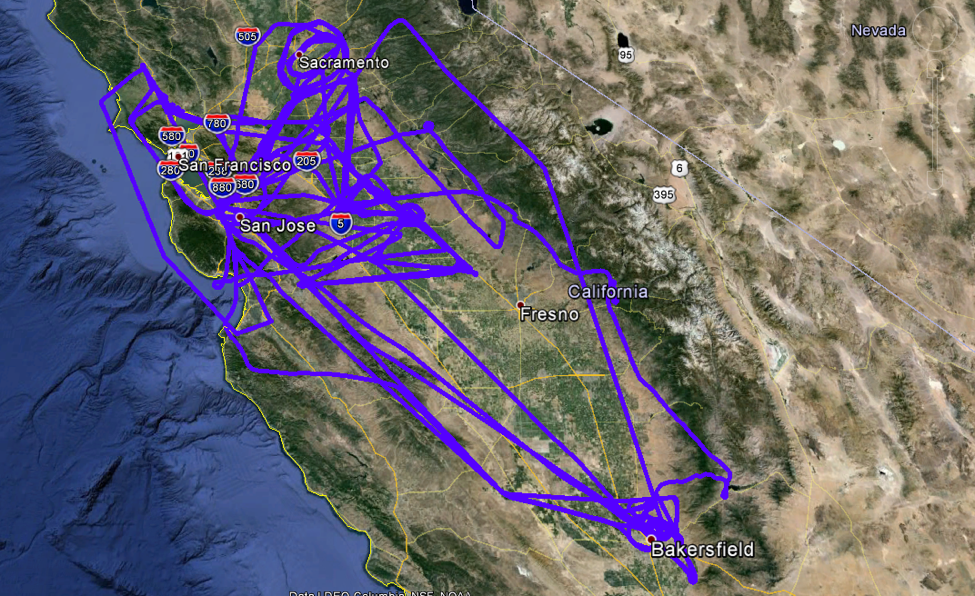
Paired Vertical Profiles Over Pacific (Offshore) and SJV (Onshore)
Measuring onshore and offshore vertical profiles to assess the seasonality and magnitude of net ozone production and transport within the lower troposphere above the San Joaquin Valley (designated as an “extreme exceedance area” by EPA). A typical flight path is shown in the Figure below (the red line): Take off from Moffett Field, transit to a location in the SJV (Merced (37.380⁰ N, 120.568⁰ W) or Walnut Grove (38.264⁰ N, 121.490⁰ W)), perform a vertical profile over the SJV, transit to the offshore location (EUGEN (37.0835⁰ N, 122.434⁰ W) or RAINS (37.167⁰ N, 123.234⁰ W)), perform a second vertical profile, transit to and land at Moffett Field. The typical time between the end (lowest altitude) of the first profile and the start (highest altitude) of the second profile was ~20 minutes, this time difference has negligible effects on ozone levels (determined from previous reproducibility tests) and hence the two profiles are thought of as being more or less simultaneous. AJAX provides a snapshot of the atmosphere above two different surface sites at one time. The differences between the two vertical profiles allow us to estimate net ozone productivity and changes in tropospheric transport between the two sites. (Yates et al., 2014).
-
CABOTS
California’s Unique Challenges
• Limited data to check global models which provide boundary conditions
• San Joaquin Valley is an extreme non-attainment region for ozone
Objectives of CABOTS
• Better understand how well global models reproduce the content and daily variability of ozone vertical profiles.
• Understand the extent and impact of long-range (trans-Pacific) transport on surface sites in the SJV.
Cornerstone Measurements
• Near-daily ozonesondes (balloon) from Bodega Bay (SJSU)
• NOAA’s TOPAZ lidar at Visalia.
• Airborne measurements linked ozonesondes and lidar measurements.

-
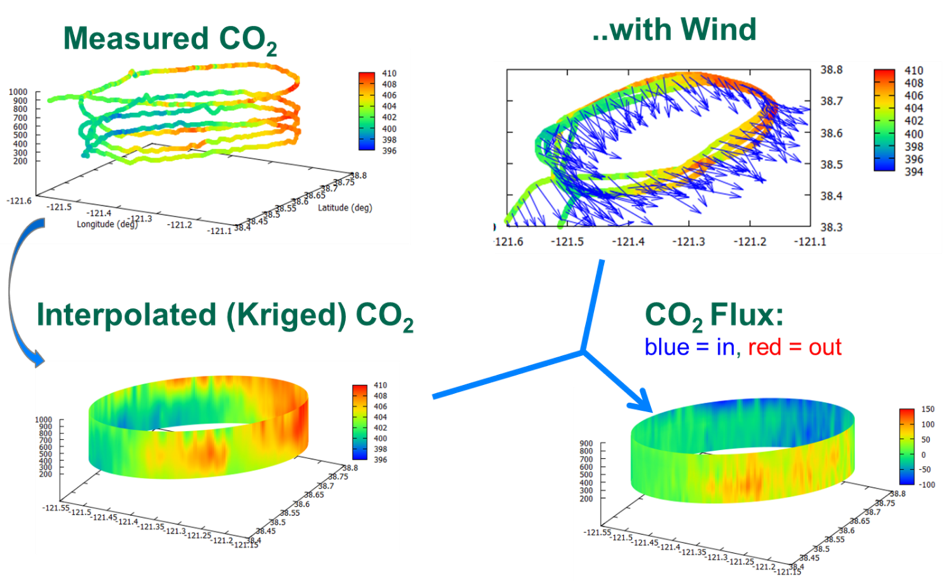
Sampling Emissions From Urban Centers
Sampling and quantifying emissions from urban centers. Elevated concentrations of greenhouse gases (GHGs) and other pollutants over cities have been described as “urban domes”. With increasing urbanization and migration of people towards cities, how best to quantify these emissions is a new and exciting topic of research. AJAX has conducted regular flights, through different seasons and years around Sacramento urban area. We have developed a flight plan which takes advantage of our fast airspeeds to essentially capture a snapshot image of emissions over Sacramento. We fly circular loops around the urban area at different altitudes and measure emissions and wind direction upwind and downwind of the city. The Figure below shows how CO2 and wind measurements can be combined and interpolated (through a process known as kriging) to produce a flux map around the city and enable us to quantify GHG fluxes from Sacramento, through different seasons and over different years.
-
Sampling SJV Boundary Layer
The State of California continues to implement procedures to reduce short-lived climate pollutants, including methane. California’s executive order B-30-15 targets emission reductions to 40 % below 1990 levels by 2030 (with ultimate goal of 80 % below 1990 levels by 2050). However, sources of methane are not well quantified and there are considerable disagreements between observations and reported emission inventories. The rural San Joaquin Valley is a significant source of methane from livestock and agriculture, AJAX measurements within the San Joaquin Valley boundary layer indicate the spatial variability in methane, highlighting local “hot spots’. Combined airborne measurements and modeled data allows for model verification and can identify methane emissions. Previous combined AJAX measurements and GEOS-Chem modelling has indicated large under-predictions of methane emissions by current emission inventories for the San Joaquin Valley from waste, gas and oil and particularly from livestock (Johnson et al., Johnson et al., 2016). This data emphasizes the need to better quantify methane emissions, particularly from diary livestock in order to improve our knowledge of present-day and future methane emissions to enhance our understanding of the effectiveness of control strategies to reduce GHG emissions from California.
-
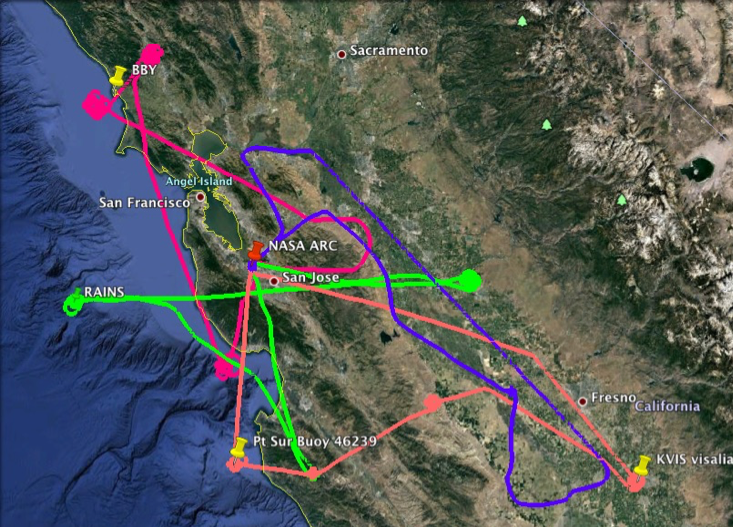
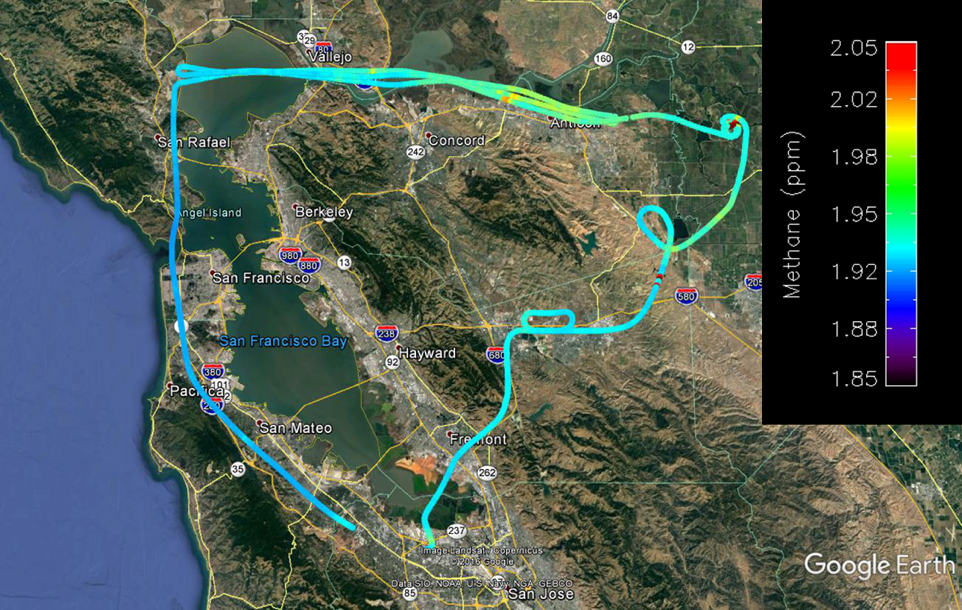
Sampling SFBA Boundary Layer and Landing/Take Off From Moffett Field
AJAX flies in/out of NASA Ames Research Center, Moffett Field (based in south San Francisco Bay Area) and conducts regular low altitude flights targeting SFBA boundary layer emissions. This flight data can be used to develop a spatially-resolved map of methane for SFBA and to locate “hot spots”. The long-term AJAX record provides a time-series of emission changes in the area. Example of SFBA flight is shown below where a hot spot of methane is identifiable in the Delta region (top, right section of the map), near Pittsburg and McDonald Island and close to Livermore (middle, right section of map). Combing AJAX and other ground-based and satellite based measurements of methane along with models can be used to better quantify emissions in this region.
-
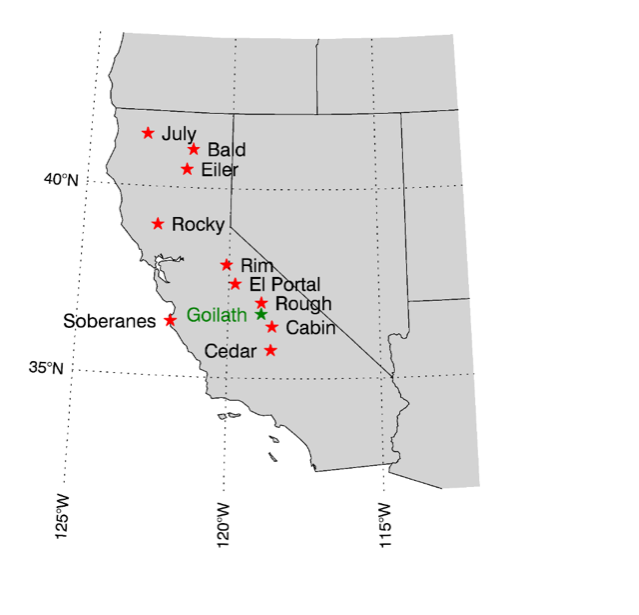
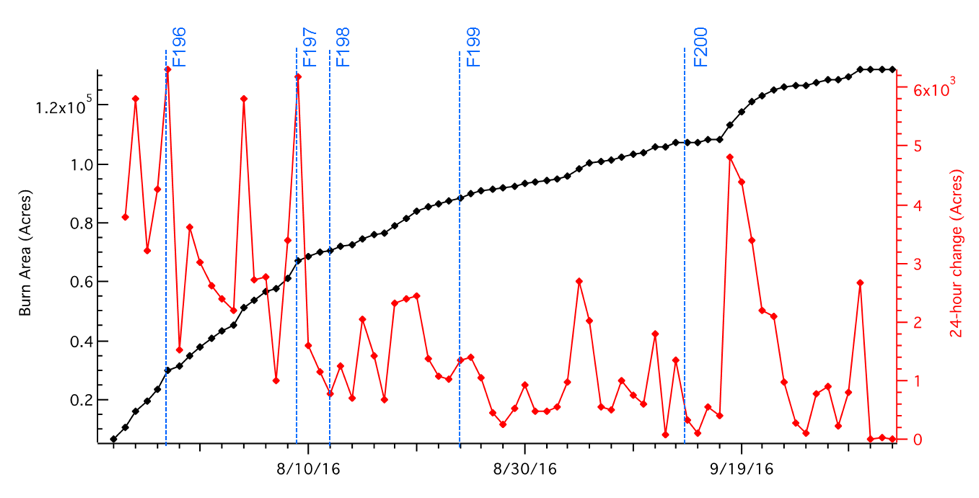
Forest Fires
Background in Recent Years
• Fuel accumulation due to historic aggressive fire suppression
• Tree mortality from fires, drought & insect
• Drought has caused extremely low live fuel moistures
• Extreme temperature
Have led to the increasing occurrence of “Megafires” within the western US. AJAX has been sampling emissions from wildfires in California since the 2013 Yosemite Rim fire (Yates et al., 2016). Over the last 4 summers AJAX has sampled emissions from 11 different fires, with some fires sampled more than once, with a total of 17 AJAX flights targeting emission sampling from fires.