


Using new, high-resolution global satellite maps of air quality indicators, NASA scientists tracked air pollution trends over the last decade in various regions and 195 cities around the globe. The findings were presented Monday at the American Geophysical Union meeting in San Francisco and published in the Journal of Geophysical Research.
“These changes in air quality patterns aren’t random,” said Bryan Duncan, an atmospheric scientist at NASA’s Goddard Space Flight Center in Greenbelt, Maryland, who led the research. “When governments step in and say we’re going to build something here or we’re going to regulate this pollutant, you see the impact in the data.”
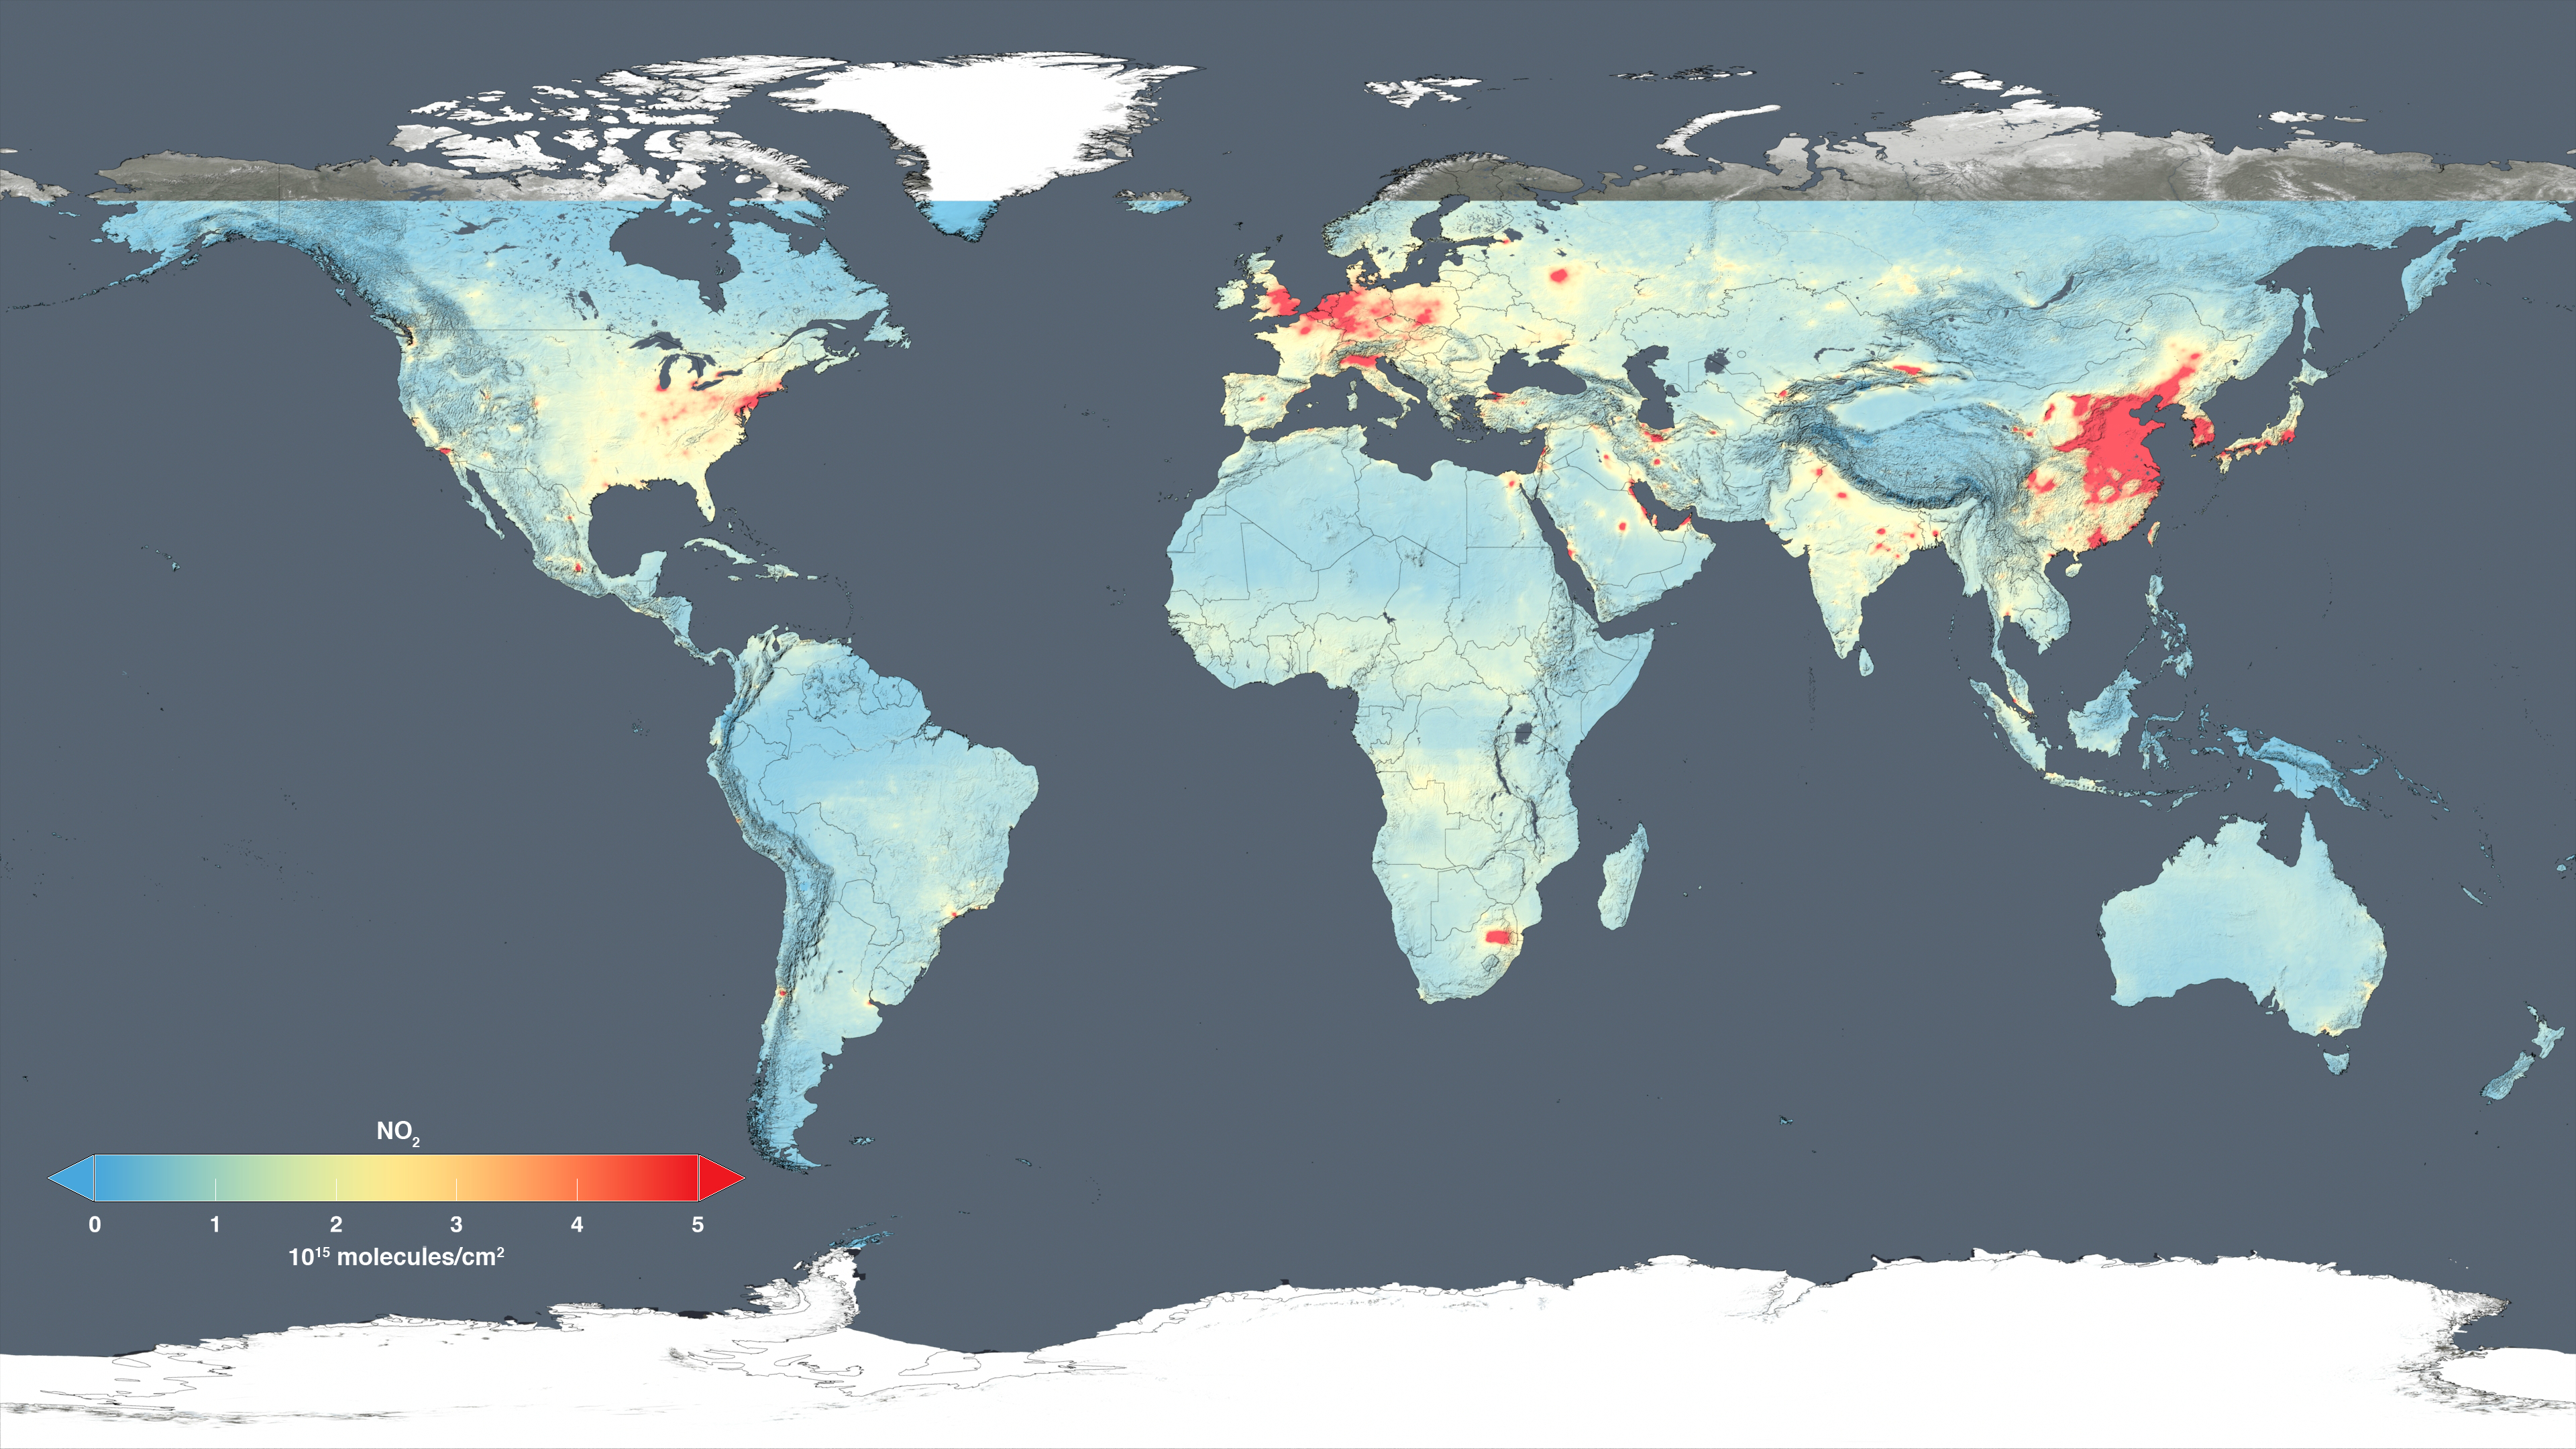
Duncan and his team examined observations made from 2005 to 2014 by the Dutch-Finnish Ozone Monitoring Instrument aboard NASA’s Aura satellite. One of the atmospheric gases the instrument detects is nitrogen dioxide, a yellow-brown gas that is a common emission from cars, power plants and industrial activity. Nitrogen dioxide can quickly transform into ground-level ozone, a major respiratory pollutant in urban smog. Nitrogen dioxide hotspots, used as an indicator of general air quality, occur over most major cities in developed and developing nations.
The science team analyzed year-to-year trends in nitrogen dioxide levels around the world. To look for possible explanations for the trends, the researchers compared the satellite record to information about emission controls regulations, national gross domestic product and urban growth.
“With the new high-resolution data, we are now able to zoom down to study pollution changes within cities, including from some individual sources, like large power plants,” said Duncan.
Previous work using satellites at lower resolution missed variations over short distances. This new space-based view offers consistent information on pollution for cities or countries that may have limited ground-based air monitoring stations. The resulting trend maps tell a unique story for each region.
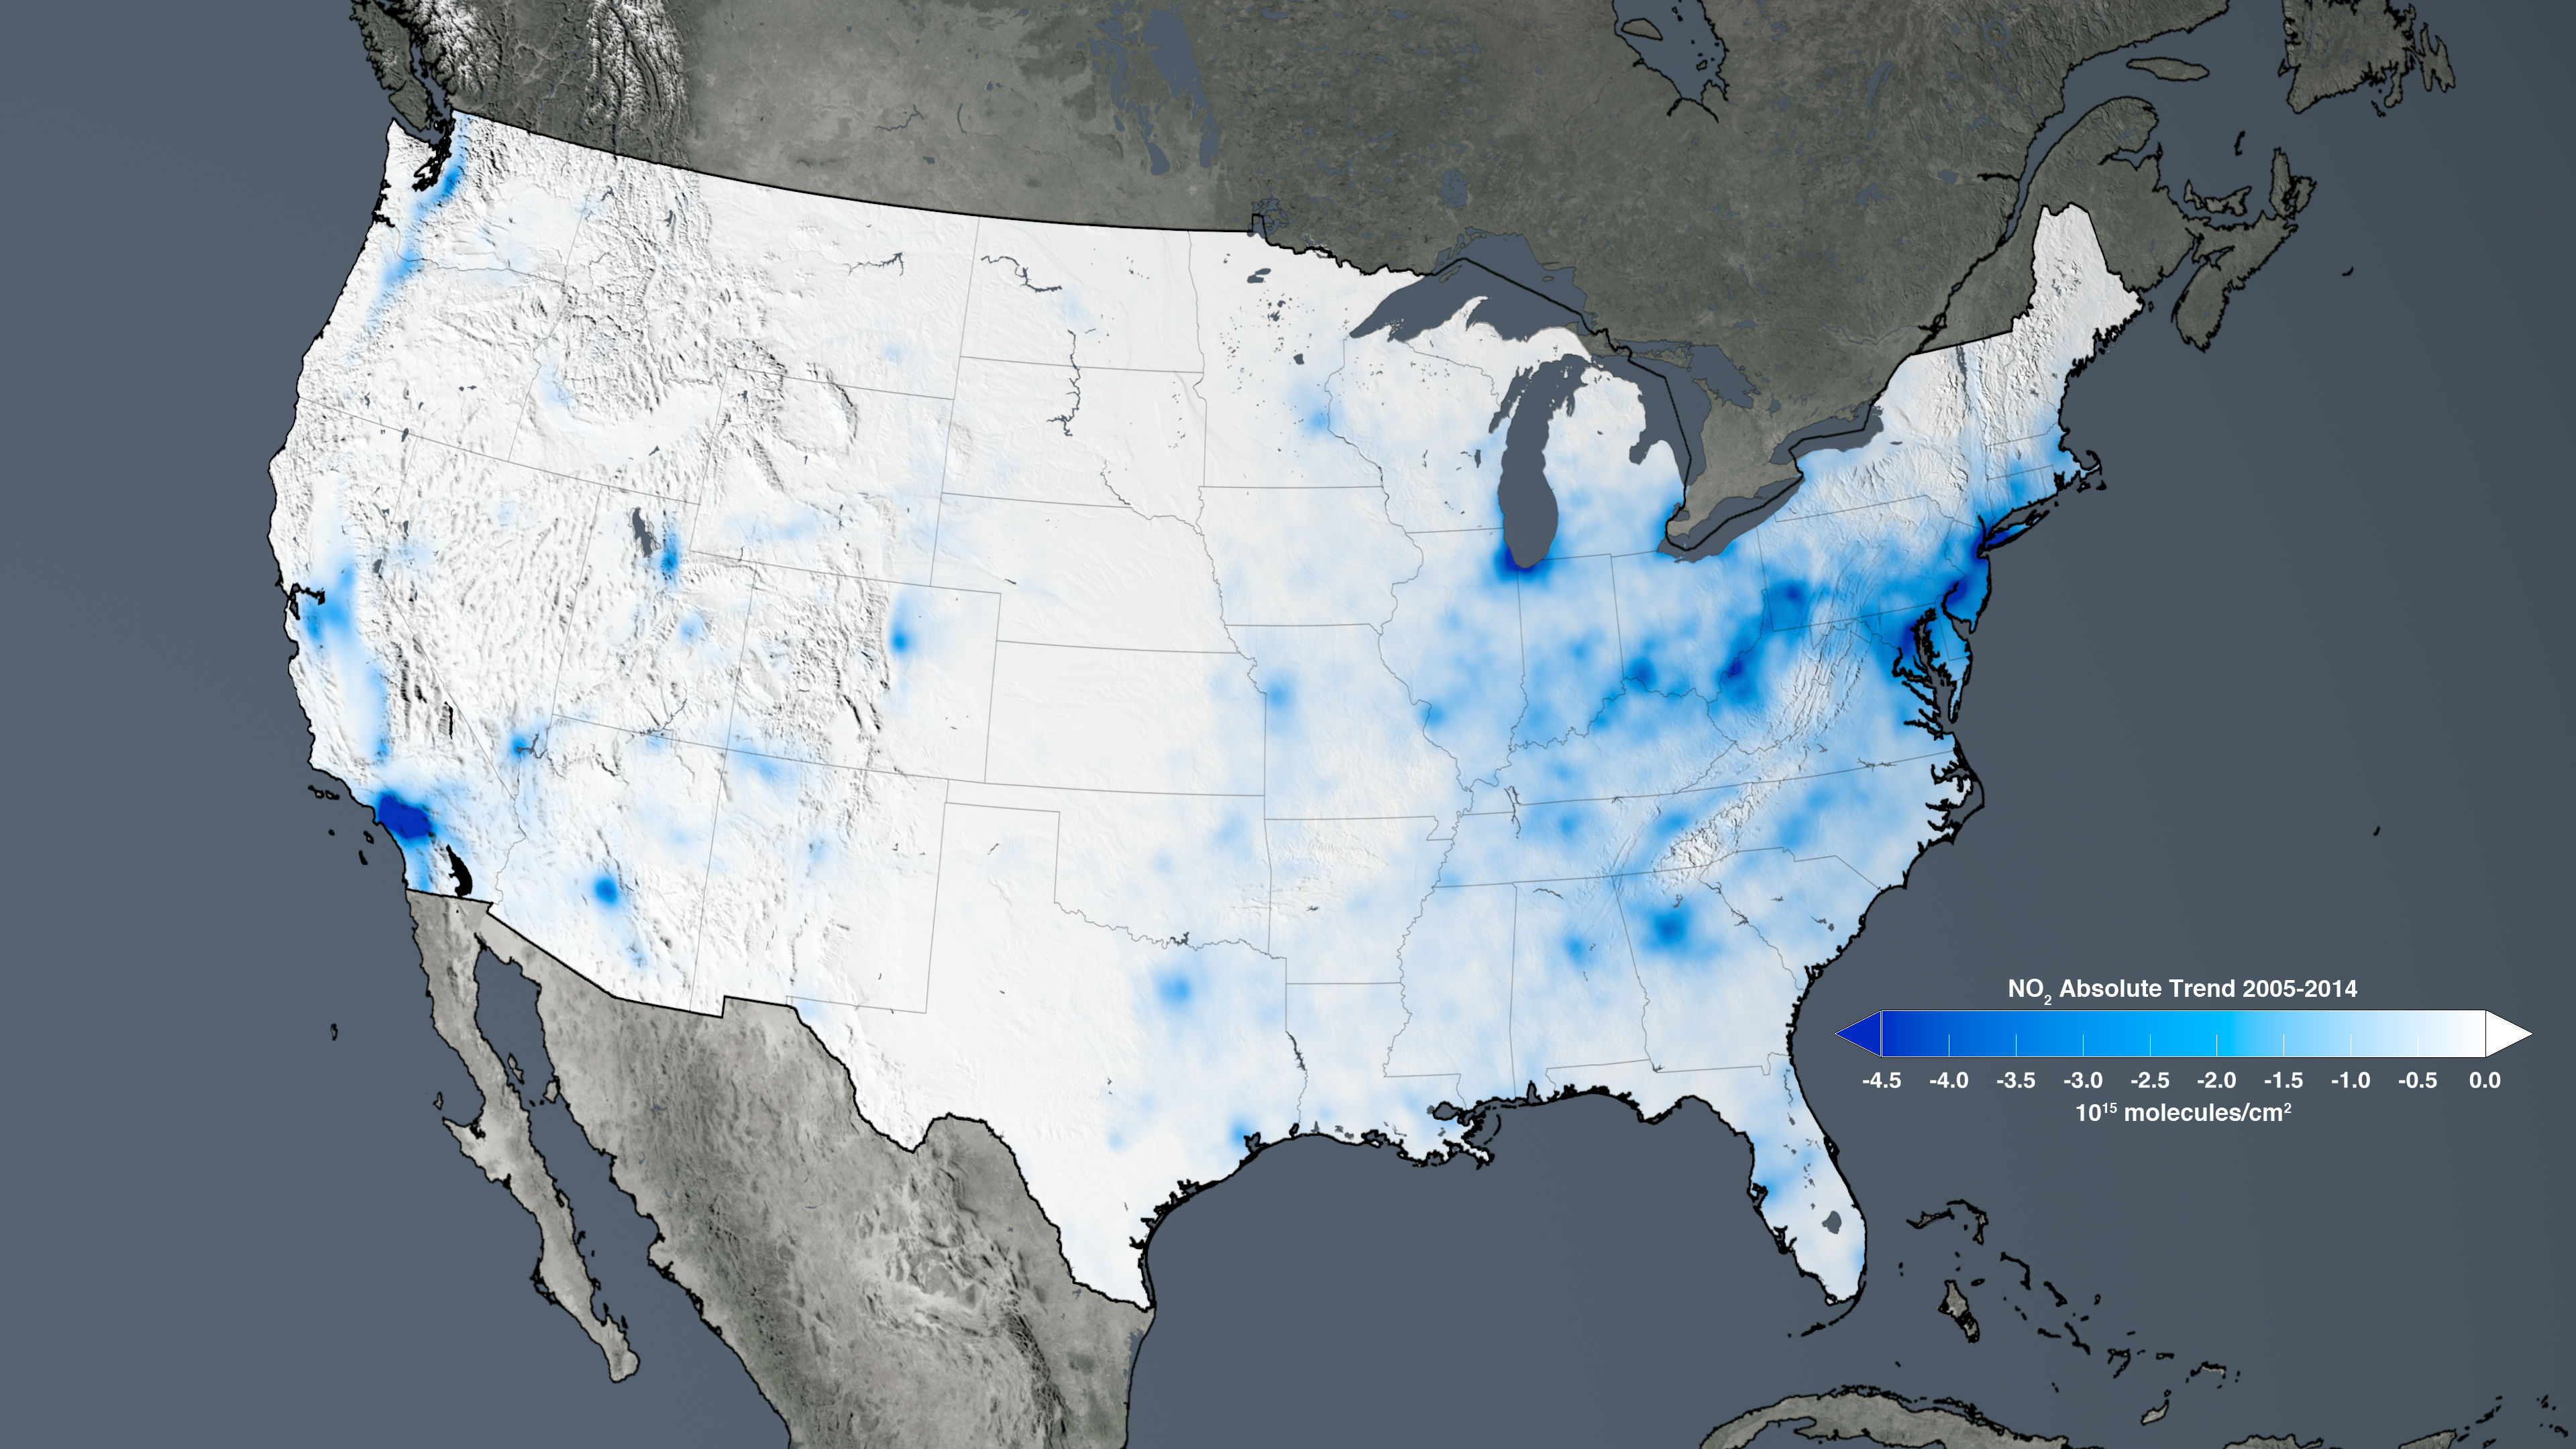
The United States and Europe are among the largest emitters of nitrogen dioxide. Both regions also showed the most dramatic reductions between 2005 and 2014. Nitrogen dioxide has decreased from 20 to 50 percent in the United States, and by as much as 50 percent in Western Europe. Researchers concluded that the reductions are largely due to the effects of environmental regulations that require technological improvements to reduce pollution emissions from cars and power plants.
China, the world’s growing manufacturing hub, saw an increase of 20 to 50 percent in nitrogen dioxide, much of it occurring over the North China Plain. Three major Chinese metropolitan areas — Beijing, Shanghai, and the Pearl River Delta — saw nitrogen dioxide reductions of as much as 40 percent.
The South African region encompassing Johannesburg and Pretoria has the highest nitrogen dioxide levels in the Southern Hemisphere, but the high-resolution trend map shows a complex situation playing out between the two cities and neighboring power plants and industrial areas.
“We had seen seemingly contradictory trends over this area of industrial South Africa in previous studies,” said Anne Thompson, co-author and chief scientist for atmospheric chemistry at Goddard. “Until we had this new space view, it was a mystery.”
The Johannesburg-Pretoria metro area saw decreases after new cars were required in 2008 to have better emissions controls. The heavily industrialized area just east of the cities, however, shows both decreases and increases. The decreases may be associated with fewer emissions from eight large power plants east of the cities since the decrease occurs over their locations. However, emissions increases occur from various other mining and industrial activities to the south and further east.
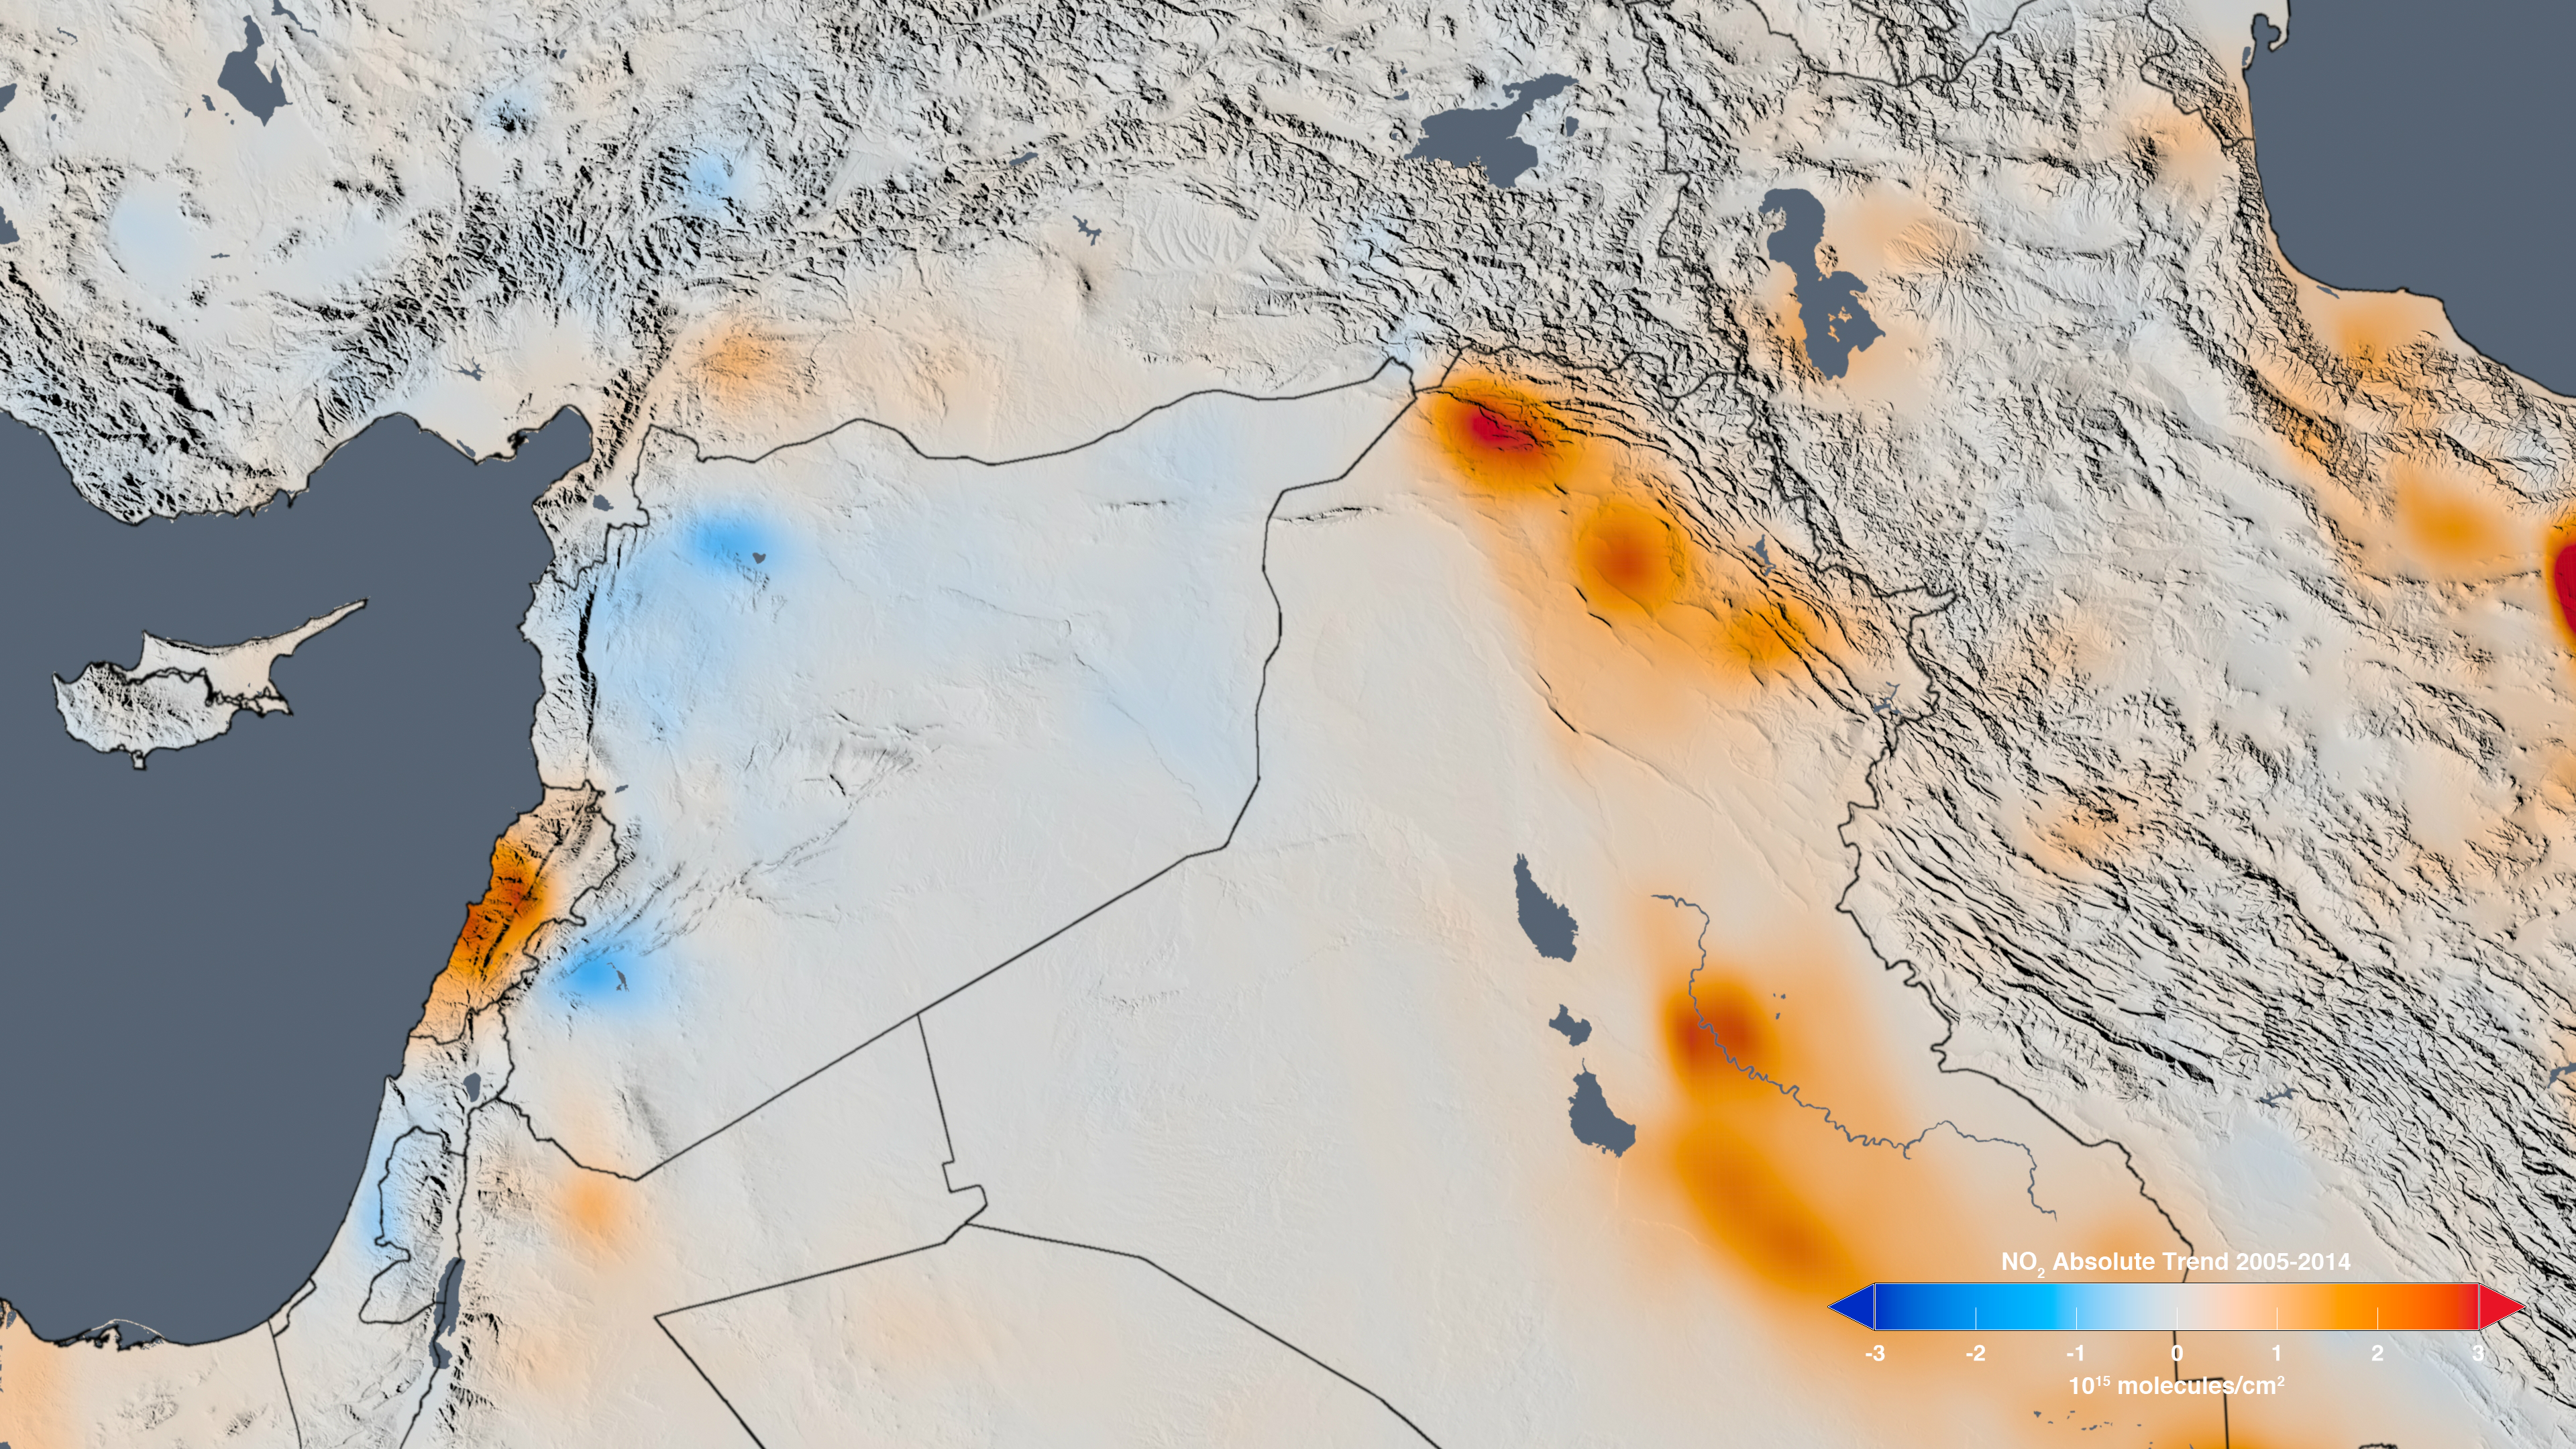
In the Middle East, increased nitrogen dioxide levels since 2005 in Iraq, Kuwait and Iran likely correspond to economic growth in those countries. However, in Syria, nitrogen dioxide levels decreased since 2011, most likely because of the civil war, which has interrupted economic activity and displaced millions of people.
To view and download high-resolution air quality maps, go to:
http://svs.gsfc.nasa.gov/12094
For more on NASA’s research into nitrogen dioxide, and air quality data for 195 cities, visit:
-end-
Steve Cole
Headquarters, Washington
202-358-0918
stephen.cole@nasa.gov
Ellen Gray
Goddard Space Flight Center, Greenbelt, Md.
301-286-1950 / 301-502-4064
ellen.t.gray@nasa.gov