


Audience
Educators
Grade Levels
Grades 9-12
Subject
Earth Science, Mathematics, Weather and Climate, Measurement and Data Analysis
Type
Data Sets
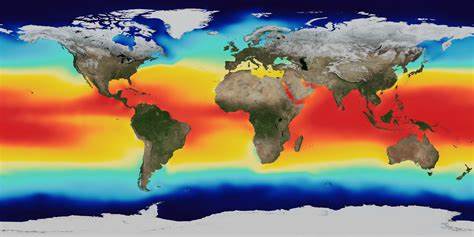
This dataset shows monthly changes in ocean heat content from 1992 to 2019, relative to 1992. Ocean heat content is shown for the entire water column, from the surface to the bottom of the ocean. Ocean heat content values are calculated using satellite observations, in-water instrument measurements, and ocean circulation computer models. Ocean heat content is an essential metric for understanding climate change and the Earth’s energy budget. The oceans are the dominant reservoir for the storage of heat in the climate system. The effects of ocean warming include sea level rise due to thermal expansion, coral bleaching, accelerated melting of Earth’s major ice sheets, intensified hurricanes, and changes in ocean health and biochemistry.
DATASHEET: Ocean Warming Monthly Variation (1992-2019) Dataset
Ocean Warming Monthly Variation Data Spreadsheet
Related Resource
NASA’s Earth Minute: Earth Has a Fever – Earth’s average temperature has risen over 1º F in the past century. It is projected to rise an additional 3º to 10º over the next 100 years. Data from NASA’s global network of satellites, airborne missions and surface monitoring systems is used to build climate models that help us understand the causes and effects of global warming.