


Audience
Educators
Grade Levels
Grades 5-8, Grades 9-12
Subject
Mathematics
Type
Websites
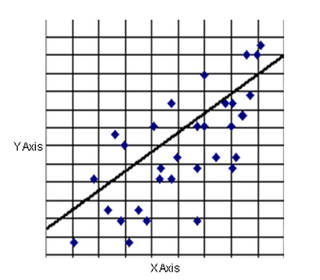
In this MY NASA DATA lesson, students learn how to read graphed data. This knowledge allows them to determine how two parameters are correlated to one another.
Go to Website