


.png?w=1024)


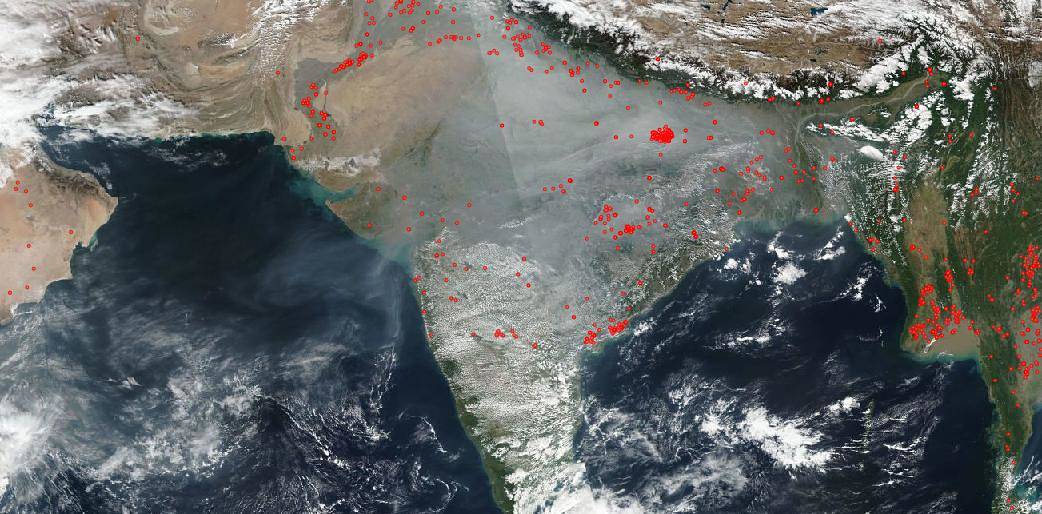
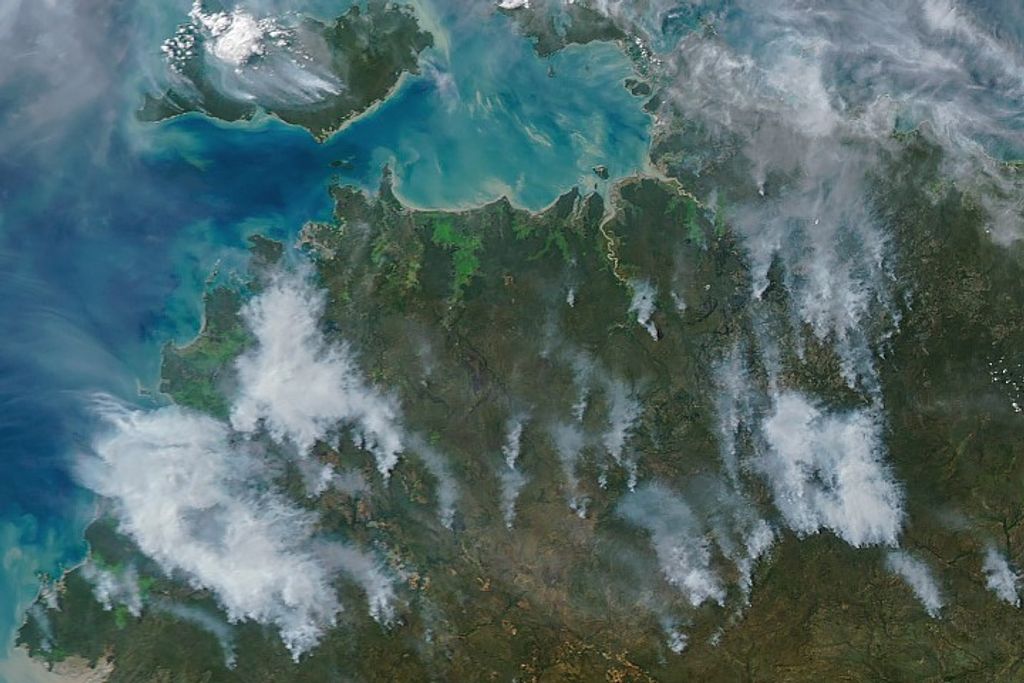
In this NOAA-NASA Suomi NPP satellite image taken by the Visible Infrared Imaging Radiometer Suite (VIIRS) instrument on Dec. 10, 2019, smoke and haze continue to shroud most of the country of India. NASA’s Earth Observatory wrote a detailed article which attributed the cause of the smoke over India to agricultural burning in its piece from November 06, 2019.
NASA’s Earth Observatory noted that: “While industrial pollution and dust can contribute to the haze, most of it comes from crop-burning—especially in the states of Punjab and Haryana, where rice and wheat are widely grown. Burning typically peaks during the first week of November, a time when many farmers set fire to leftover rice stalks and straw after harvest, a practice known as stubble or paddy burning. The burning often coincides with falling temperatures and slow wind speeds, meteorological conditions that can lead to temperature inversions, which trap smoke in place.”
A month later, the smoke still hangs in place as evidenced in this image taken today (Dec. 10, 2019). On December 09, 2019, the System of Air Quality and Weather Forecasting and Research (SAFAR) in India reported that air quality in Delhi on Dec. 09 was in the “very poor” category, with overall Air Quality Index (AQI) at 355 with PM2.5 being the dominant pollutant. PM2.5 is the combustion particles, organic compounds, metals etc. of the particulate matter that makes up the smoke. From the U.S. EPA website, knowing the types of particulate matter in smoke is important, as is the size of the matter, in this case, 2.5, because according to EPA: “Particulate matter contains microscopic solids or liquid droplets that are so small that they can be inhaled and cause serious health problems. Some particles less than 10 micrometers in diameter can get deep into your lungs and some may even get into your bloodstream. Of these, particles less than 2.5 micrometers in diameter, also known as fine particles or PM2.5, pose the greatest risk to health.” SAFAR reported on other areas in India that actually had higher AQI than Delhi: “At Ashok Vihar, the AQI was 391 at 7:30 am, same as in Jahangirpuri. While in Rohini it was 430, near Pusa, it was 385. The AQI near Sirifort, Mundka and DTU stood at 375, 376 and 381 respectively.” Any AQI over 401 is considered severe/hazardous according to SAFAR.
NASA’s satellite instruments are often the first to detect wildfires burning in remote regions, and the locations of new fires are sent directly to land managers worldwide within hours of the satellite overpass. Together, NASA instruments detect actively burning fires, track the transport of smoke from fires, provide information for fire management, and map the extent of changes to ecosystems, based on the extent and severity of burn scars. NASA has a fleet of Earth-observing instruments, many of which contribute to our understanding of fire in the Earth system. Satellites in orbit around the poles provide observations of the entire planet several times per day, whereas satellites in a geostationary orbit provide coarse-resolution imagery of fires, smoke and clouds every five to 15 minutes. For more information visit: https://www.nasa.gov/mission_pages/fires/main/missions/index.html
NASA’s Earth Observing System Data and Information System (EOSDIS) Worldview application provides the capability to interactively browse over 700 global, full-resolution satellite imagery layers and then download the underlying data. Many of the available imagery layers are updated within three hours of observation, essentially showing the entire Earth as it looks “right now.” Actively burning fires, detected by thermal bands, are shown as red points. Image Courtesy: NASA Worldview, Earth Observing System Data and Information System (EOSDIS). Caption: Lynn Jenner with information from the Earth Observatory, SAFAR, and the U.S. EPA website