


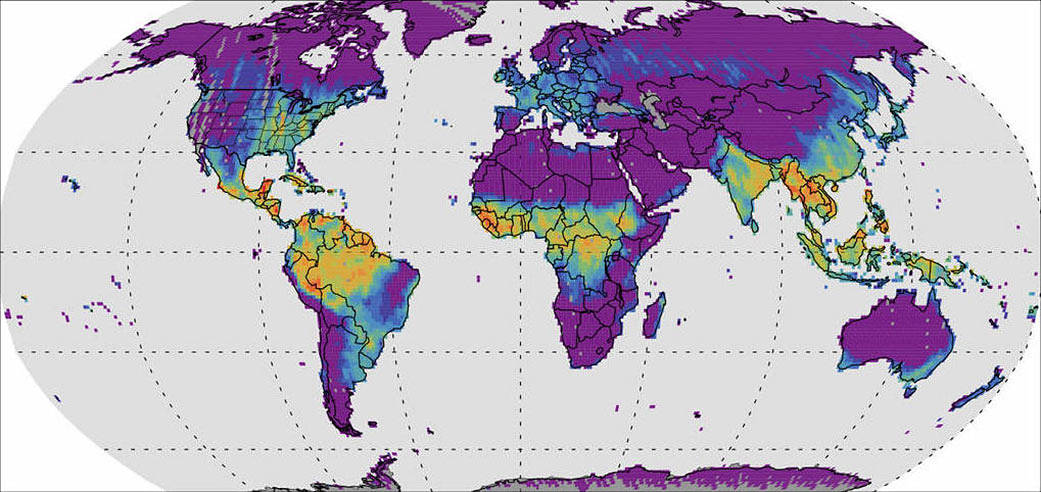
This map shows solar-induced fluorescence (SIF) measured by OCO-2 from Aug. through Oct. 2014.
This map shows solar-induced fluorescence (SIF) measured by OCO-2 from Aug. through Oct. 2014. The highest SIF rates are shown in red and yellow (for example, the Amazon in Southern Hemisphere spring), with blues and greens indicating less fluorescence and purple indicating none. OCO-3 will make dense measurements of SIF in the midlatitude and tropics. Credit: NASA/JPL-Caltech