


The Atmospheric Infrared Sounder (AIRS) is one of several instruments aboard NASA’s Aqua satellite. AIRS observes the Earth in infrared light, allowing scientists to determine the temperature structure of the atmosphere, cloud tops and surface. AIRS is one of many satellite instruments observing tropical cyclones in all the ocean basins. On July 15, AIRS gathered data on three tropical cyclones: Typhoon Nangka, Tropical Storm Enrique and Hurricane Dolores.
In addition to AIRS, there are instruments aboard NOAA satellites and satellites from other nations that also observe data in the infrared.
“Tropical cyclone” is a rapidly rotating storm system that forms almost exclusively over the warm waters of the tropics. It is characterized by strong winds, a low-pressure center and a spiral arrangement of thunderstorms that produce heavy rain. Depending on its location and strength it is classified as a tropical depression, tropical storm, hurricane or typhoons. Tropical cyclones get their energy through the evaporation of water from the ocean surface. The moist air rises, cools and condenses into clouds and rain. Tropical cyclones consist of hundreds of thunderstorms moving in a circular motion around a center in the lowest level of the atmosphere (near the surface).
AIRS observations of tropical cyclones determine the temperatures of the cloud tops in the convective regions (areas of rapidly rising air) that power these storms. The temperature of a cloud top is determined by its altitude and thus is an indicator of the strength of the convection forcing it higher into the atmosphere.
NASA research has determined that cloud tops with temperatures near -63 Fahrenheit or -53 Celsius have the ability to generate heavy rainfall (that’s over 1 inch or 25 millimeters per hour). When cloud top temperatures are colder than that, the thunderstorms are likely to reach higher in the atmosphere and are likely to be stronger. Conversely, if cloud top temperatures warm, that generally means the strength of the rising air is weaker, and the thunderstorm cloud tops have dropped to lower altitudes. Warming cloud tops in a tropical cyclone indicates that the storm has weakened.

In addition to giving valuable temperature data on cloud tops, AIRS also provides the temperature of surrounding sea surfaces. Warm sea surface temperatures are critical for the development and survival of tropical cyclones. For a tropical cyclone to maintain strength or intensify, sea surface temperatures must be at least 80 degrees Fahrenheit (26.6 degrees Celsius). So, not only can AIRS infrared data tell us if a tropical cyclone is strengthening based on changes in the cloud top temperatures, but they can allow scientists determine if the waters that lie in the path of the tropical cyclone will strengthen or weaken the storm.
On July 15, NASA’s Aqua satellite passed over three tropical cyclones and AIRS gathered infrared data on all of them. The Aqua sun-synchronous polar orbit allows the Earth to rotate under it by about 22.5 degrees from one orbit to the next. Thus in a single day starting at the dateline, the Aqua daytime (ascending, or South to North pass) nadir view moves westward over the Pacific Ocean, first seeing Typhoon Nangka in the northwestern Pacific Ocean as it neared Japan. Then Aqua passed over Asia, Europe, the Atlantic Ocean, the United States and then Hurricane Dolores off the coast of western Mexico. Finally it passes over Tropical Storm Enrique, located in the western part of the Eastern Pacific Ocean, before once again reaching the dateline.
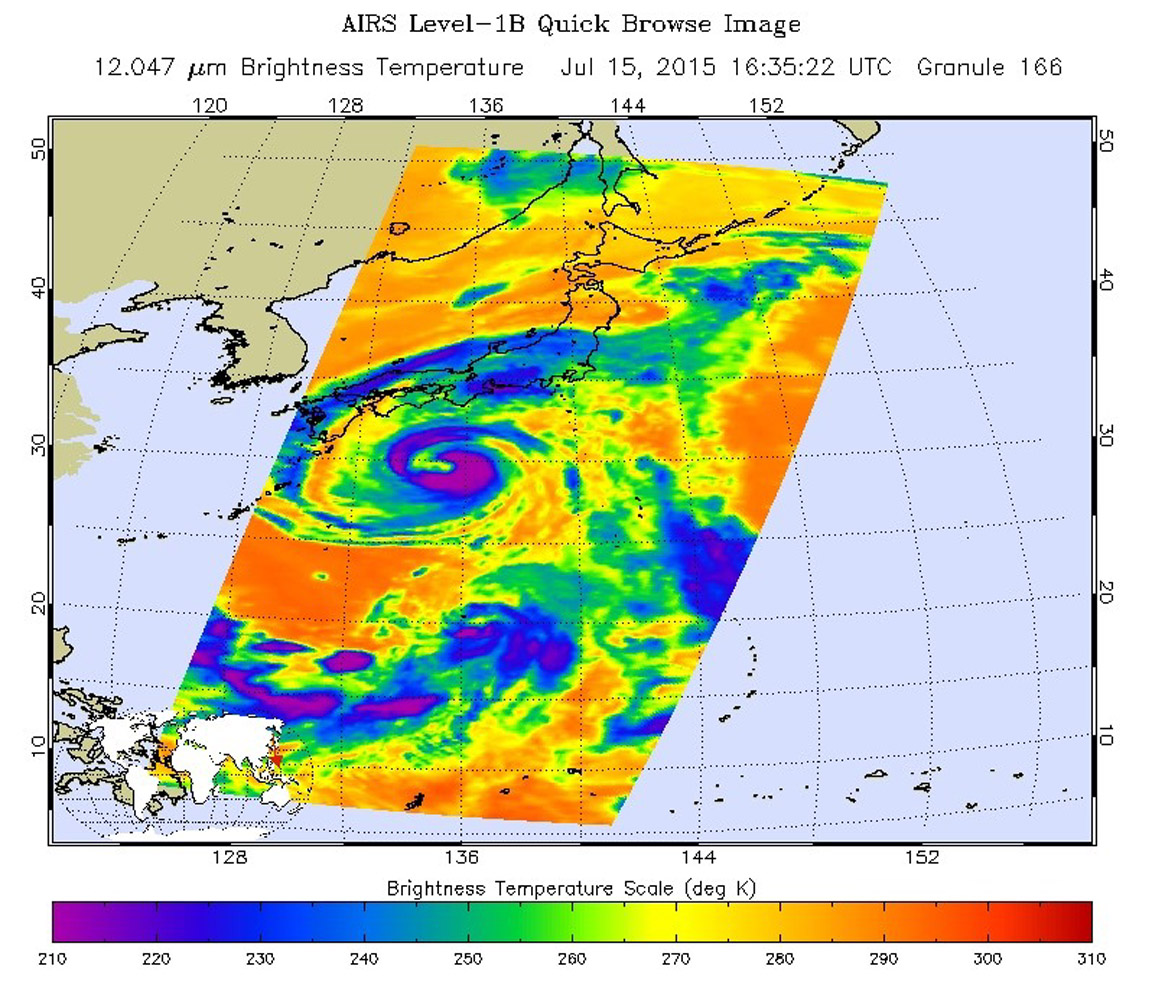
Aqua passed over Typhoon Nangka on July 15 at 16:35 UTC (12:35 p.m. EDT), then Hurricane Dolores at 20:53 UTC (4:53 p.m. EDT) and finally Enrique at 22:35 UTC (6:35 p.m. EDT). AIRS saw cloud top temperatures in the spiraling bands of thunderstorms in Nangka as cold as -81 Fahrenheit (-63 Celsius). Cloud top temperatures that cold are high into the troposphere and capable of generating heavy rain and indicate a powerful storm. AIRS data showed that Nangka had the signature shape of a typhoon with arms or bands of thunderstorms wrapping into the center from the north and south of the center. It was located just south of southeastern Japan and was headed for landfall there.
AIRS data showed cloud top temperatures in Enrique were much warmer than those of Nangka. Thunderstorms on Enrique’s eastern side appeared to be waning in strength, and the strongest thunderstorms and coldest cloud top temperatures appeared on the tropical storm’s western side. Enrique was expected to weaken to a depression later on July 16.
On July 15, AIRS data showed powerful thunderstorms circling the center of Hurricane Dolores with cloud top temperatures colder than -63 Fahrenheit/-52 Celsius. AIRS also showed that Dolores had also moved into an area of decreasing sea surface temperatures between 26 and 28 Celsius (78.8 and 82.4 Fahrenheit) sea surface temperatures. On July 16, forecasters at the National Hurricane Center looked at the sea surface temperatures over the projected path that Dolores is forecast to move and noted “…afterward, a sharp decrease in sea surface temperatures, a more stable thermodynamic environment, and increasing vertical shear should cause the cyclone to weaken more quickly.”
The AIRS instrument is just one of many that NASA has in its satellite toolbox. NASA has a fleet of Earth-observing satellites that circle the globe and measure rainfall, solar irradiance, clouds, sea surface height, ocean salinity, and other aspects of the global environment. Together, they provide a picture of Earth as a system.
For more information about NASA’s Earth Science satellite fleet, visit:
For more NASA’s Hurricane Web page visit:
Rob Gutro
NASA’s Goddard Space Flight Center, Greenbelt, Md.