


![Request for Information – Potential [Placeholder for Prize]](https://assets.science.nasa.gov/dynamicimage/assets/science/psd/solar/2023/09/s/solarsystem_0.jpg?w=1024)


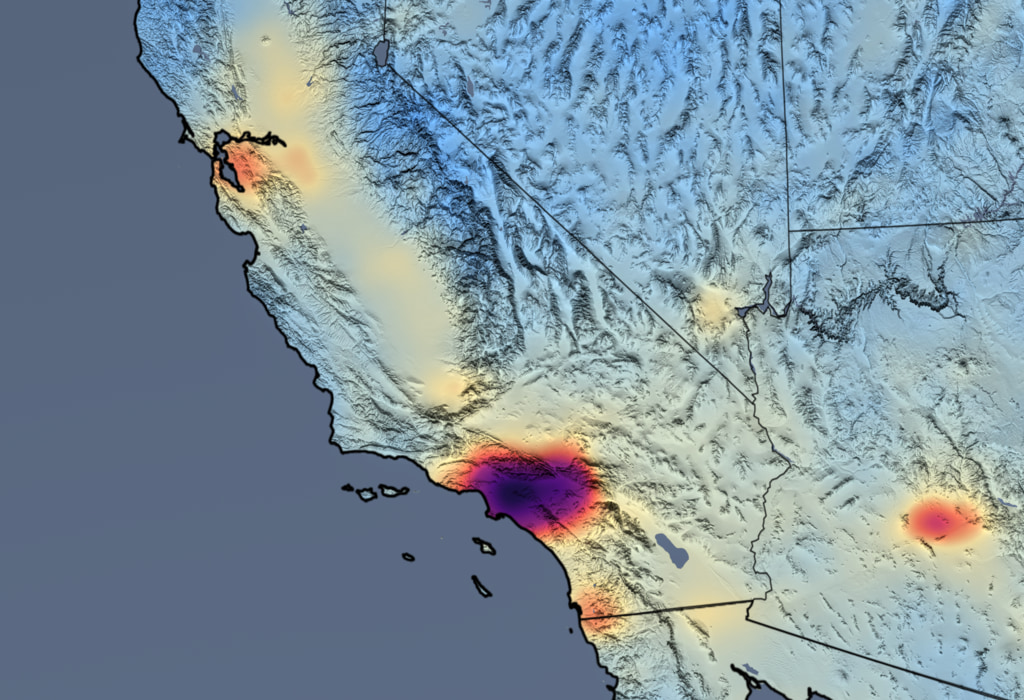
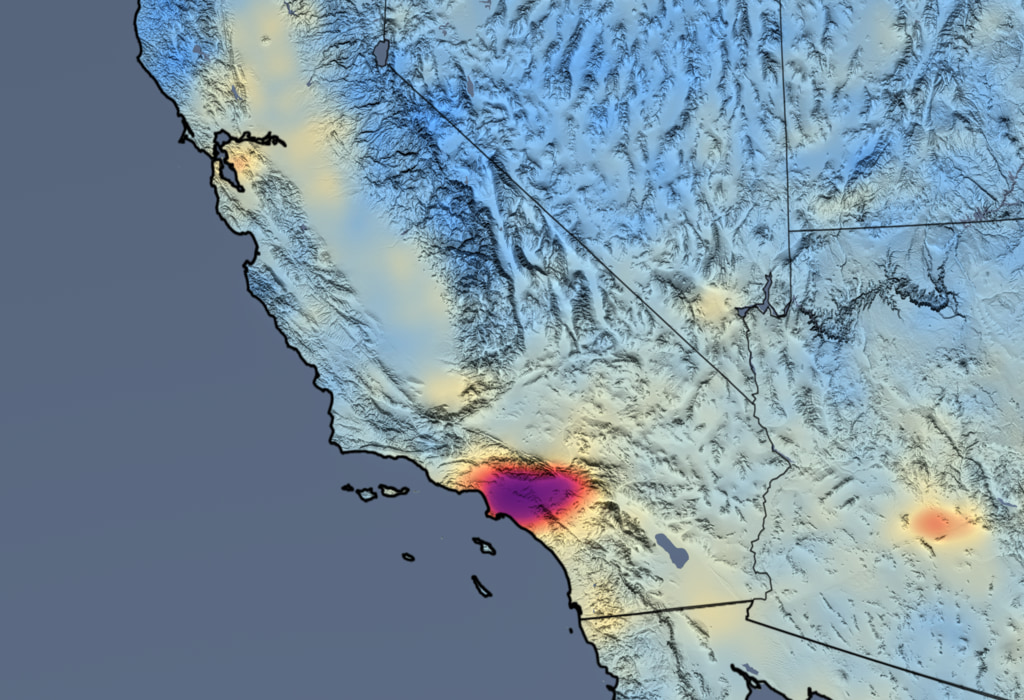
On March 19, California was one of the first states to set mandatory stay-at-home restrictions in an attempt to slow the spread of COVID-19. Arizona and Nevada followed suit around April 1. The Ozone Monitoring Instrument (OMI) on board NASA’s Aura Satellite provide data that indicate that these restrictions have led to about a 31% decrease in NO2 levels in the Los Angeles basin relative to previous years. NO2, or nitrogen dioxide, is an air pollutant measured by OMI. The estimated reductions for other cities in the Southwest U.S. before and after the quarantine restrictions are 22% for the San Francisco Bay Area, 25% for San Diego and Tijuana, Mexico, 16% for Phoenix, and 10% for Las Vegas.
For more information on NASA’s air quality research, visit https://aura.gsfc.nasa.gov
The visual for this article and other regions can be downloaded from NASA’s Scientific Visualization Studio.
For more information please contact:
Peter Jacobs
Public Affairs Officer