


NASA Satellite Animation Shows Tropical Storm Arlene “Eaten” By Weather System
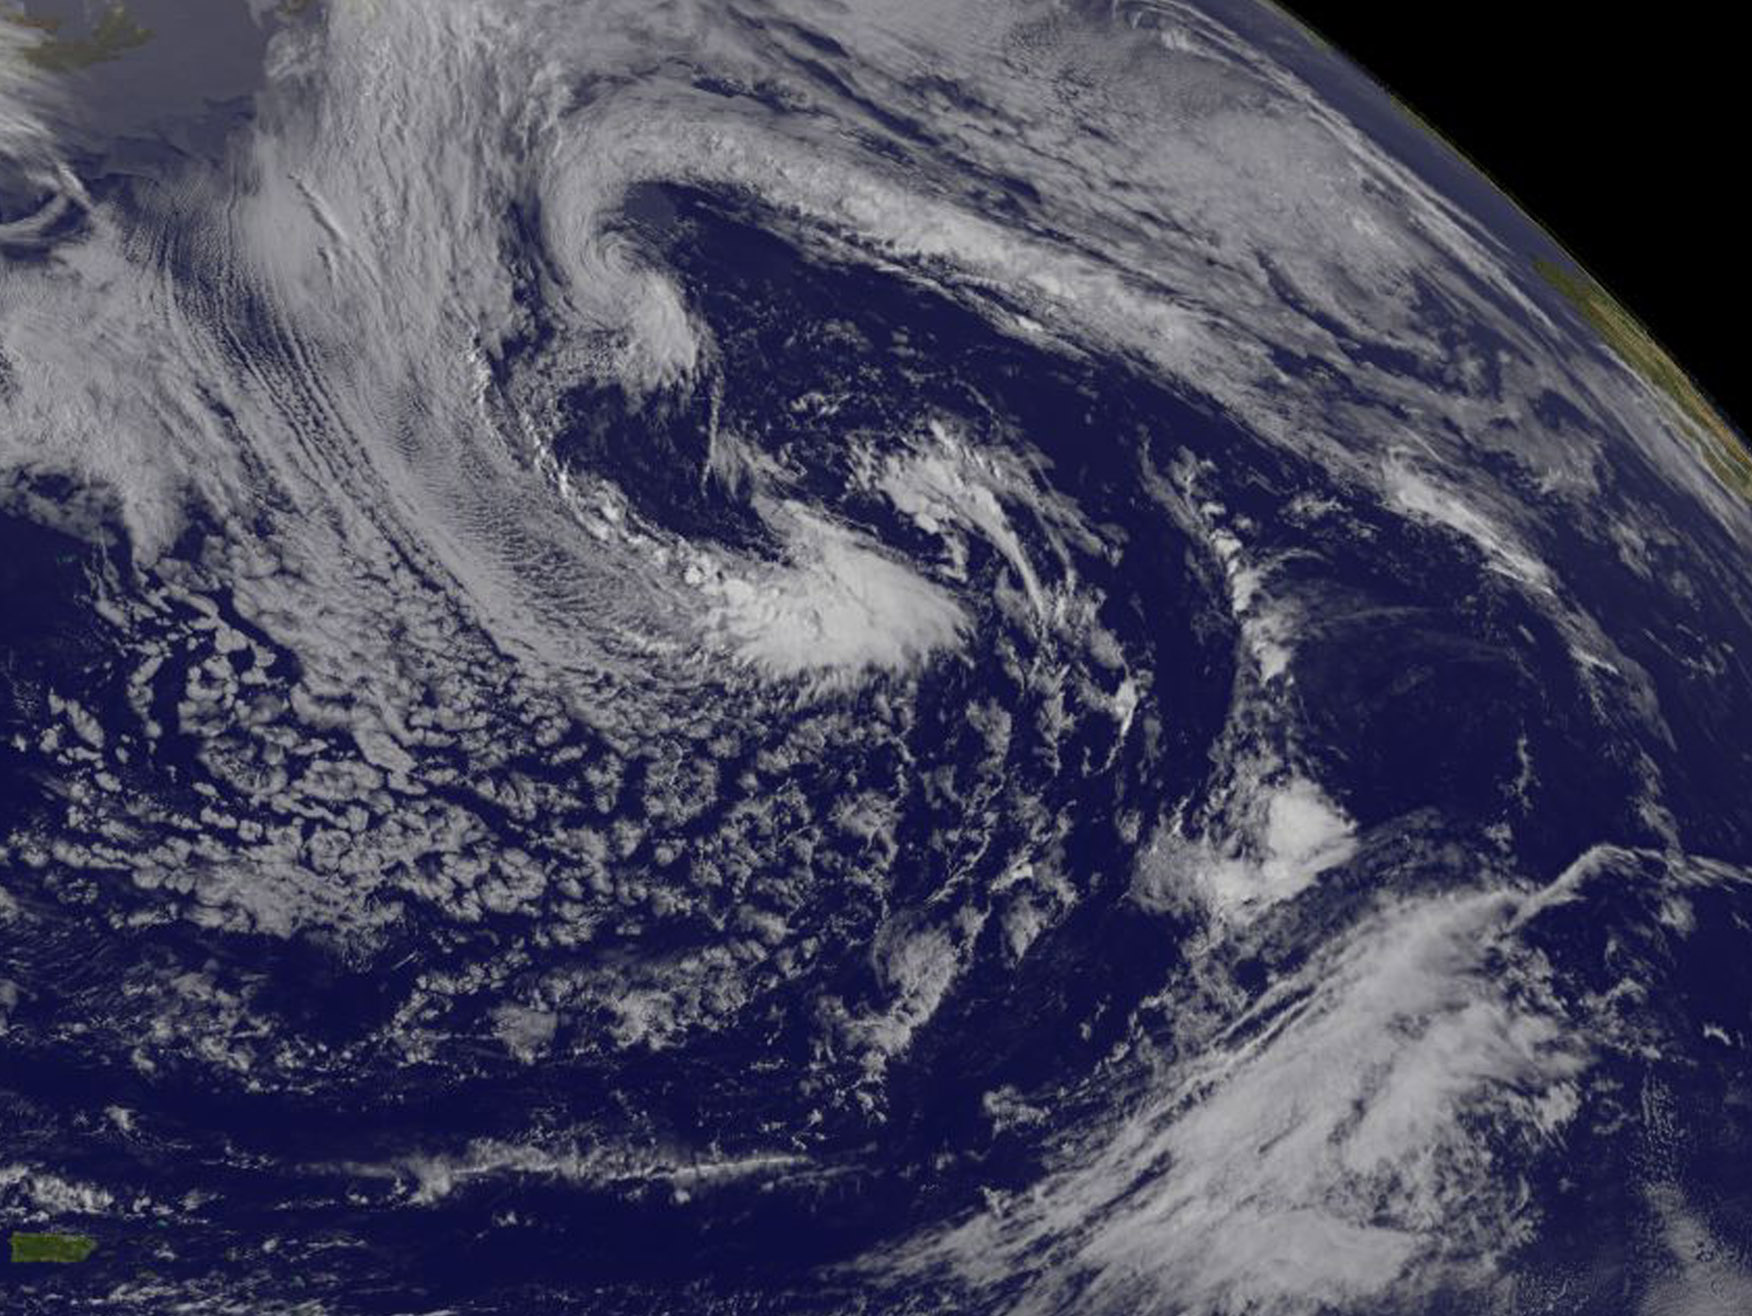
An animation created by NASA using imagery from NOAA’s GOES-East satellite shows the North Atlantic Ocean’s first tropical storm of the season being “eaten” by a large frontal system.
Credits: NASA/NOAA GOES Project
The animation from April 19 to April 22 shows Tropical Storm Arlene in the Central Atlantic Ocean as it strengthened into a tropical storm on April 21 and weakened to a subtropical storm only to be absorbed by a frontal system later that same day. The animation combines visible and infrared satellite imagery from NOAA’s GOES-East satellite.
On Friday, April 21 at 1500 UTC (11 a.m. EDT), the National Hurricane Center issued their final bulletin on Arlene. At that time, Arlene had ceased to be a tropical cyclone although maintaining maximum sustained winds near 45 knots (52 mph/83 kph). At the time, Arlene was centered about 1,235 miles west-northwest of the Azores islands near 39.3 degrees north latitude and 49.9 degrees west longitude.
Arlene was moving southwest at 20 knots (23 mph/37 kph) when the frontal system to the west of the post-tropical storm, caught up to Arlene and absorbed it.
Rob Gutro
NASA’s Goddard Space Flight Center
Apr. 21, 2017 – NASA and NOAA Satellites Watch Arlene, First Tropical Storm of the Atlantic Hurricane Season
The first tropical storm of the Atlantic Ocean hurricane season formed 40 days before the official kick off of the season. Tropical Storm Arlene formed in the North Central Atlantic Ocean and NOAA’s GOES-East satellite provided forecasters with a look at the storm, swirling far from land areas.

Arlene formed on April 20 as Tropical Depression 1 and strengthened into a tropical storm at 5 p.m. EST that day. On April 20 at 15:12 UTC (11:12 a.m. EDT) NASA-NOAA’s Suomi NPP satellite captured a visible image of Tropical Depression One as it was strengthening into a tropical storm. The image showed a large area of thunderstorms over the southwestern and northeastern quadrants of the storm.
NOAA’s GOES-East satellite captured a visible image of Tropical Storm Arlene on April 21 at 1145 UTC (7:45 a.m. EDT). Thunderstorms wrapped tightly around the center of circulation and a large band of storms circled west of center. Located to the west of Arlene were clouds associated with another frontal system.
The National Hurricane Center (NHC) said at 5 a.m. EST (0900 UTC), the center of Tropical Storm Arlene was located near 40.0 degrees north latitude and 48.0 degrees west longitude. That’s about 1,135 miles (1,825 km) west-northwest of the Azores.
Arlene was moving toward the west near 31 mph (50 kph) and this general motion is expected to continue today. Maximum sustained winds were near 50 mph (85 kph) with higher gusts. The estimated minimum central pressure was 993 millibars (29.33 inches). Arlene was beginning to lose its tropical characteristics as the cyclone interacts with a frontal zone and also moves over cooler water. The new official intensity forecast continues the trend of the previous advisory, which shows Arlene degenerating to a post-tropical cyclone by 12 hours, and dissipating by 24 hours when the system is expected to be absorbed into the larger baroclinic low.
The National Hurricane Center noted “Tropical storms in April are rare and Arlene is only the second one observed in this month during the satellite era. It should be noted, however, that this type of storm was practically impossible to detect prior to the weather satellite era.”
Little change in strength is expected, and Arlene is forecast to become absorbed by a large extra-tropical low pressure area and dissipate later today, April 21.
For updates on Arlene, visit NHC’s website: www.nhc.noaa.gov
Rob Gutro
NASA’s Goddard Space Flight Center
Apr. 20, 2017 – NASA Sees the Formation of Early Atlantic Ocean Tropical Depression 1
A low pressure area in the Atlantic Ocean, located southwest of the Azores was designated as Subtropical Depression One on April 19 as NASA examined its rainfall. By April 20 it had become the Atlantic’s first tropical depression.
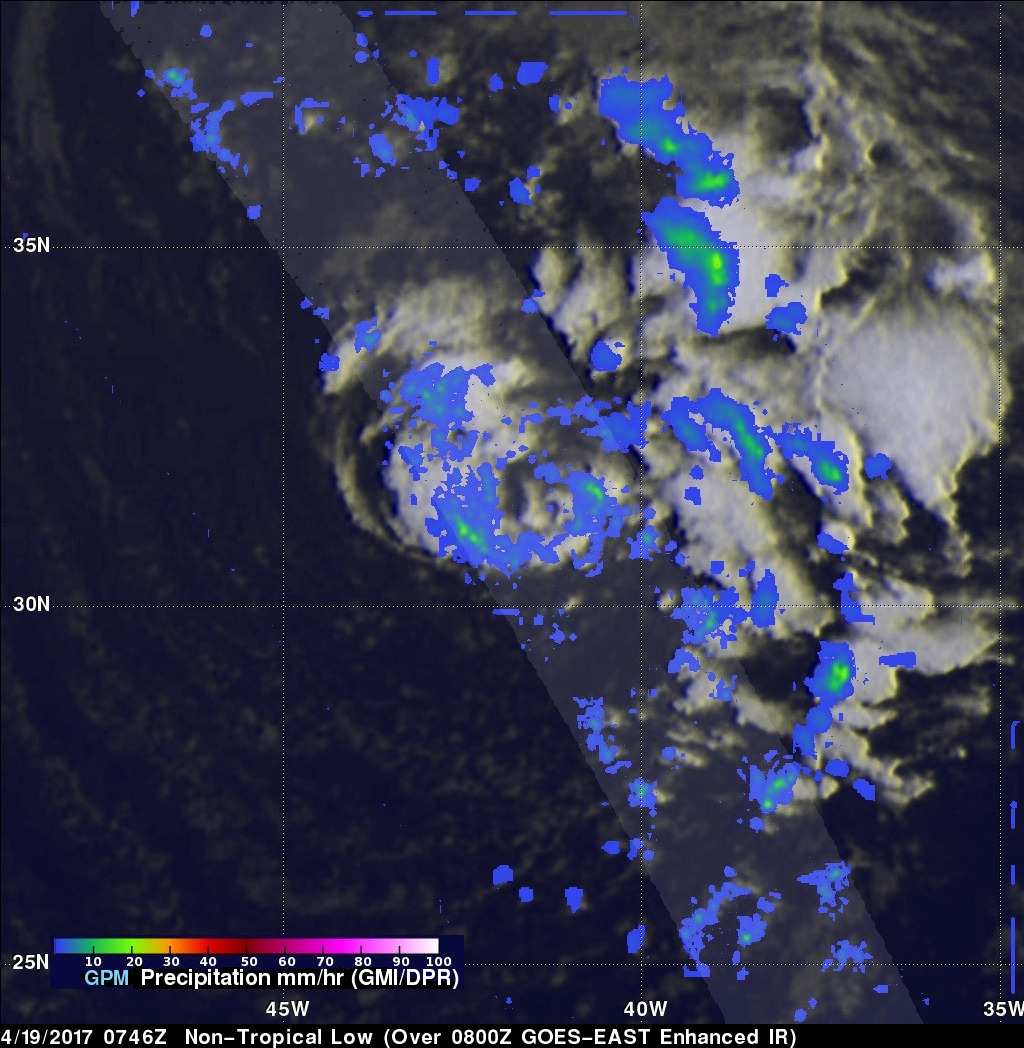
Just as the subtropical depression was forming in the North Atlantic Ocean on April 19 at 11 a.m. EDT (1500 UTC) the Global Precipitation Measurement Mission or GPM core observatory satellite flew directly over it and identified areas where rainfall was heaviest in the system.
Data collected by GPM’s Microwave Imager (GMI) and Dual-Frequency Precipitation Radar (DPR) instruments April 19, 2017 at 0746 UTC (3:46 a.m. EDT) showed moderate to heavy rainfall within the low pressure area. DPR revealed that rain was falling at a rate of over 30 mm (1.2 inches) per hour in showers located to the east of the low’s center of circulation. GPM’s radar (DPR Ku Band) also showed that a few storms rotating around the low pressure center were dropping rain at a rate of almost 36 mm (1.4 inches) per hour.
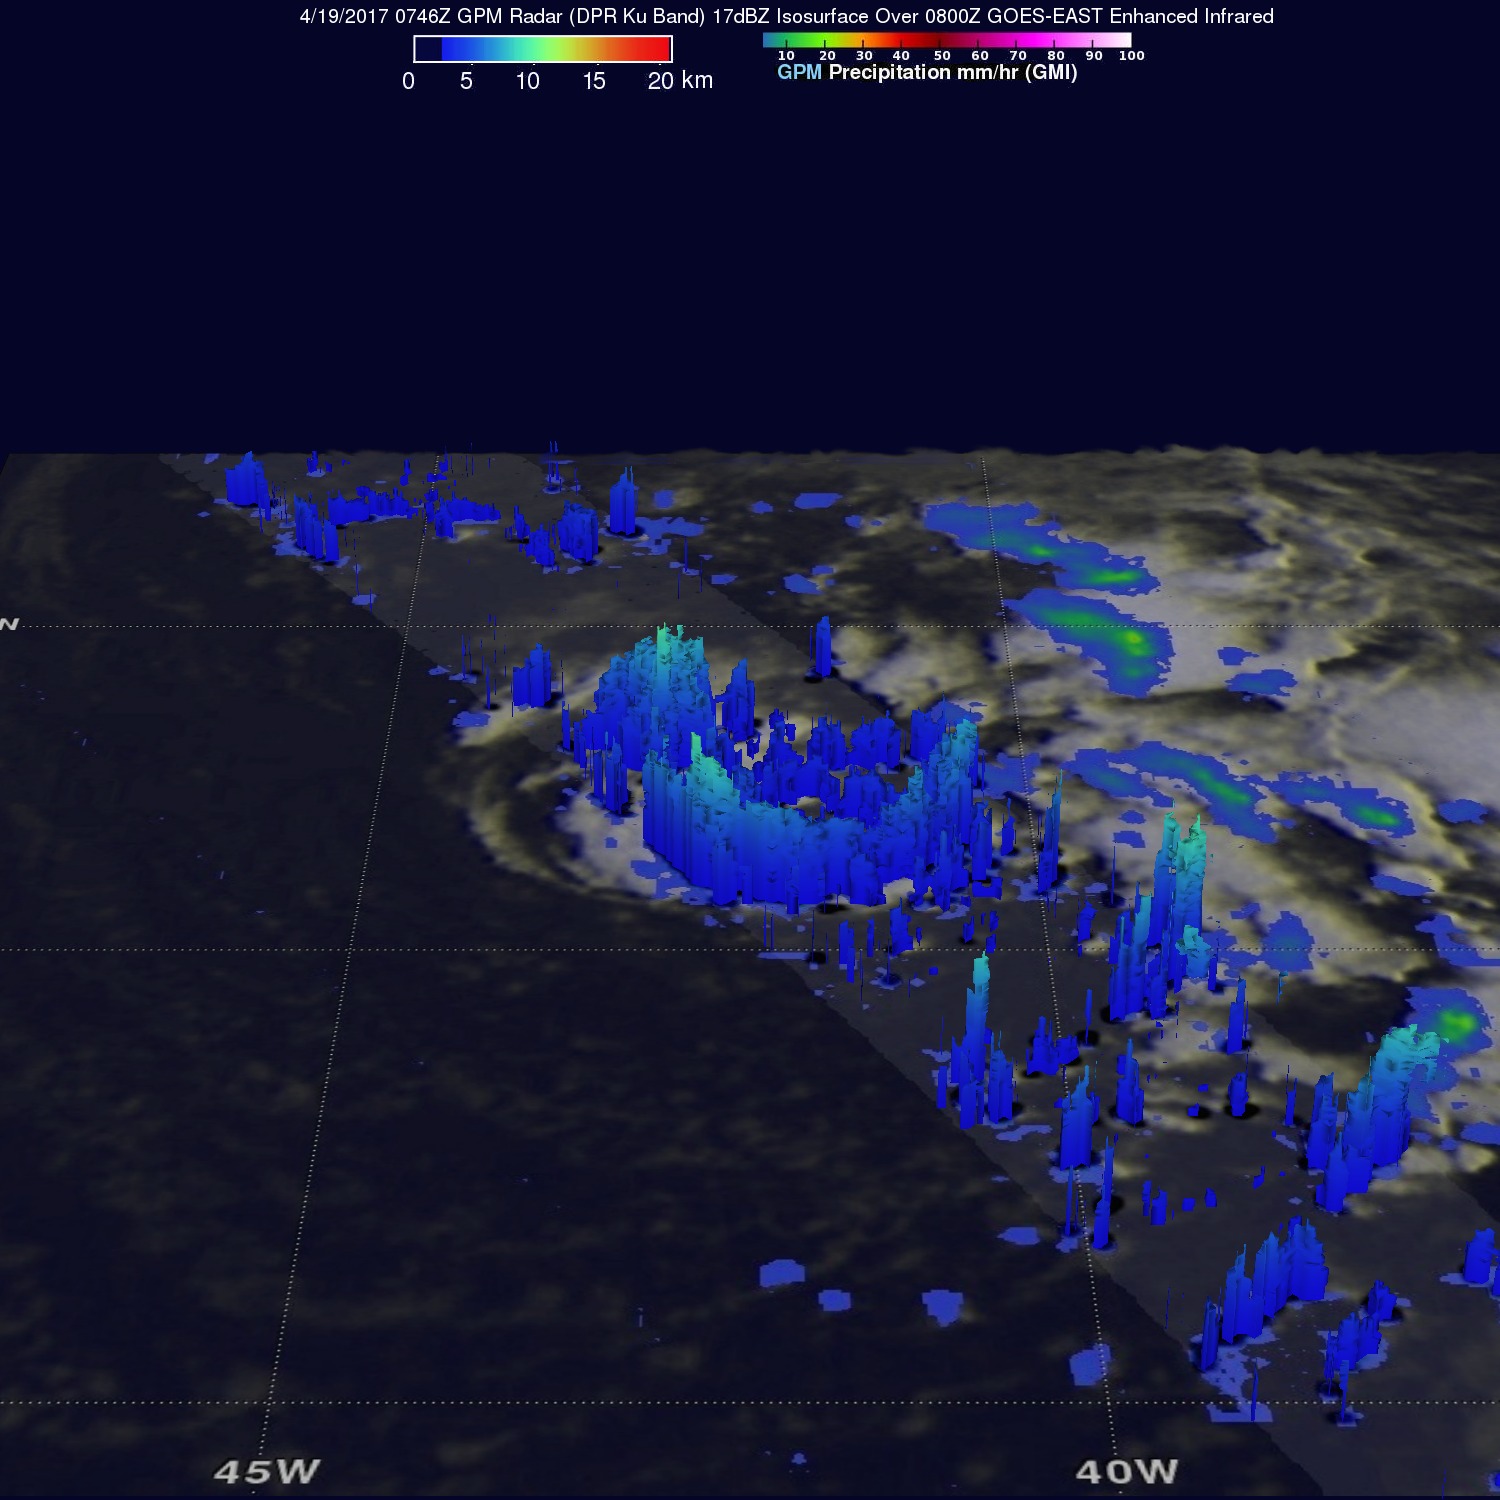
At NASA’s Goddard Space Flight Center in Greenbelt, Maryland, a 3-D examination was created using GPM’s Radar (DPR Ku Band) data. That 3-D analysis showed most of the storms around the low pressure area were fairly shallow. Some of the highest storm tops just to the west of the low’s center of circulation were found by DPR to reach altitudes above 11 km (6.8 miles). GPM is a joint satellite mission between NASA and the Japan Aerospace Exploration Agency, JAXA.
At the time of formation, the National Hurricane Center (NHC) determined that it was a sub-tropical low pressure area. The difference between this and a tropical cyclone is found in the temperature structure. This low had a cold core while tropical cyclones that normally form in the tropics, are warm core. That changed on April 20 at 11 a.m. EST when it was designated a tropical depression and developed a warm core. At that time NHC’s discussion noted “Conventional satellite imagery indicate that the convection, although not very deep, has become more symmetric around the center, suggesting that the subtropical cyclone has transitioned into a tropical depression.”
Credits: NASA/JAXA, Hal Pierce
At 11 a.m. EST (1500 UTC), the center of Tropical Depression One was located near 36.1 degrees north latitude and 40.0 degrees west longitude. That’s about 730 miles (1,170 km west of the Azores. The Azores are an archipelago in the mid-Atlantic Ocean. The depression was moving toward the northwest near 14 mph (22 kph), and that general motion is expected to continue until dissipation. Maximum sustained winds were near 35 mph (55 kph) with higher gusts. The estimated minimum central pressure is 996 millibars (29.42 inches).
The National Hurricane Center (NHC) predicts that this system will become a remnant low pressure area later today, April 20 and become absorbed by a larger low at night or early Friday, April 21. The depression is then expected to be absorbed by a larger low pressure area.
Rob Gutro / Hal Pierce
NASA’s Goddard Space Flight Center