


![Request for Information – Potential [Placeholder for Prize]](https://assets.science.nasa.gov/dynamicimage/assets/science/psd/solar/2023/09/s/solarsystem_0.jpg?w=1024)


Credits: NASA Goddard Rapid Response Team
NASA Animation Shows Cindy Move Off Atlantic Coast
June 23, 2017 – NASA Adds up Tropical Storm Cindy’s Rainfall
Tropical storm Cindy was downgraded to a tropical depression after moving onshore near the Texas and Louisiana Border on Thursday June 22, 2017 and bringing a lot of rain with it. That rainfall was measured by NASA using satellite data.
On June 23, the Flash flood warnings were in effect for portions of lower and mid-Mississippi Valley.
Flooding was reported along the Gulf Coast even before Cindy made landfall. The rainfall around tropical storm Cindy was asymmetrical. The majority of heavy rainfall with the tropical cyclone was located east of Cindy’s center in the states along the Gulf Coast from Louisiana through the Florida Panhandle. The tropical depression continued to spread heavy rain and occasionally severe thunderstorms after it came ashore. Severe thunderstorms spawned a tornado June 22, Thursday afternoon that injured four people near Jefferson, Alabama.
At NASA’s Goddard Space Flight Center in Greenbelt, Maryland total rainfall was estimated from June 20 through early June 23, 2017 using precipitation estimates from NASA’s Integrated Multi-satelliE Retrievals for GPM (IMERG) data. GPM is the Global Precipitation Measurement mission core satellite managed by NASA and the Japan Aerospace Exploration Agency. GPM is also one of a constellation of satellites used in creating IMERG analyses.
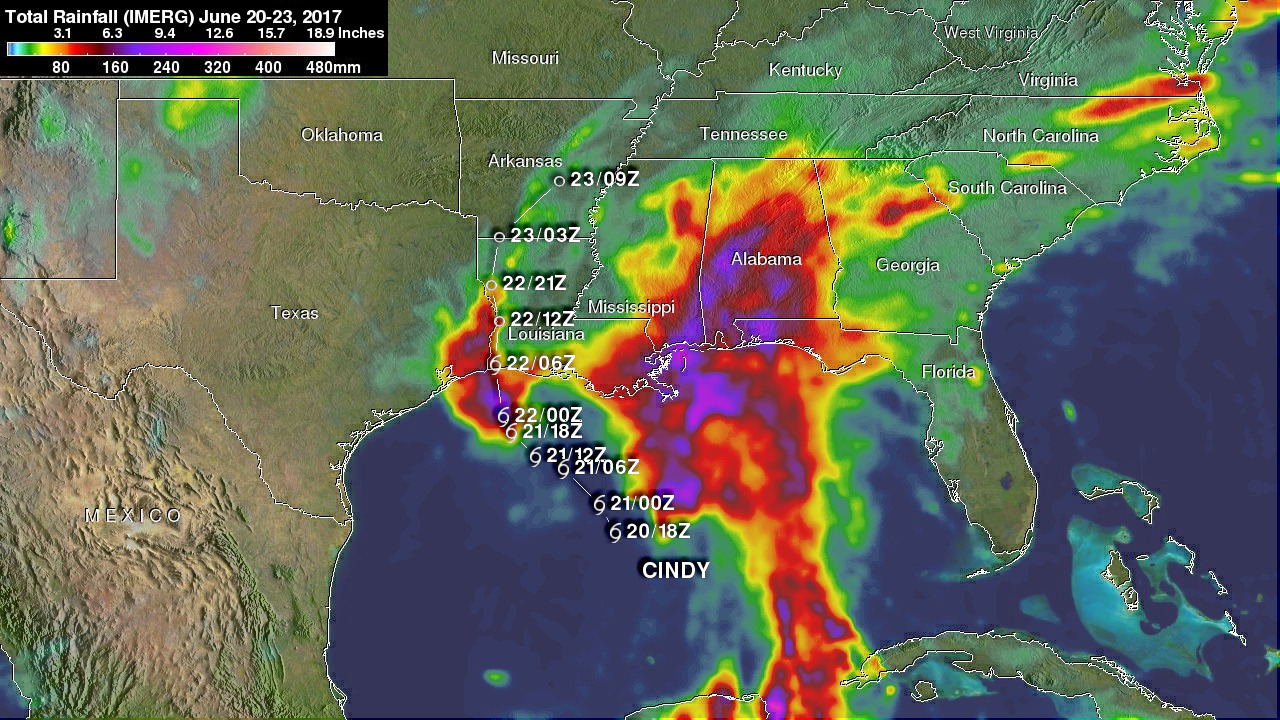
IMERG data are produced using data from the satellites in the GPM constellation, and is calibrated with measurements from the GPM Core Observatory as well as rain gauge networks around the world. The IMERG analysis of Cindy’s rainfall indicates that rainfall totals exceeding 10.5 inches (266.7 mm) occurred in eastern Texas, southern Louisiana, Mississippi, Alabama and northwestern Florida. The most extreme rainfall totals estimated by IMERG was greater than 16 inches (406.4 mm) over the open waters of the Gulf of Mexico near the Yucatan Peninsula.
The Satellites in the GPM Constellation for IMERG Data
The Integrated Multi-satellitE Retrievals for GPM (IMERG) creates a merged precipitation product from the GPM constellation of satellites. These satellites include DMSPs from the U.S. Department of Defense, GCOM-W from the Japan Aerospace Exploration Agency (JAXA), Megha-Tropiques from the Centre National D’etudies Spatiales (CNES) and Indian Space Research Organization (ISRO), NOAA series from the National Oceanic and Atmospheric Administration (NOAA), Suomi-NPP from NOAA-NASA, and MetOps from the European Organisation for the Exploitation of Meteorological Satellites (EUMETSAT). All of the instruments (radiometers) onboard the constellation partners are intercalibrated with information from the GPM Core Observatory’s GPM Microwave Imager (GMI) and Dual-frequency Precipitation Radar (DPR).
Cindy’s Location
Credits: NASA/JAXA, Hal Pierce
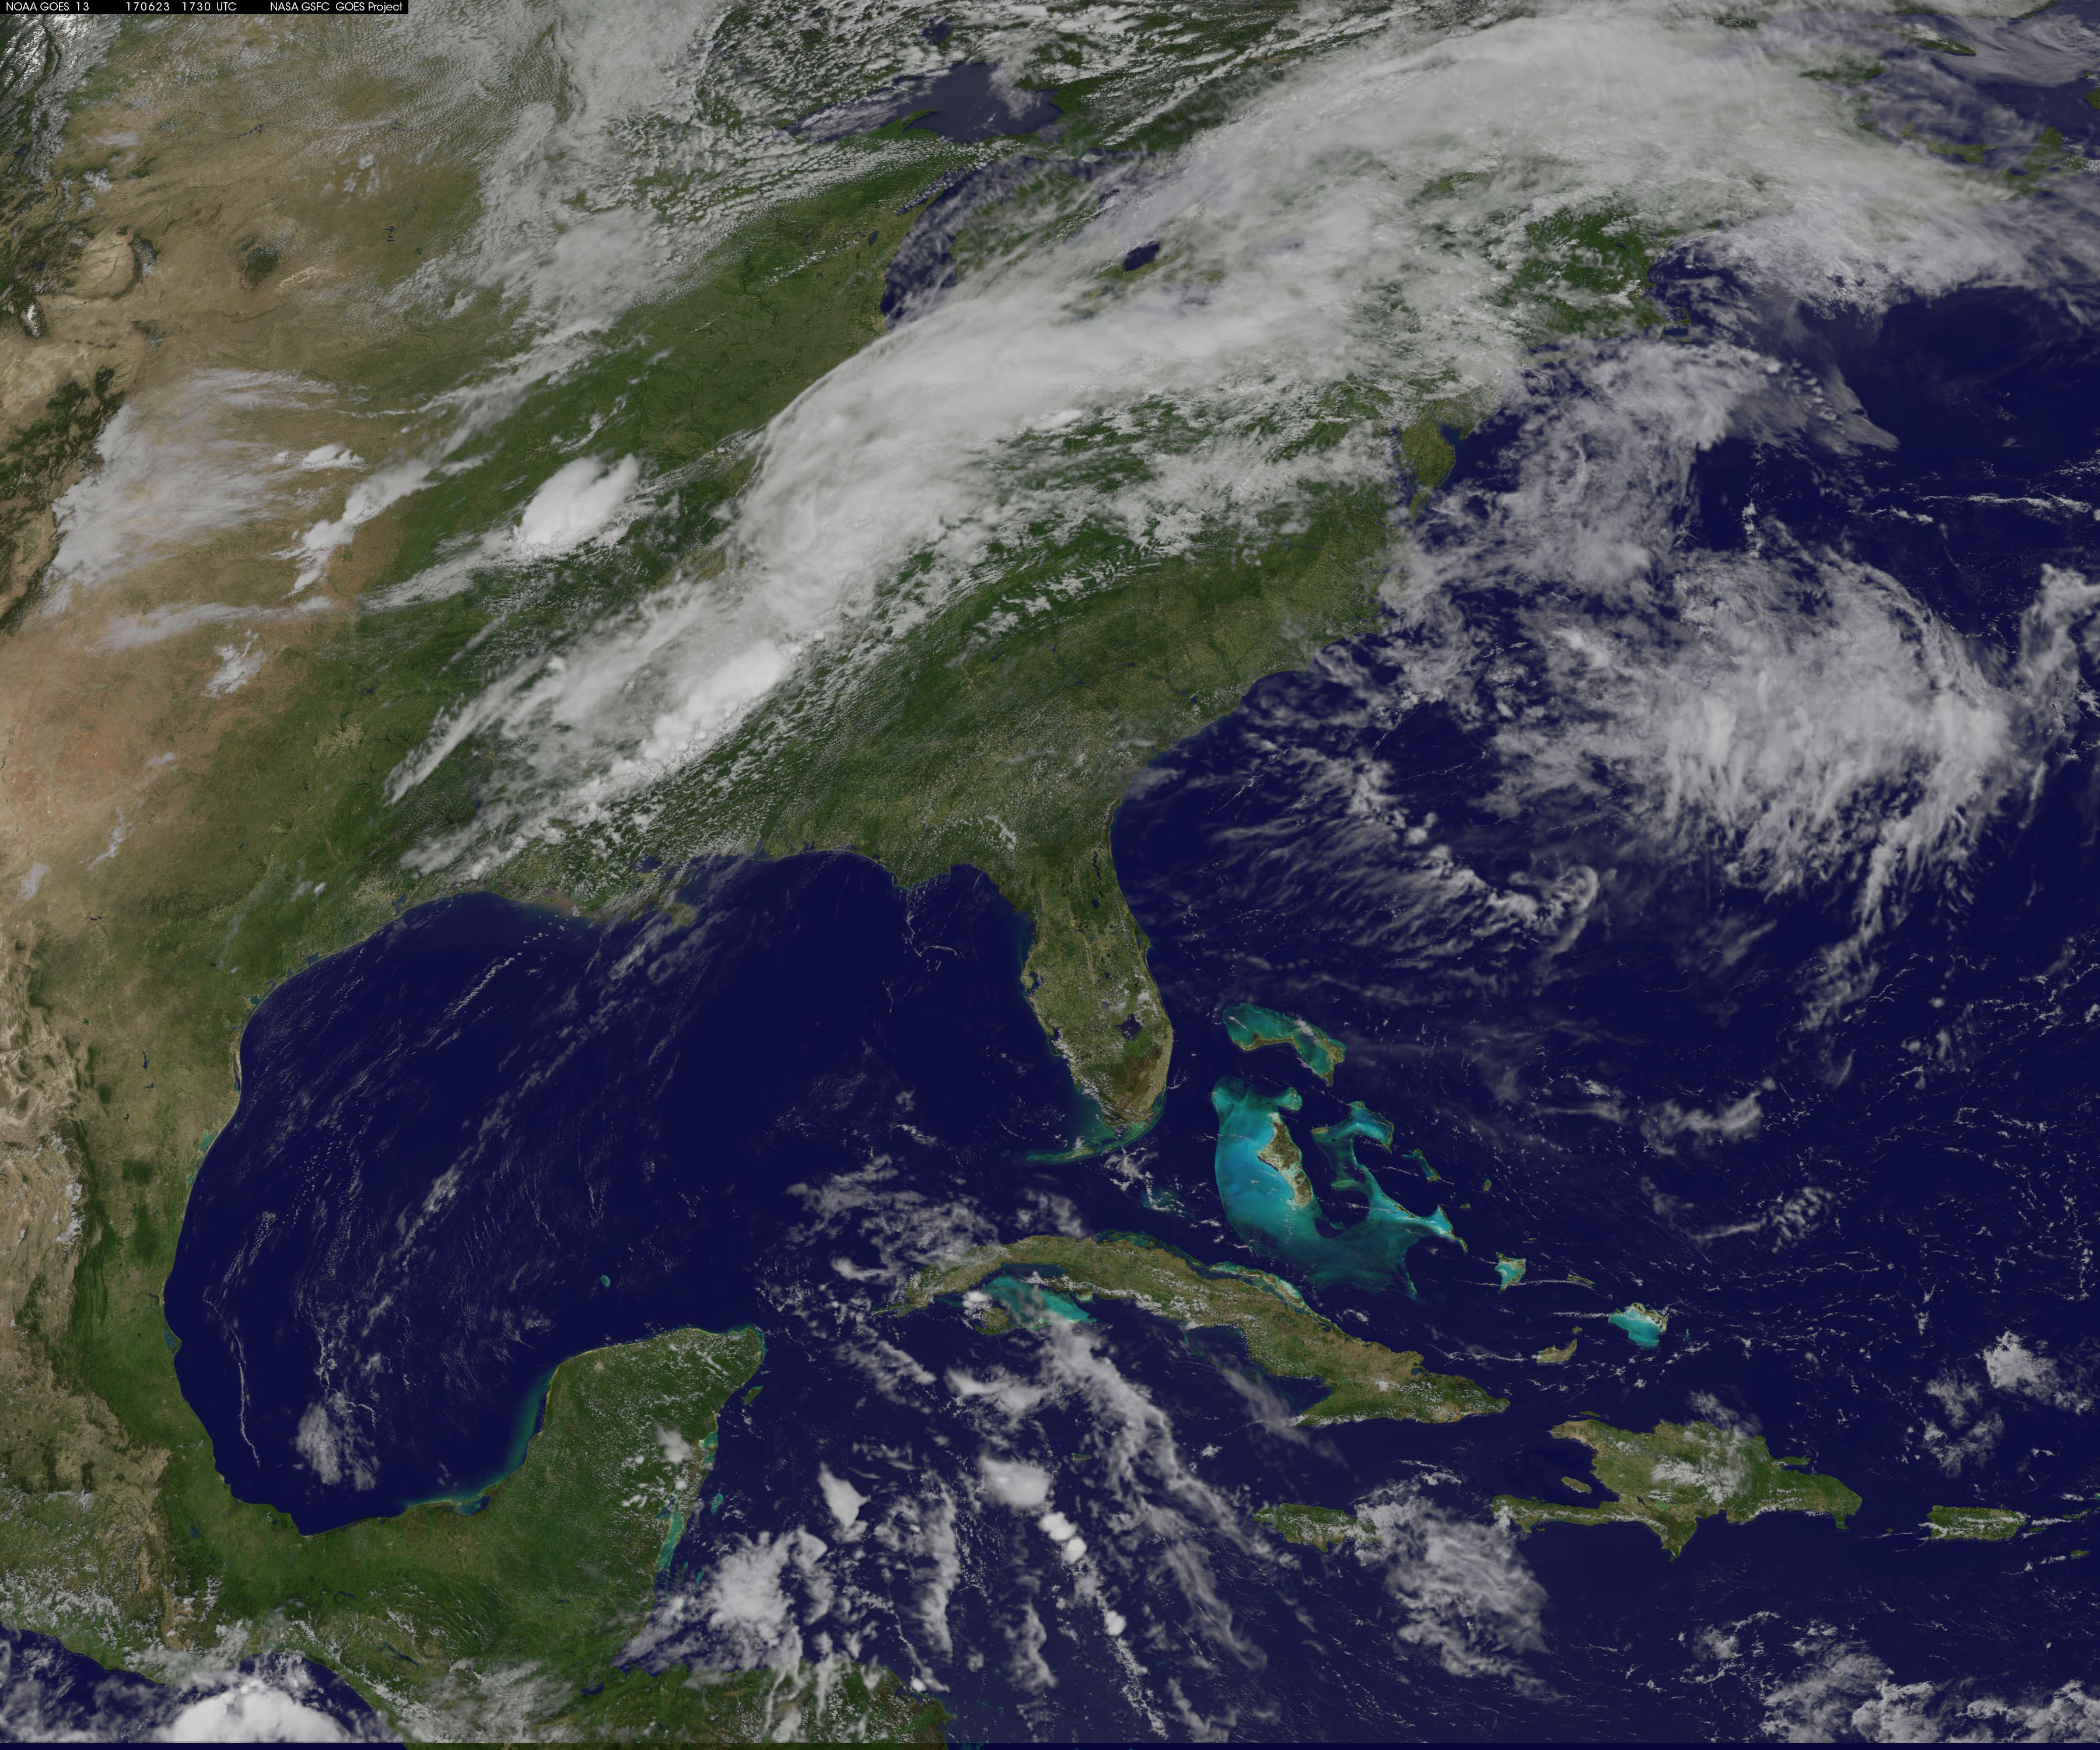
At 11 a.m. EDT (1500 UTC) on Friday, June 23, the center of Cindy was located near 36.1 degrees north latitude and 89.6 degrees west longitude. That’s about 50 miles (81 km) northwest of Jackson/Mckellar, Tennessee and about 75 miles (121 km) north-northeast of Memphis, Tennessee. Maximum sustained winds are near 35 mph (55 kph) with higher gusts. Minimum central pressure is 1002 millibars. Under increasing vertical wind shear…the circulation of Tropical Depression Cindy became elongated during the morning of June 23 as seen on imagery from NOAA’s GOES-East satellite.
On June 23 at 1:30 p.m. EDT (17:30 UTC) NOAA’s GOES-East satellite captured an image Tropical Depression Cindy’s clouds stretching from the Tennessee Valley, north into the Ohio Valley.
Rainfall Continues to be Primary Threat
The primary threat with this storm will continue to be moderate to heavy rain from the lower and Mississippi Valley northeastward across the Tennessee and Ohio Valleys into the central Appalachians through tonight before rapidly moving off the east coast on Saturday.
Cindy’s Future
The National Weather Service, Weather Prediction Center (NPC) in College Park, Maryland is now providing forecast updates on Cindy. NPC noted that Tropical Depression Cindy is expected to become post-tropical this afternoon, June 23, as it continues to lose tropical characteristics and should become extratropical by early Saturday, June 24 when a fast-moving cold front merges with the remnant circulation over the Mid-Atlantic region.
For updated forecasts on Cindy from the WPC, visit: http://www.wpc.ncep.noaa.gov/tropical/tropstorms.shtml
NWS NPC Compiled Rainfall Totals
Selected Storm Total Rainfall in Inches Through 8 a.m. EDT on June 23
…Alabama…
6.80 Prattville 1 N
6.65 Mobile/Bates Field
4.35 Tuscaloosa Muni Arpt
…Arkansas…
3.69 Monticello Airport
…Florida…
8.30 Navarre
8.28 Pensacola Rgnl Arpt
5.34 Apalachicola Muni Arpt
4.95 Destin Airport
…Georgia…
6.58 Starrsville
…Louisiana…
4.52 Contraband Bayou
4.10 Houma 4 SE
4.08 Nww Orleans/Moisant
3.37 Slidell
2.40 Baton Rouge 4 E
…Mississippi…
12.30 Ocean Springs 2 E
8.71 Keesler Air Force Base/Biloxi
8.58 Gulfport-Biloxi
5.38 Pascagoula
…Tennessee…
1.20 Pulaski 8 ENE
1.10 Fayetteville 1 SSW
…Texas…
5.36 Mahaw Bayou
4.76 Star Lake
2.90 Galveston 6 NE
2.30 Beaumont 5 S
By Rob Gutro / Hal Pierce
NASA’s Goddard Space Flight Center
June 22, 2017 – NASA’s Infrared and Radar Eyes in Space Cast on Tropical Storm Cindy
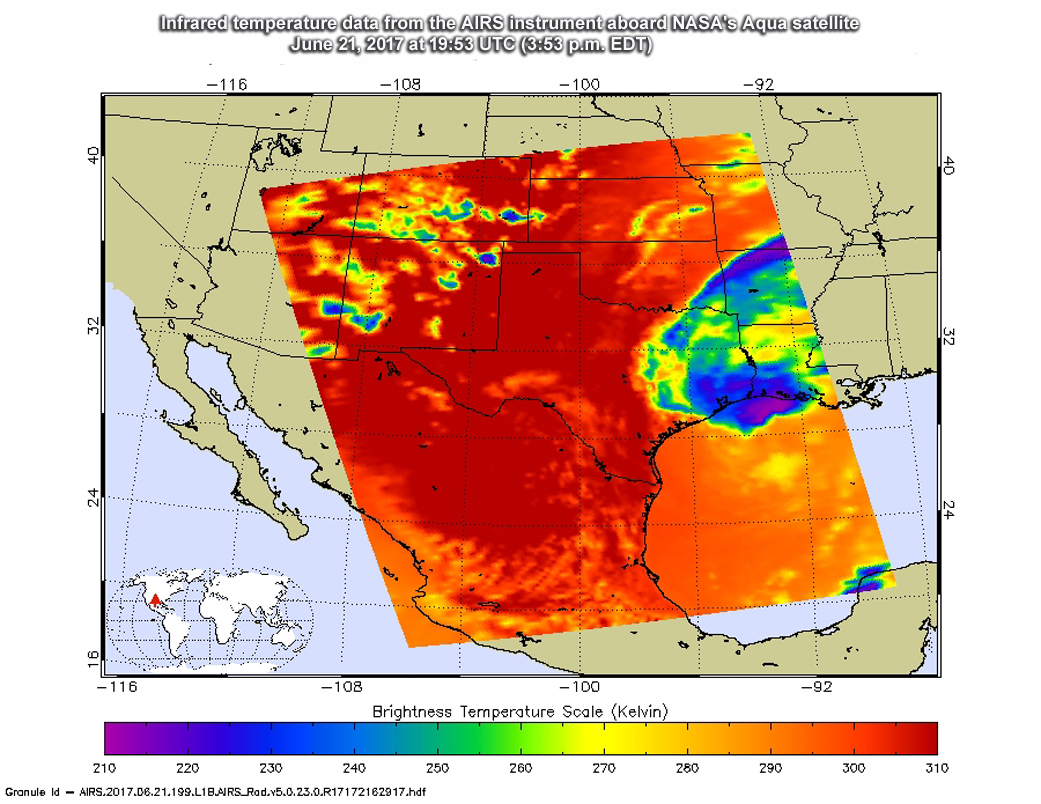
NASA’s Aqua satellite analyzed Tropical Storm Cindy in infrared light to identify areas of strongest storms and the Global Precipitation Measurement mission or GPM satellite found locations of heaviest rainfall as Cindy was making landfall along the U.S. Gulf Coast states.
The Atmospheric Infrared Sounder or AIRS instrument aboard NASA’s Aqua satellite looked at Tropical Depression Cindy in infrared light. The AIRS image was taken on June 21 at 19:53 UTC (3:53 p.m. EST) and showed some cloud top temperatures of thunderstorms near the center of circulation as cold as minus 63 degrees Fahrenheit (minus 53 degrees Celsius). NASA research has shown the storms with cloud tops that cold have the potential to generate heavy rainfall.
The infrared data was false-colored at NASA’s Jet Propulsion Laboratory in Pasadena, California, where AIRS data is managed.
Cindy made landfall around 3 a.m. CDT in southwestern Louisiana. At that time, the National Hurricane Center or NHC said that Cindy was centered about 30 miles (45 km) west-southwest of Lake Charles, Louisiana.
Measuring Rainfall Rates from Space
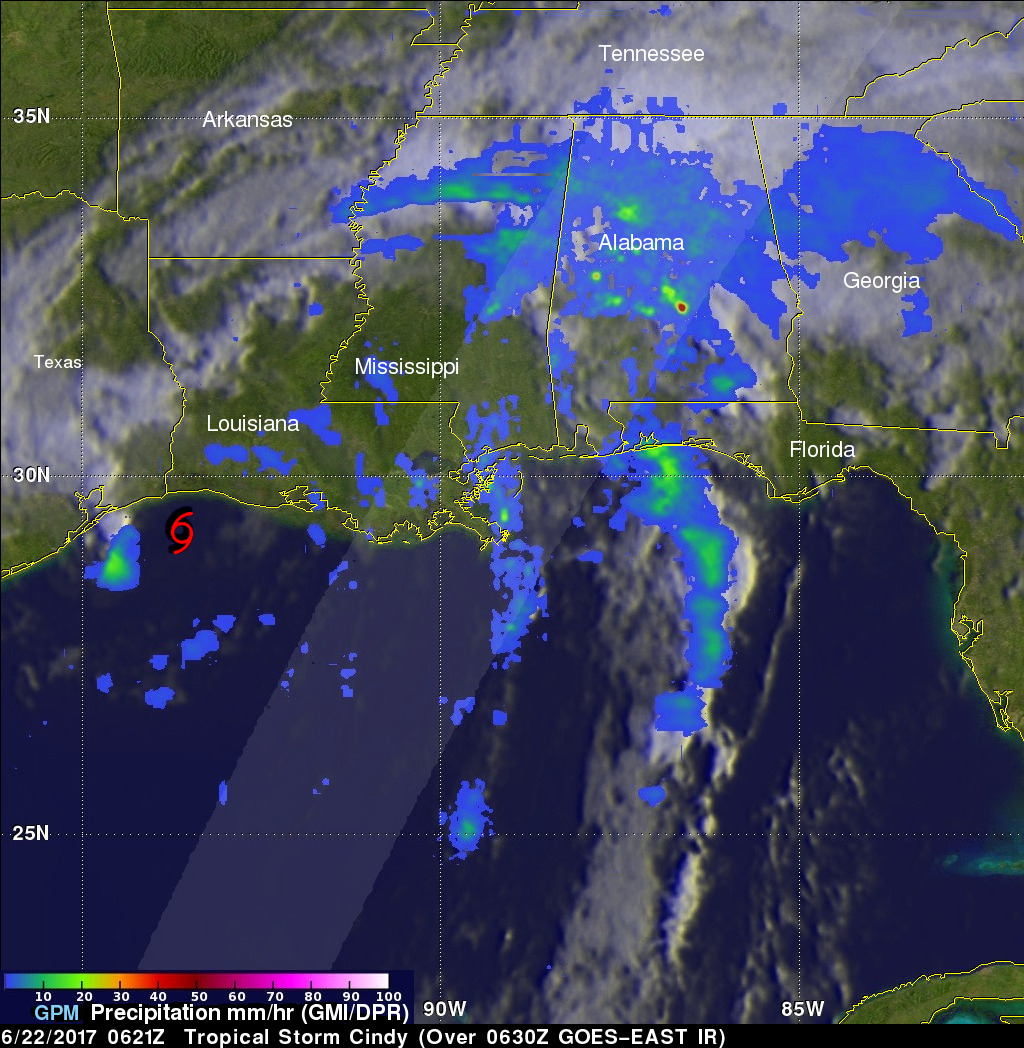
The GPM core observatory satellite passed above as Tropical Storm Cindy was approaching the western Louisiana coast on June 22, 2017 at 2:21 a.m. EDT (0621 UTC). Cindy had maximum sustained winds of about 40 knots (46 mph) at that time. Rainfall derived from Microwave Imager (GMI) and Dual-Frequency Precipitation Radar (DPR) measurements showed that there was very little rainfall near Cindy’s center of circulation but bands of moderate to heavy showers were seen moving into the states along the Gulf Coast. GPM’s Radar (DPR Ku Band) found that storms over central Alabama were dropping rain at a rate of over 3.6 inches (91 mm) per hour.
At NASA’s Goddard Space Flight Center in Greenbelt, Maryland, GPM radar (DPR Ku Band) data were used to show the 3-D structure of rainfall within Cindy’s storm tops. GPM’s radar revealed that a few storms within rain bands near New Orleans were reaching heights of over 7.2 miles (11.6 km). GPM’s radar found that the heaviest downpours over Alabama were returning radar reflectivity values of over 51dBZ to the GPM satellite.
Cindy’s Whereabouts on June 22
On June 22, NHC issued a Tropical Storm Warning from High Island, Texas to Morgan City, Louisiana.
At 8 a.m. EDT (1200 UTC), the center of Tropical Storm Cindy was located near latitude 30.5 North, longitude 93.7 West. Cindy is moving toward the north near 12 mph (19 km/h), and a turn toward the north-northeast is expected later today, followed by a turn toward the northeast on Friday, June 23. Maximum sustained winds are near 40 mph (65 kph) with higher gusts. The estimated minimum central pressure is 994 millibars.
Rainfall is the Biggest Danger
The National Hurricane Center noted that rainfall is the biggest threat from Cindy as it continues to move inland. NHC said, “Cindy is expected to produce rain accumulations of 3 to 6 inches with isolated maximum amounts up to 12 inches over eastern Texas, western and central Louisiana, and southern and eastern Arkansas through Friday morning. Additional rainfall amounts of 2 to 4 inches with isolated maximum amounts of 8 inches over southern Mississippi, southern and central Alabama, and extreme western Florida Panhandle are expected through Friday morning. This rainfall could cause life-threatening flash flooding in these areas.
Rainfall is expected to begin and expand across parts of the Tennessee and Ohio valleys. Rainfall amounts of 1 to 2 inches with isolated maximum amounts of 4 inches are expected through Friday morning.”
In addition to heavy rainfall, tropical storm force winds, storm surge and a few tornadoes are possible. The tornado threat extends through tonight, June 22, from the lower Mississippi and Tennessee Valley regions to the central Gulf Coast.
On the forecast track, Cindy will move into southeastern Arkansas early Friday, and into Tennessee later on Friday. NHC said Cindy is expected to continue weakening and should become a remnant low tonight.
For the full forecast and latest updates, visit the NHC website: www.nhc.noaa.gov.
By Rob Gutro
NASA’s Goddard Space Flight Center
June 21, 2017 – NASA Sees Tropical Storm Cindy Soaking the Gulf Coast
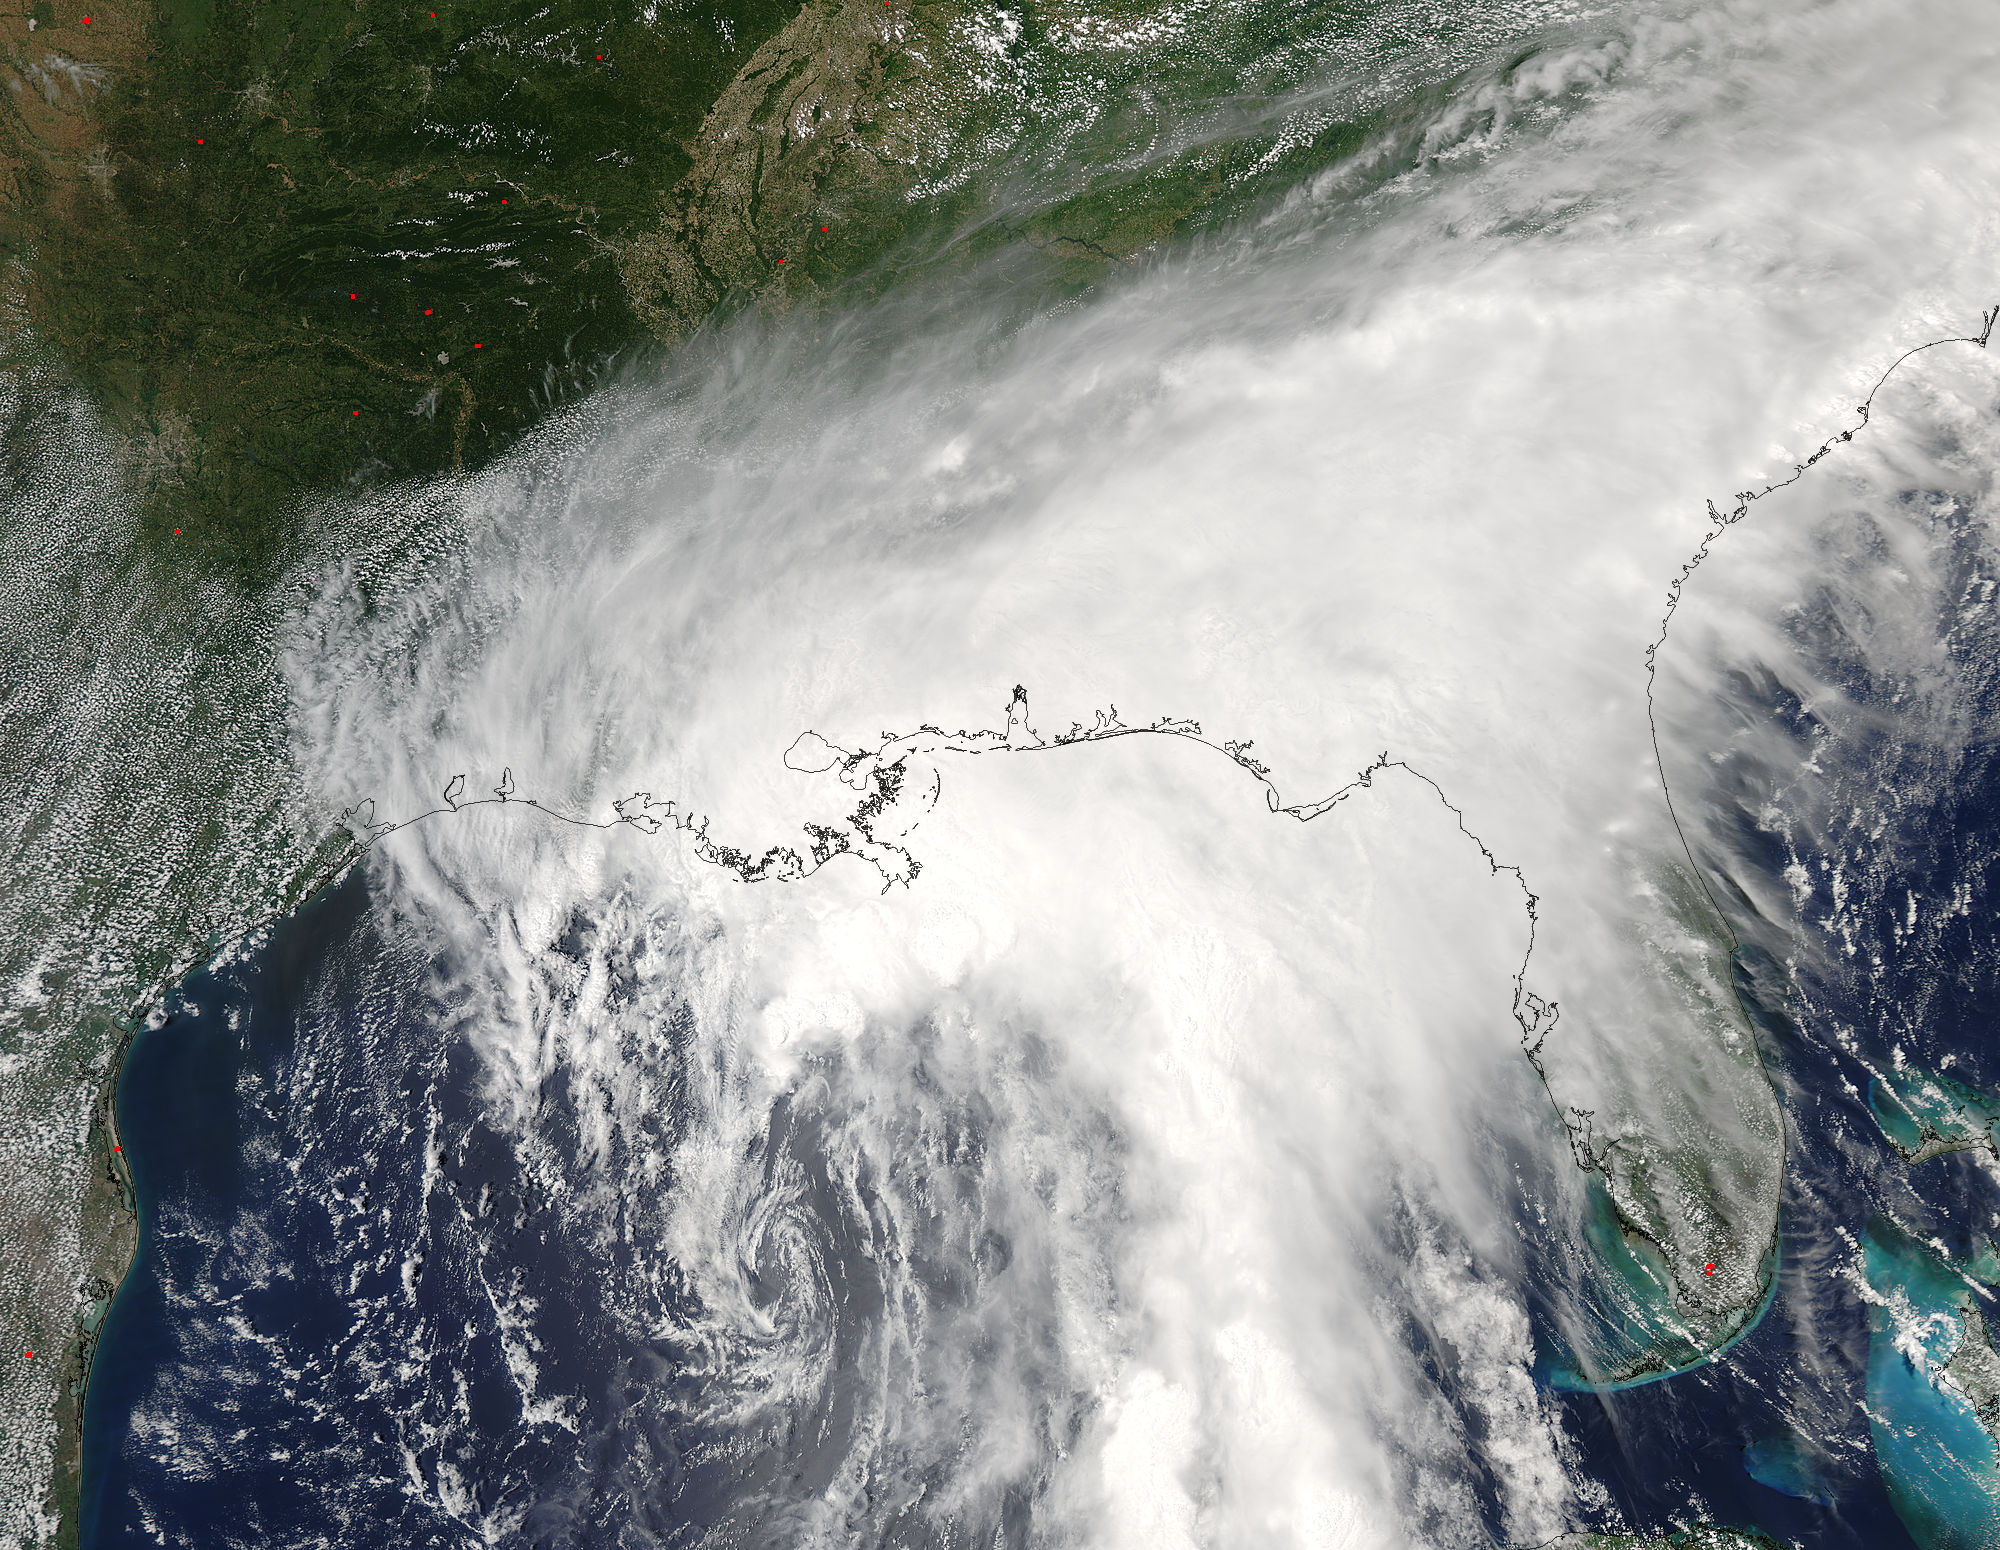
NASA’s Aqua satellite captured an image of Tropical Storm Cindy after it formed and was already affecting the U.S. Gulf Coast states. Cindy continues to crawl toward land and Tropical Storm warnings are in effect for June 21.
On June 21 at 11 a.m. EDT, a Tropical Storm Warning is in effect for San Luis Pass, Texas to the mouth of the Mississippi River.
When NASA’s Aqua satellite passed over the Gulf of Mexico on June 20 at 19:15 UTC (3:15 p.m. EDT), Tropical Depression 3 was already upgraded to Tropical Storm status and named Cindy. The storm was classified as a tropical storm at 2 p.m. EDT. The Moderate Resolution Imaging Spectroradiometer or MODIS instrument aboard Aqua showed Cindy’s center of circulation in the central Gulf of Mexico with a large area of thunderstorms sweeping from northwest to southeast of the center, stretching from eastern Texas to Florida.
The National Hurricane Center or NHC noted on June 21 that “Heavy rainfall could produce life-threatening flash flooding across portions of the northern Gulf coast.”
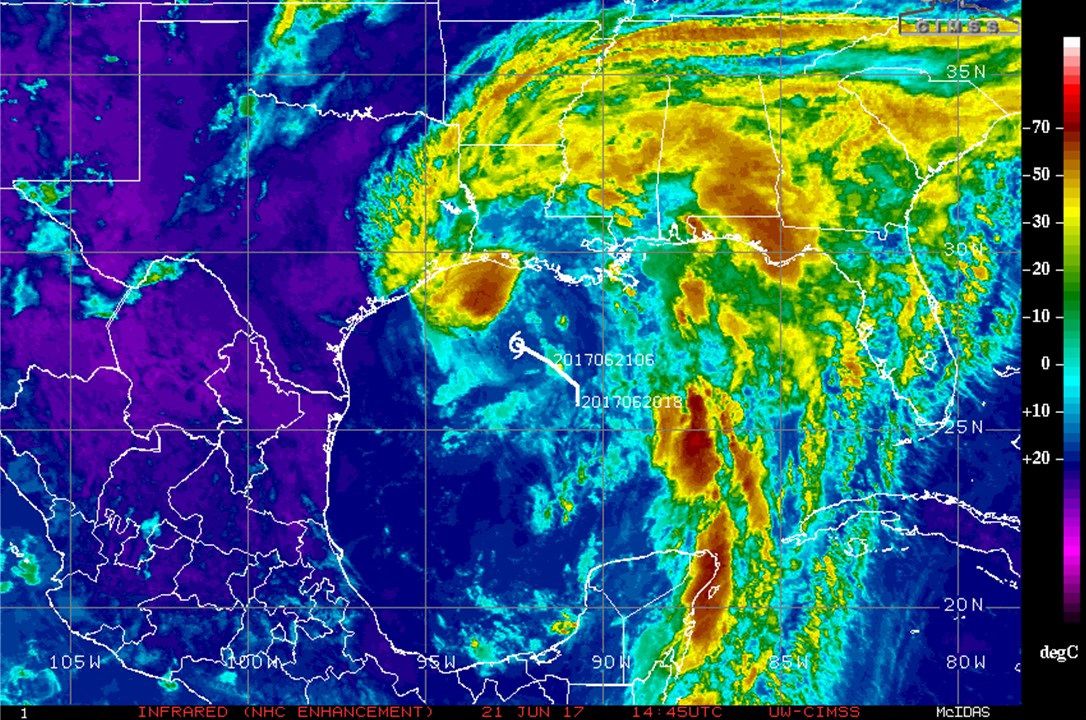
An enhanced image from NOAA’s GOES-East satellite was created by the University of Wisconsin-Madison Cooperative Institute for Meteorological Satellite Studies or CIMSS. The image showed cloud top temperatures in bands of thunderstorms north and east of Tropical Storm Cindy’s center on June 21 at 14:45 UTC (10:45 a.m. EDT). Some of those temperatures were as cold as minus 70 degrees Fahrenheit. Those are strong storms that were located over the Gulf of Mexico just south of Galveston, over the Florida panhandle, and over the central Gulf of Mexico. Storms with cloud top temperatures that cold have been found to generate heavy rainfall.
At 11 a.m. EDT (1500 UTC), the center of Tropical Storm Cindy was located near latitude 27.6 degrees north and longitude 92.6 degrees west. That’s about 265 miles (430 km) south of Morgan City, Louisiana, and 355 miles (565 km) southeast of Galveston, Texas.
NHC said “Cindy is moving toward the northwest near 10 mph (17 kph), and this motion is expected to continue today. A turn toward the north-northwest and then toward the north is expected tonight and Thursday. On the forecast track, the center of Cindy will approach the coast of southwest Louisiana and southeast Texas late today or tonight, and move inland over southeastern Texas or southwestern Louisiana on Thursday, [June 22].”
Surface observations and reports from an Air Force Reserve Hurricane Hunter aircraft indicate that maximum sustained winds are now near 50 mph (85 kph) with higher gusts. Little change in strength is expected before landfall, with weakening expected thereafter.
Storm surge, tropical storm force winds, isolated tornadoes and heavy rain are expected. NHC noted that Cindy is expected to produce total rain accumulations of 6 to 9 inches with isolated maximum amounts of 12 inches over southeastern Louisiana, southern Mississippi, southern Alabama, and the Florida Panhandle through Thursday. Rainfall amounts of 3 to 5 inches with isolated maximum amounts of 6 inches can be expected farther west across southwest Louisiana into southeast Texas through Thursday.
For updated forecasts, visit the NHC website at: www.nhc.noaa.gov.
By Rob Gutro
NASA’s Goddard Space Flight Center
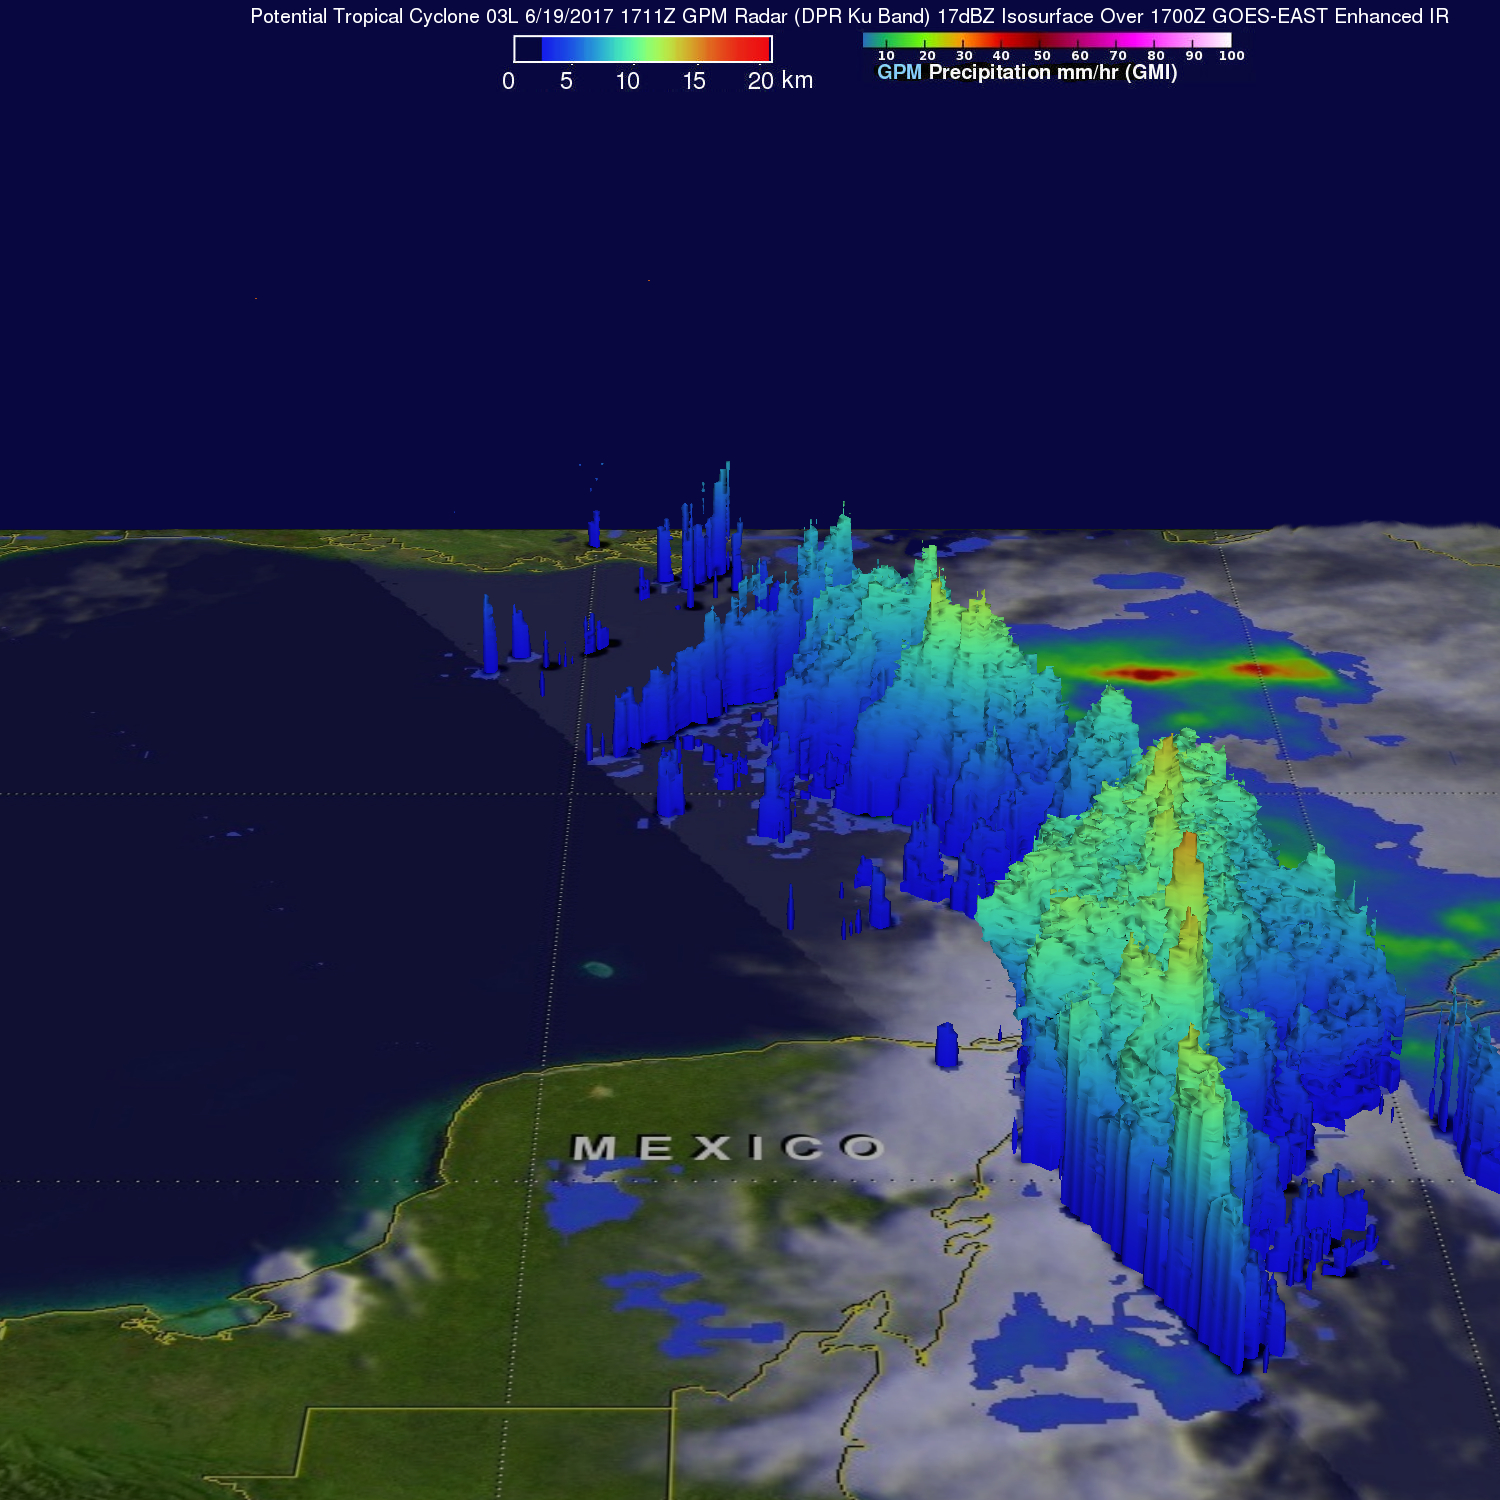
June 20, 2017 – NASA Examines Potential Tropical or Sub-Tropical Storm Affecting Gulf States
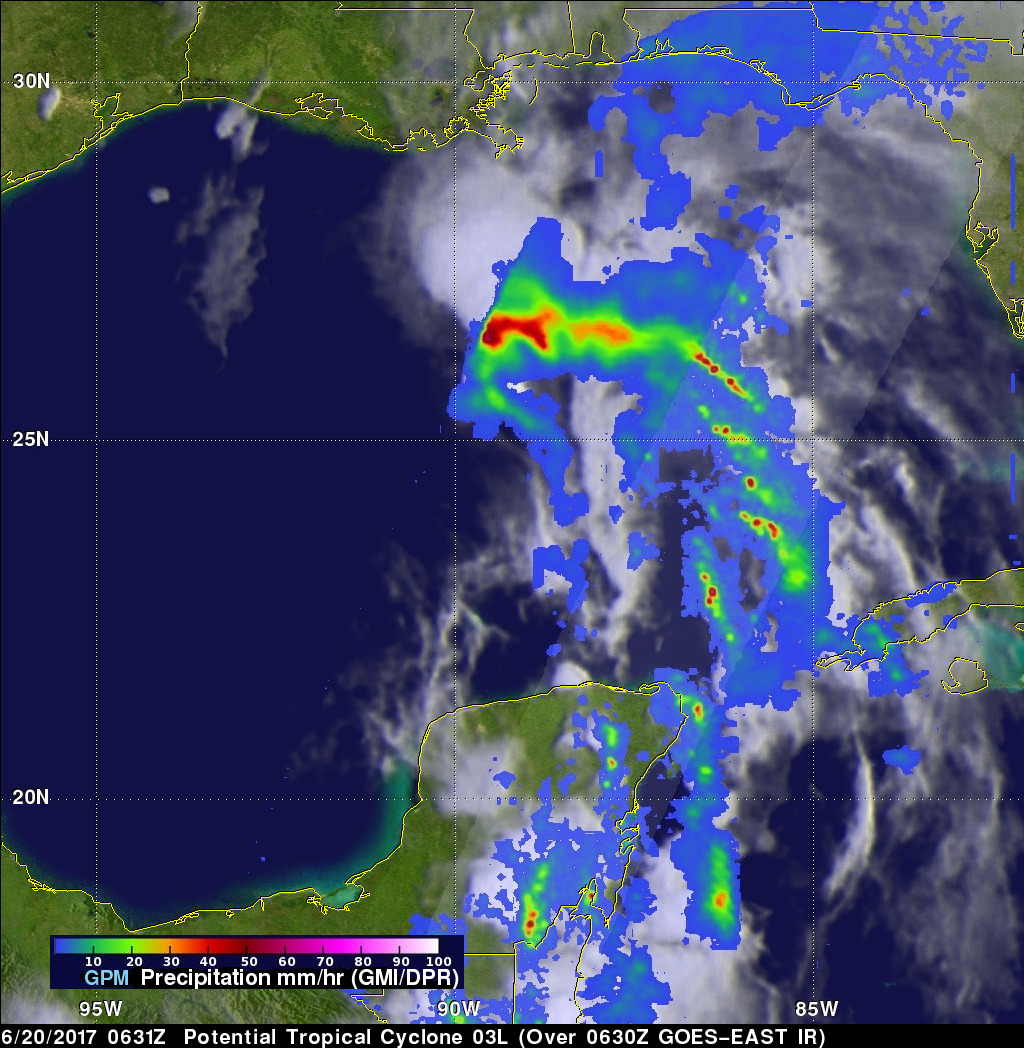
NASA’s Global Precipitation Measurement mission or GPM core satellite passed over a developing low pressure area in the Gulf of Mexico and gathered two days of rainfall and storm height information. The disturbance could become Tropical or Sub-tropical Storm Cindy in the next couple days.
The developing storm has already triggered Tropical Storm Warnings and Watches along the U.S. Gulf Coast. A Tropical Storm Warning is in effect for High Island, Texas to the Mouth of the Pearl River. The Pearl River serves as the 115-mile (185 km) boundary between Mississippi and Louisiana in its lower reach near the Gulf of Mexico. A Tropical Storm Watch is in effect for West of High Island to San Luis Pass, Texas.
NASA’s GPM satellite provides information on precipitation from its orbit in space and is a joint mission between NASA and the Japan Aerospace Exploration Agency known as JAXA. GPM also utilizes a constellation of other satellites to provide a global analysis if precipitation. At NASA’s Goddard Space Flight Center in Greenbelt, Maryland, those data are incorporated into NASA’s IMERG or Integrated Multi-satellitE Retrievals to provide a total picture of precipitation events.
On June 19, 2017 at 1:11 p.m. EDT (17:11 UTC) GPM passed above the Gulf of Mexico. GPM’s Microwave Imager (GMI) and Dual-Frequency Precipitation Radar (DPR) instruments showed that the forming tropical cyclone was dumping heavy rainfall in an area from the center of the Gulf of Mexico into the north-western Caribbean. DPR data indicated that a line of powerful convective storms was dropping rain at a rate of over 10.4 inches (265 mm) per hour in the Yucatan Channel between Mexico and Cuba.
When GPM passed over the region the next day, June 20 at 2:21 a.m. EDT (0631 UTC), data gathered showed that the potential tropical cyclone was producing bands of rainfall over much of the eastern Gulf of Mexico. Rainfall was measured in some of these intense rain bands falling at a rate of over 8.7 inches (220 mm) per hour.
GPM’s radar (DPR Ku Band) data collected with the June 20, 2017 pass were used to show the 3-D vertical structure of precipitation within Tropical Depression 3. Storm top heights in powerful convective storms east of the Yucatan Peninsula were found to reach heights greater than 10 miles (16.2 km).
At 11 a.m. EDT (1500 UTC) on June 20 the disturbance was centered near latitude 25.9 North and longitude 90.5 West. That’s about 265 miles (430 km) south of Morgan City, Louisiana and about 355 miles (565 km) southeast of Galveston, Texas.
Credits: NASA/JAXA, Hal Pierce
The National Hurricane Center (NHC) said “The system is moving toward the northwest near 10 mph (17 kph) and this motion is expected to continue through Wednesday night. A turn toward the north-northwest is forecast early Thursday. On the forecast track, the disturbance is expected to be near the southwest Louisiana coast late Wednesday or Wednesday night, and move inland over western Louisiana and eastern Texas on Thursday. Maximum sustained winds are near 40 mph (65 kph) with higher gusts. Some slight strengthening is possible before the system reaches the coast.”
NHC noted that the depression will likely become a tropical or subtropical cyclone today, June 20.
For updated forecasts, visit the National Hurricane Center website: www.nhc.noaa.gov
By Harold F. Pierce/Rob Gutro
NASA’s Goddard Space Flight Center