


Post-Tropical Cyclone Kenneth Spinning Down
Former Tropical Storm Kenneth continues to maintain gale-force winds but appears to be devoid of any strong thunderstorms in satellite imagery.
At 5 p.m. EDT (2100 UTC) on Aug. 23 the National Hurricane Center (NHC) issued the final advisory on Kenneth. NHC said the center of Post-Tropical Cyclone Kenneth was located near 25.4 degrees north latitude and 135.6 degrees west longitude. Maximum sustained winds were near 40 mph (65 kph).
By 2 a.m. EDT (0600 UTC) on Aug. 24, Post-Tropical Cyclone Kenneth was located near 26 degrees north latitude and 137 degrees west longitude. NHC noted that Kenneth remains a well-organized gale-force tropical low pressure area. The estimated minimum central pressure is 1008 millibars and the maximum sustained winds remained near 35 knots (40 mph/65 kph).
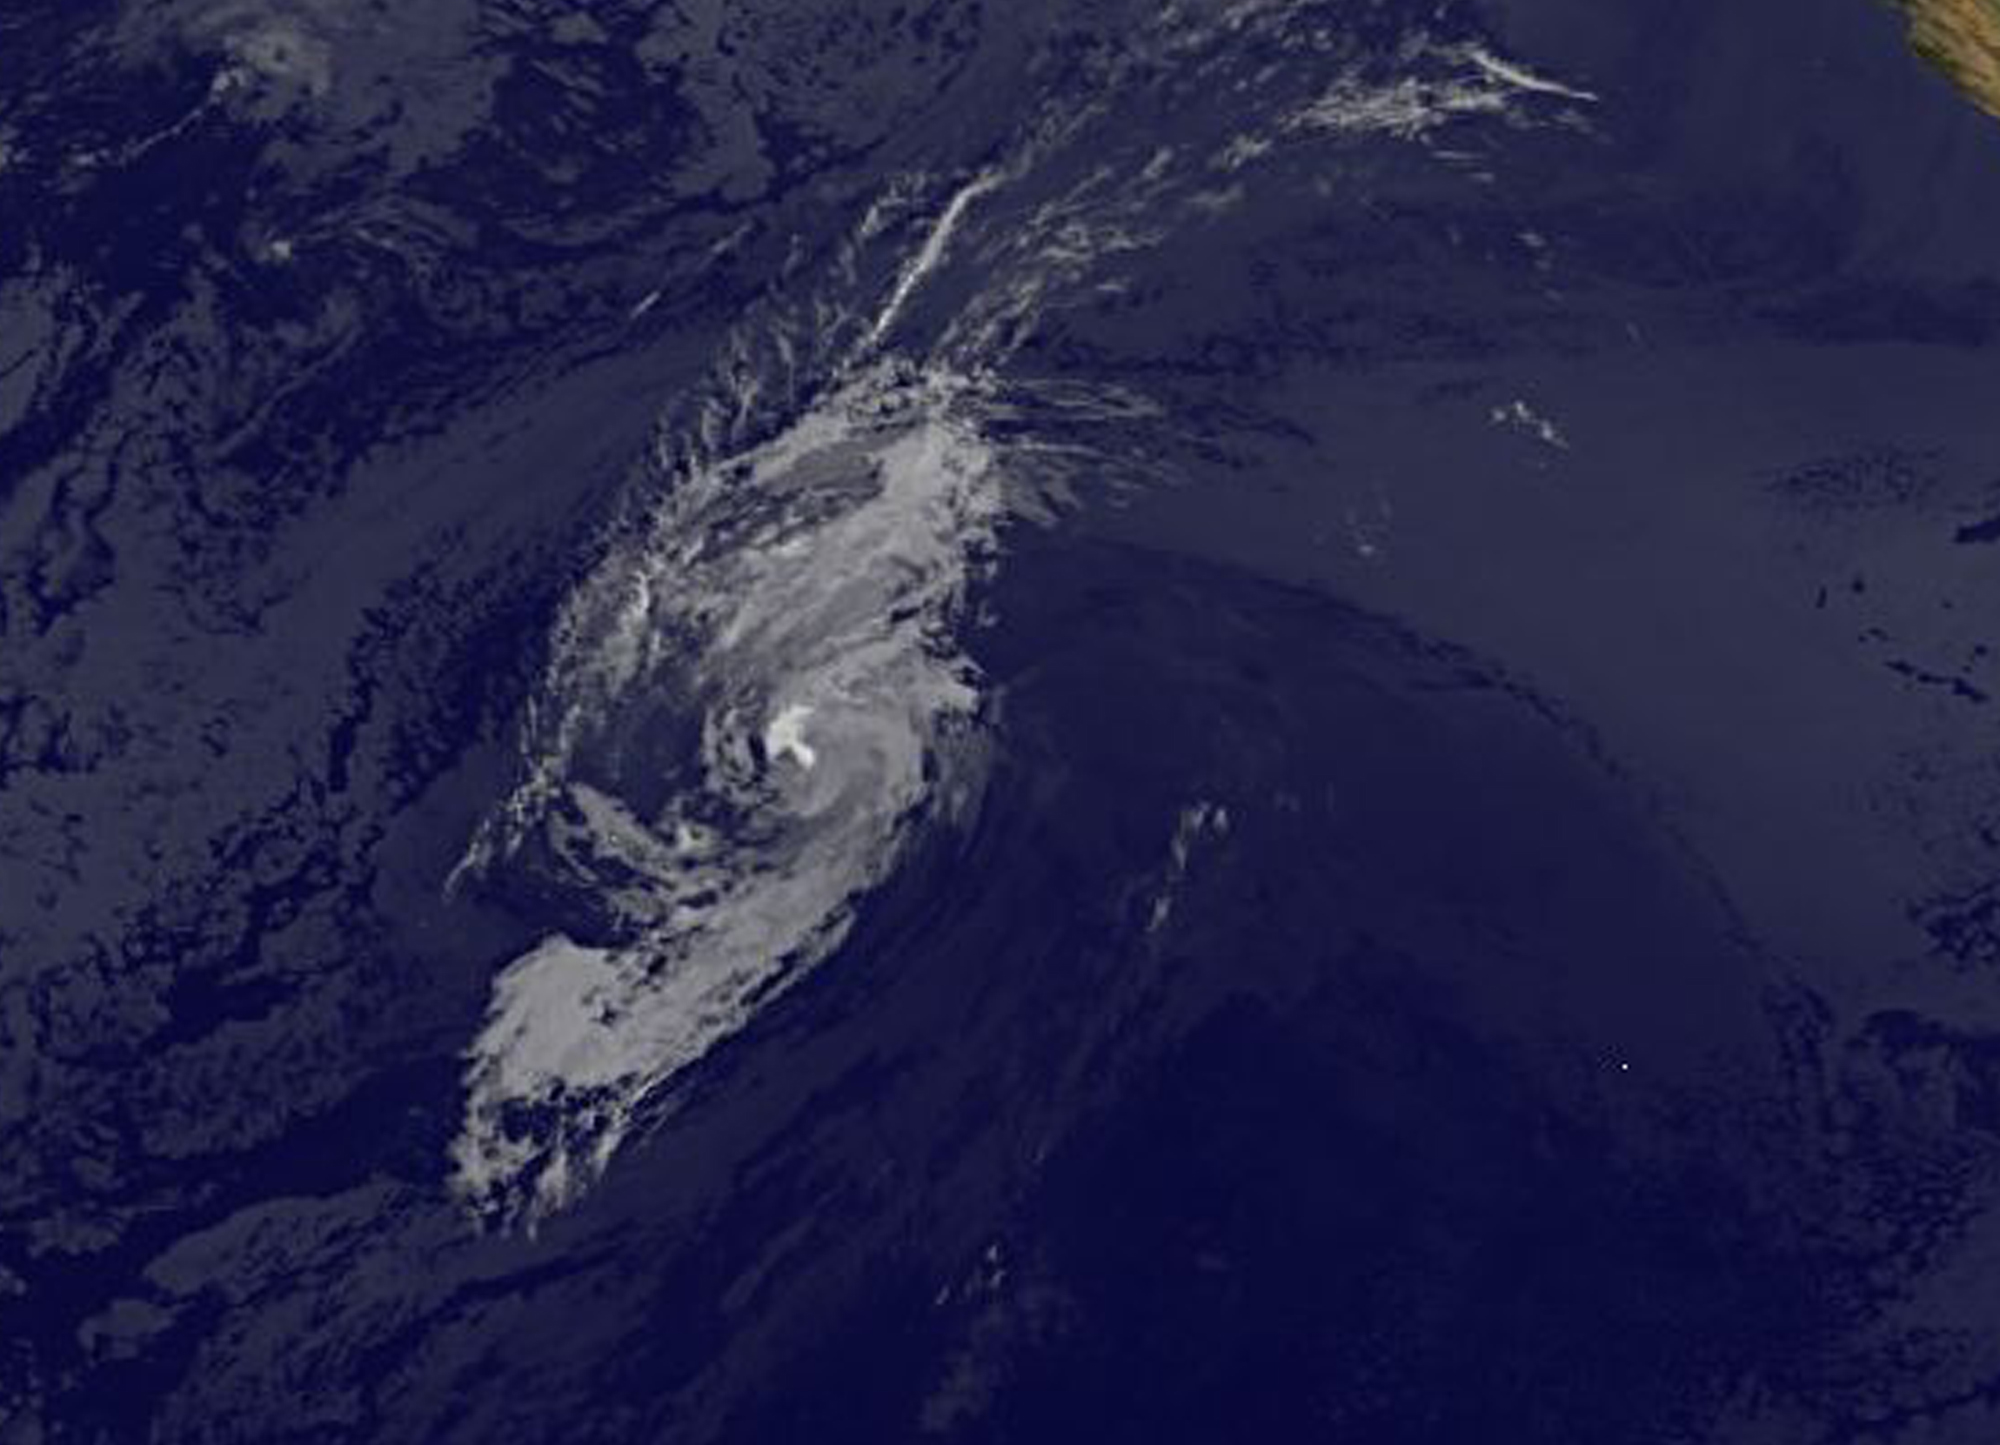
At 8:00 a.m. EDT (1200 UTC) on Aug. 24 NOAA’s GOES-West satellite captured an infrared image of Kenneth. The image showed that the storm was devoid of any strong thunderstorms and without deep convection.
NOAA manages the GOES series of satellites. NASA/NOAA’s GOES Project at NASA’s Goddard Space Flight Center in Greenbelt, Maryland uses the satellite data to create imagery.
The post-tropical cyclone was moving toward the north-northwest and that general direction of motion with a gradual decrease in forward speed is expected over the next couple of days as the storm weakens.
By Rob Gutro
NASA’s Goddard Space Flight Center
Aug. 23, 2017 – Tropical Storm Kenneth Battered by Wind Shear on Satellite Imagery
Satellite imagery revealed that wind shear and cooler sea surface temperatures have taken their toll on the once hurricane Kenneth. Kenneth has now weakened to a tropical storm and continues to be torn apart as seen in imagery from NOAA’s GOES-West satellite.

NOAA’s GOES-West satellite captured an infrared image of Tropical Storm Kenneth on Aug. 23, 2017 at 8:00 a.m. EDT (1200 UTC) in the Eastern Pacific Ocean. The image showed that the bulk of clouds appeared on the north-northwestern side of the storm, which indicates wind shear was affecting the storm. The imagery also showed continued deterioration of Kenneth’s cloud pattern.
National Hurricane Center (NHC) forecaster Roberts noted “A moderate southwesterly wind shear regime and oceanic temperatures of less than 24.5 Celsius (76.1 degrees Fahrenheit) have certainly taken its toll on the cyclone.”
At 5 a.m. EDT (0900 UTC) on Aug.23 the center of Tropical Storm Kenneth was located near 23.5 degrees north latitude and 134.3 degrees west longitude. That’s about 1,545 miles (2,490 km) west of the southern tip of Baja California, Mexico. Kenneth was moving toward the north-northwest near 10 mph (17 kph), and this general motion with a gradual decrease in forward speed is expected during the next couple of days.
Maximum sustained winds have decreased to near 60 mph (95 kph) with higher gusts. Continued weakening is forecast. The estimated minimum central pressure is 999 millibars.
The National Hurricane Center expects Kenneth to become a remnant low pressure area later on Aug. 23 or Thursday, Aug. 24.
For updated forecasts on Kenneth, visit: www.nhc.noaa.gov.
By Rob Gutro
NASA’s Goddard Space Flight Center
Aug. 22, 2017 – NASA Finds Wind Shear Weakening Hurricane Kenneth
Hurricane Kenneth was quickly weakening early on Aug. 22 as a result of vertical wind shear. Infrared imagery from NASA’s Aqua satellite showed that the strongest storms associated with the hurricane were pushed away from the center.
Wind shear is a measure of how the speed and direction of winds change with altitude.
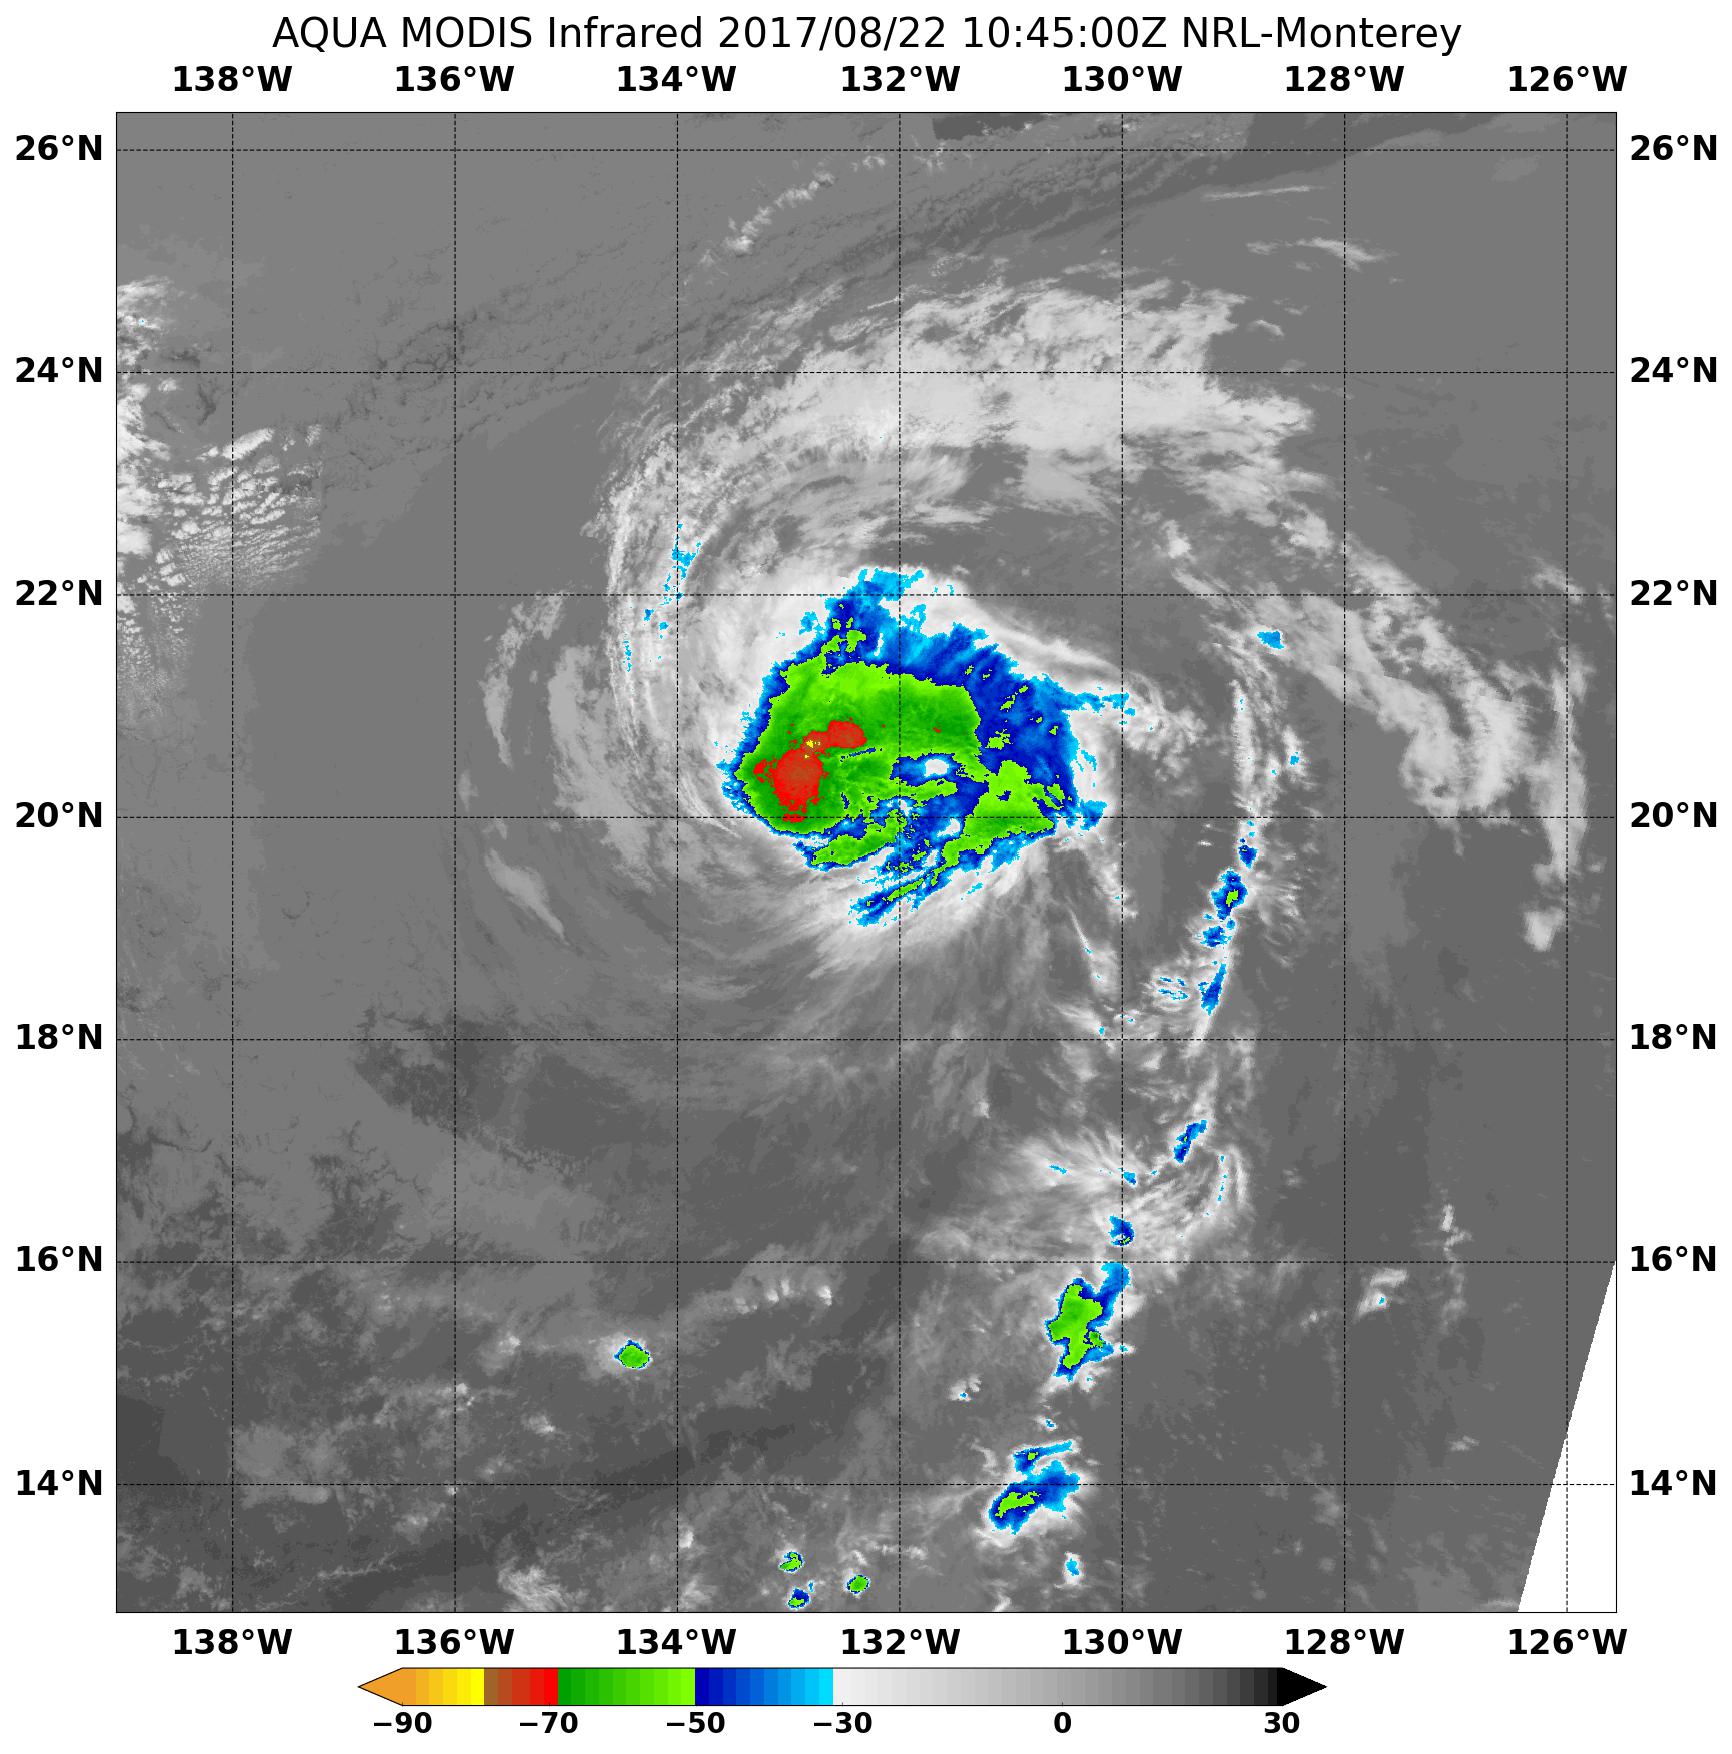
On Aug. 22 at 6:45 a.m. EDT (1045 UTC) the Moderate Resolution Imaging Spectroradiometer or MODIS instrument aboard NASA’s Aqua satellite provided an infrared image of Kenneth. Infrared satellite imagery showed a deteriorating system with warming cloud tops being affected by wind shear. When cloud tops warm, they are less high in the atmosphere, because the uplift of air weakened. It’s a sign that the storm is losing strength.
Coldest cloud top temperatures were as cold as minus 70 degrees Fahrenheit (minus 56.6 degrees Celsius). NASA research indicates very cold cloud tops with the potential to generate very heavy rainfall.
The National Hurricane Center (NHC) noted that recent microwave images showed the inner-core structure has eroded and that the low-level center is displaced to the southwest of the mid-level center because of moderate southwesterly vertical shear.
At 5 a.m. EDT (0900 UTC) the center of Hurricane Kenneth was located near 20.0 degrees north latitude and 132.5 degrees west longitude. That’s about 1,465 miles (2,355 km) west of the southern tip of Baja California, Mexico. Kenneth was moving toward the northwest near 10 mph (17 kph), and a turn toward the north-northwest is expected later today.
Maximum sustained winds have decreased to near 90 mph (150 kph) with higher gusts. The estimated minimum central pressure is 978 millibars.
The NHC expects Kenneth to continue weaken rapidly over the next day or two as it moves over cooler sea surface temperatures and into an area where wind shear is forecast to increase. NHC forecasters said Kenneth should weaken to a tropical storm later today and become post-tropical in 2-3 days, if not sooner.
For updated forecasts on Kenneth, visit: www.nhc.noaa.gov.
By Rob Gutro
NASA’s Goddard Space Flight Center
Aug. 21, 2017 – NASA Sees Major Hurricane Kenneth in Eastern Pacific
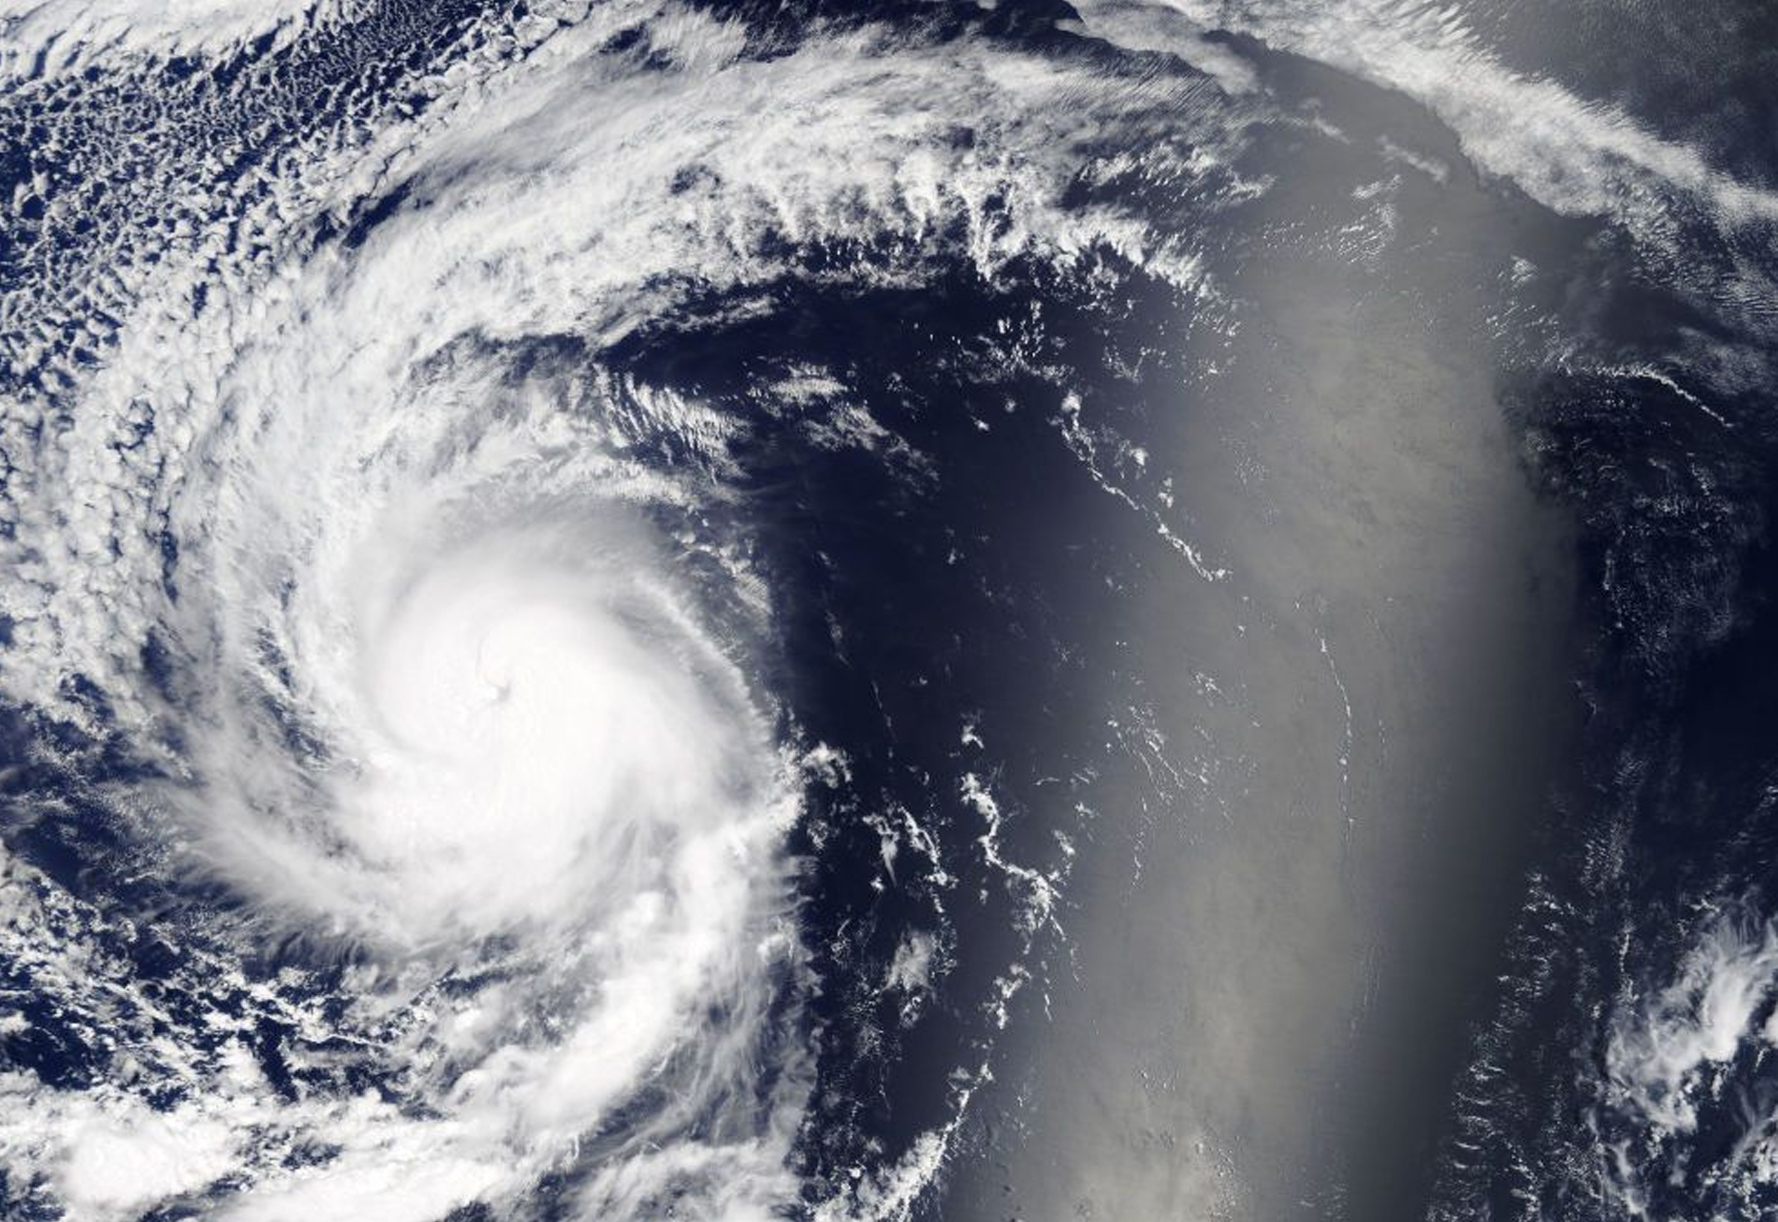
Former Tropical Depression 13E has strengthened into a Major Hurricane on the Saffir-Simpson Hurricane Wind Scale. NASA’s Terra satellite passed over Kenneth and captured an image that showed a well-developed storm with a visible eye.
On Friday, Aug. 18 at 11 p.m. EDT Tropical Depression 13E strengthened into Tropical Storm Kenneth. Just 48 hours later at 11 p.m. EDT on August 20, Kenneth became a hurricane.
The Moderate Resolution Imaging Spectroradiometer or MODIS instrument that flies aboard NASA’s Terra satellite captured a visible-light image of Kenneth at 4:30 p.m. EDT on Sunday, Aug. 20, 2017. It showed powerful thunderstorms wrapped around the center of the visible 15 nautical-mile wide eye. Infrared satellite imagery showed that the cloud tops of the surrounding ring of convection has cooled indicating they have strengthened as the storms have pushed higher into the troposphere.
At 5 a.m. EDT (0900 UTC) on Aug. 21 the center of Hurricane Kenneth was located near 17.4 degrees north latitude and 130.0 degrees west longitude. That’s 1,355 miles west-southwest of Baja California, Mexico. Kenneth was moving toward the west-northwest near 10 mph (17 kph) and the National Hurricane Center (NHC) forecasts a turn toward the northwest, then north-northwest over the next couple of days.
Maximum sustained winds have increased to near 130 mph (215 kph) with higher gusts. Kenneth is a category 4 hurricane on the Saffir-Simpson Hurricane Wind Scale. The estimated minimum central pressure is 952 millibars.
A little additional strengthening is possible this morning, before weakening begins tonight.
For updates from the National Hurricane Center, visit: www.nhc.noaa.gov.
By Rob Gutro
NASA’s Goddard Space Flight Center
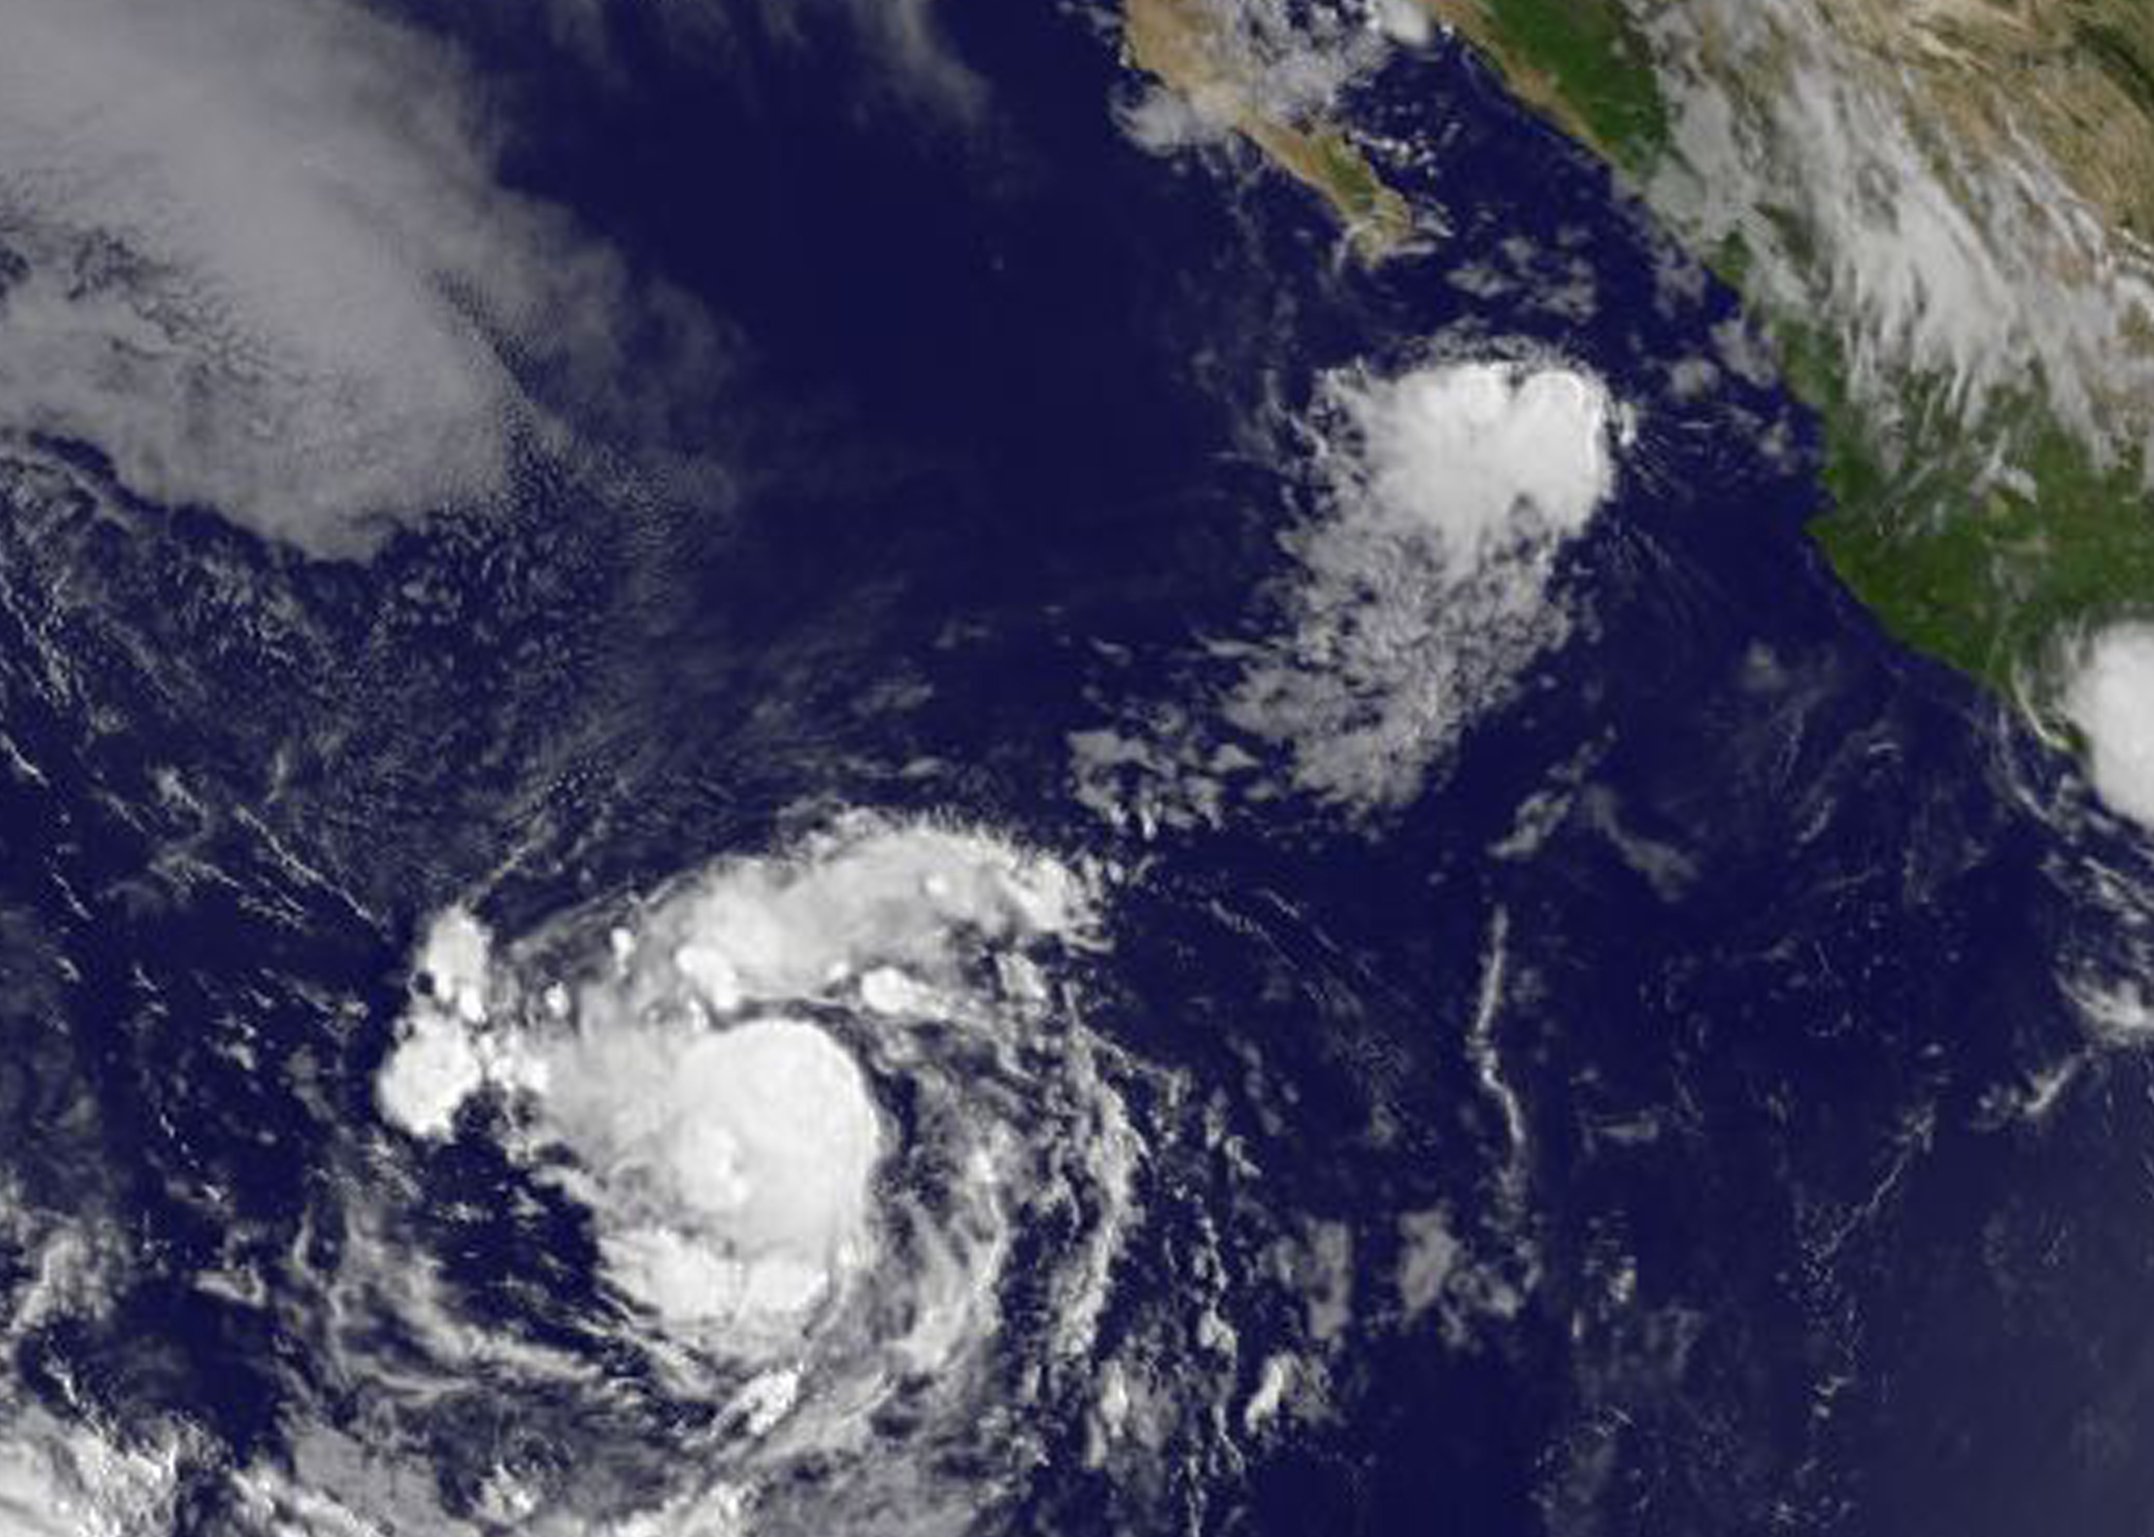
Aug. 18, 2017 – Satellite Sees the Formation of Eastern Pacific’s Tropical Depression 13E
The thirteenth tropical depression of the Eastern Pacific Ocean season formed on Aug. 18. NOAA’s GOES-Wet satellite captured an image of the new storm.
At 11 a.m. EDT (1500 UTC), the center of Tropical Depression Thirteen-E (TD13E) was located near latitude 14.8 North, longitude 116.5 West. That puts the center about 705 miles (1,135 km) southwest of the southern tip of Baja California, Mexico. The depression is no threat to any land areas.
The depression is moving toward the west-northwest near 15 mph (24 km/h), and this motion is expected to continue for the next several days. Maximum sustained winds are near 35 mph (55 kph) with higher gusts. The estimated minimum central pressure is 1006 millibars.
NOAA’s GOES-East satellite provided a visible-light image of TD13-E at 11 a.m. EDT (1500 UTC). Thunderstorms associated with the low pressure area had become better organized since the early morning hours and a band of thunderstorms wrapped around the western half of the circulation.
The NASA/NOAA GOES Project at NASA’s Goddard Space Flight Center in Greenbelt, Maryland created an image. NOAA manages the GOES series of satellites and the NASA/NOAA GOES Project creates images and animations from the data.
The depression is forecast to strengthen and will likely reach hurricane strength by the end of the weekend of Aug. 19 and 20.
For updates on Tropical Depression 13E, visit: www.nhc.noaa.gov.
By Rob Gutro
NASA’s Goddard Space Flight Center