


NASA Sees Tropical Storm Fernanda Sliding into Central Pacific
Tropical Storm Fernanda has crossed the 140 degree longitude line and entered the central Pacific Ocean. NASA’s Global Precipitation Measurement mission, or GPM, satellite took a look at the rainfall the weakening system was still generating as it moves toward Hawaii.
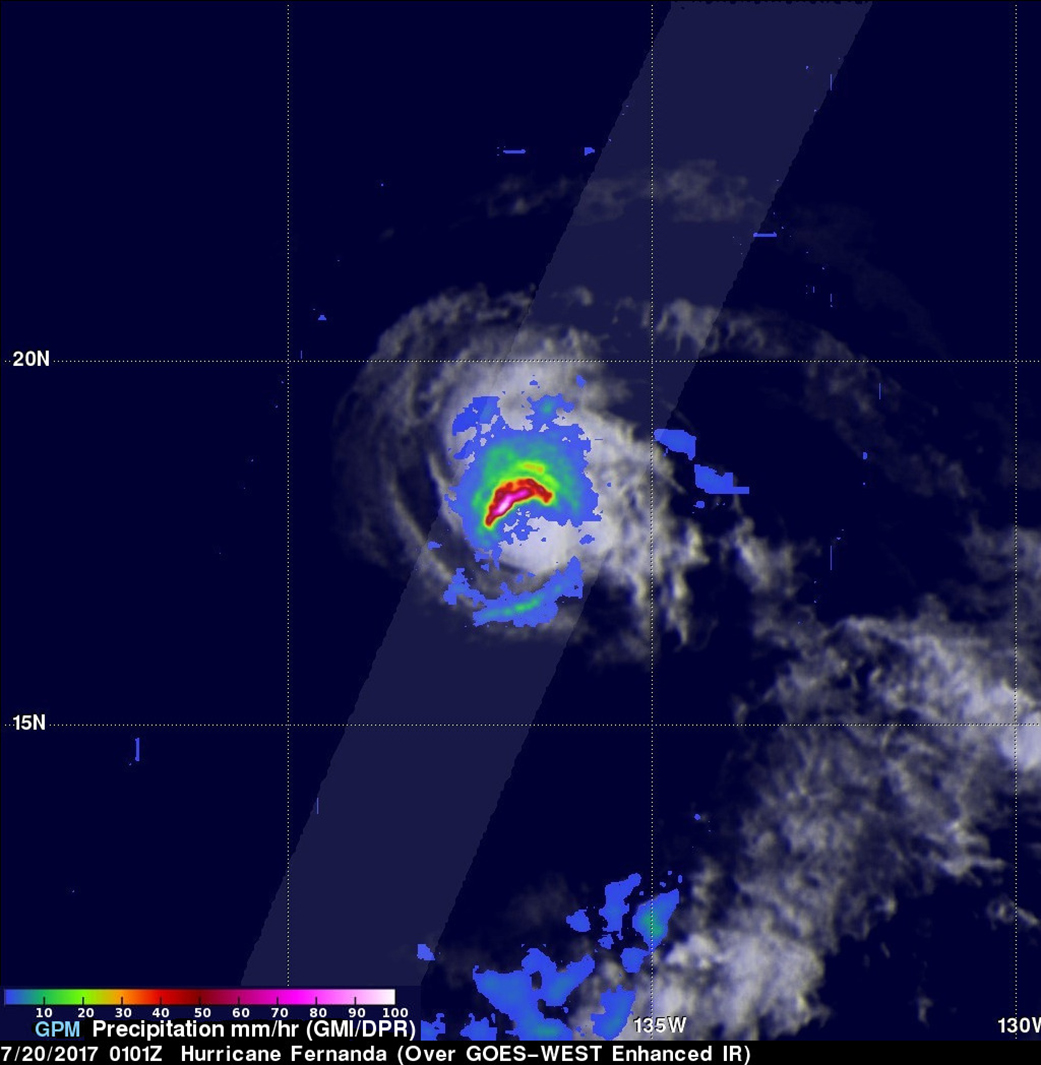
The GPM Core Observatory, a mission jointly operated by NASA and the Japan Aerospace Exploration Agency known as JAXA, had an exceptional view of hurricane Fernanda when it flew overhead on July 19 at 9:01 p.m. (July 20, 0101 UTC). GPM saw a much different hurricane than it viewed a couple days earlier. GPM’s Microwave Imager (GMI) and Dual-Frequency Precipitation Radar (DPR) radar instruments found that the dissipating hurricane only contained heavy rainfall in its northwestern quadrant.
Cooler water, dry air, and southwesterly vertical wind shear had caused Fernanda to weaken. GPM’s radar revealed that powerful convective storms in the northwestern quadrant of the dissipating hurricane were still dropping rain at a rate of almost 7.2 inches (183 mm) per hour. Very little rainfall was found by GPM in Fernanda’s southeastern side.
An examination of the hurricane’s precipitation structure showed that the highest storm tops were located in the strong storms northwest of Fernanda’s center. GPM showed that a few of these storms had tops that were reaching heights above 6.696 miles (10.8 km).
At 5 a.m. EDT on July 21 satellite data showed that deep convection has flared up to the northeast of the low level circulation center of Fernanda.
On Friday, July 21, 2017, at 5 a.m. EDT (0900 UTC/11 p.m. HST on July 20), the center of Tropical Storm Fernanda was located near 18.4 degrees north latitude and 142.5 degrees west longitude. That’s about 825 miles (1,330 km) east of Hilo, Hawaii. Fernanda was moving toward the west near 12 mph (19 kph) and a general motion toward the west-northwest is expected during the next couple of days. Maximum sustained winds are near 50 mph (85 kph) with higher gusts.
The forecast track for Fernanda takes the center of circulation just east of Maui, Molokai and Oahu late Sunday, July 23.
Forecaster Jelsema of NOAA’s Central Pacific Hurricane Center noted, “Fernanda remains in an unfavorable environment, with sea surface temperatures around 25 degrees Celsius, very dry air aloft, as well as strong southwesterly shear of around 30 knots. As a result, the forecast will continue to show slow and steady weakening, with Fernanda expected to become a tropical depression in a day, a remnant low in two days, then dissipating after three days.”
For updated forecasts on Fernanda, visit: http://www.prh.noaa.gov/cphc.
By Rob Gutro and Hal Pierce
NASA’s Goddard Space Flight Center, Greenbelt, Md.
July 20, 2017 – Fernanda Weakens to Tropical Storm
As of 5 a.m. July 20 (0900 UTC), Fernanda had weakened to tropical storm status. There are no coastal watches or warnings in effect.
The National Oceanic and Atmospheric Administration’s National Hurricane Center reported that the center of Tropical Storm Fernanda was located near 18.2 degrees north latitude, 137.7 degrees west longitude. Fernanda is moving toward the west-northwest near 9 mph (15 kph), and this general motion is expected to continue for the next couple of days.
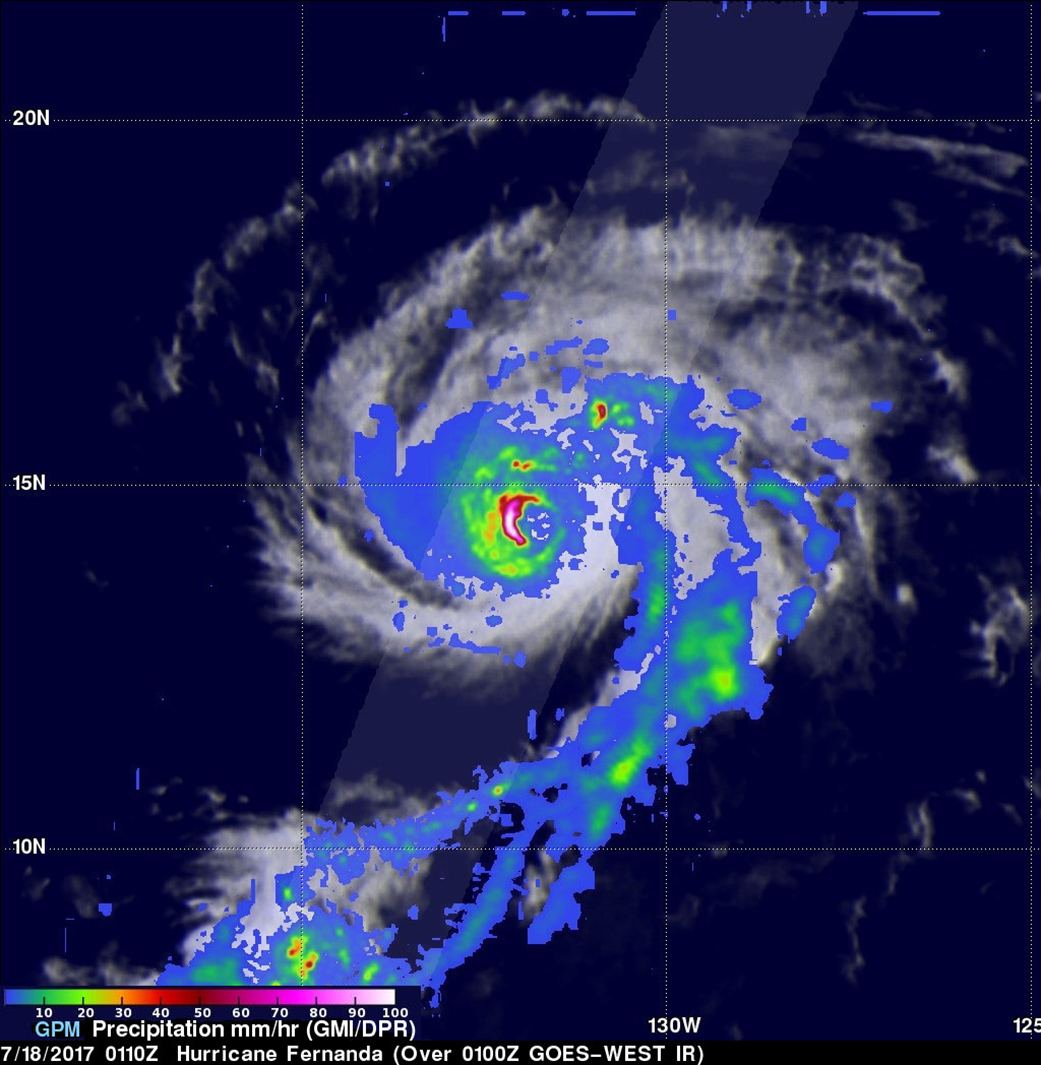
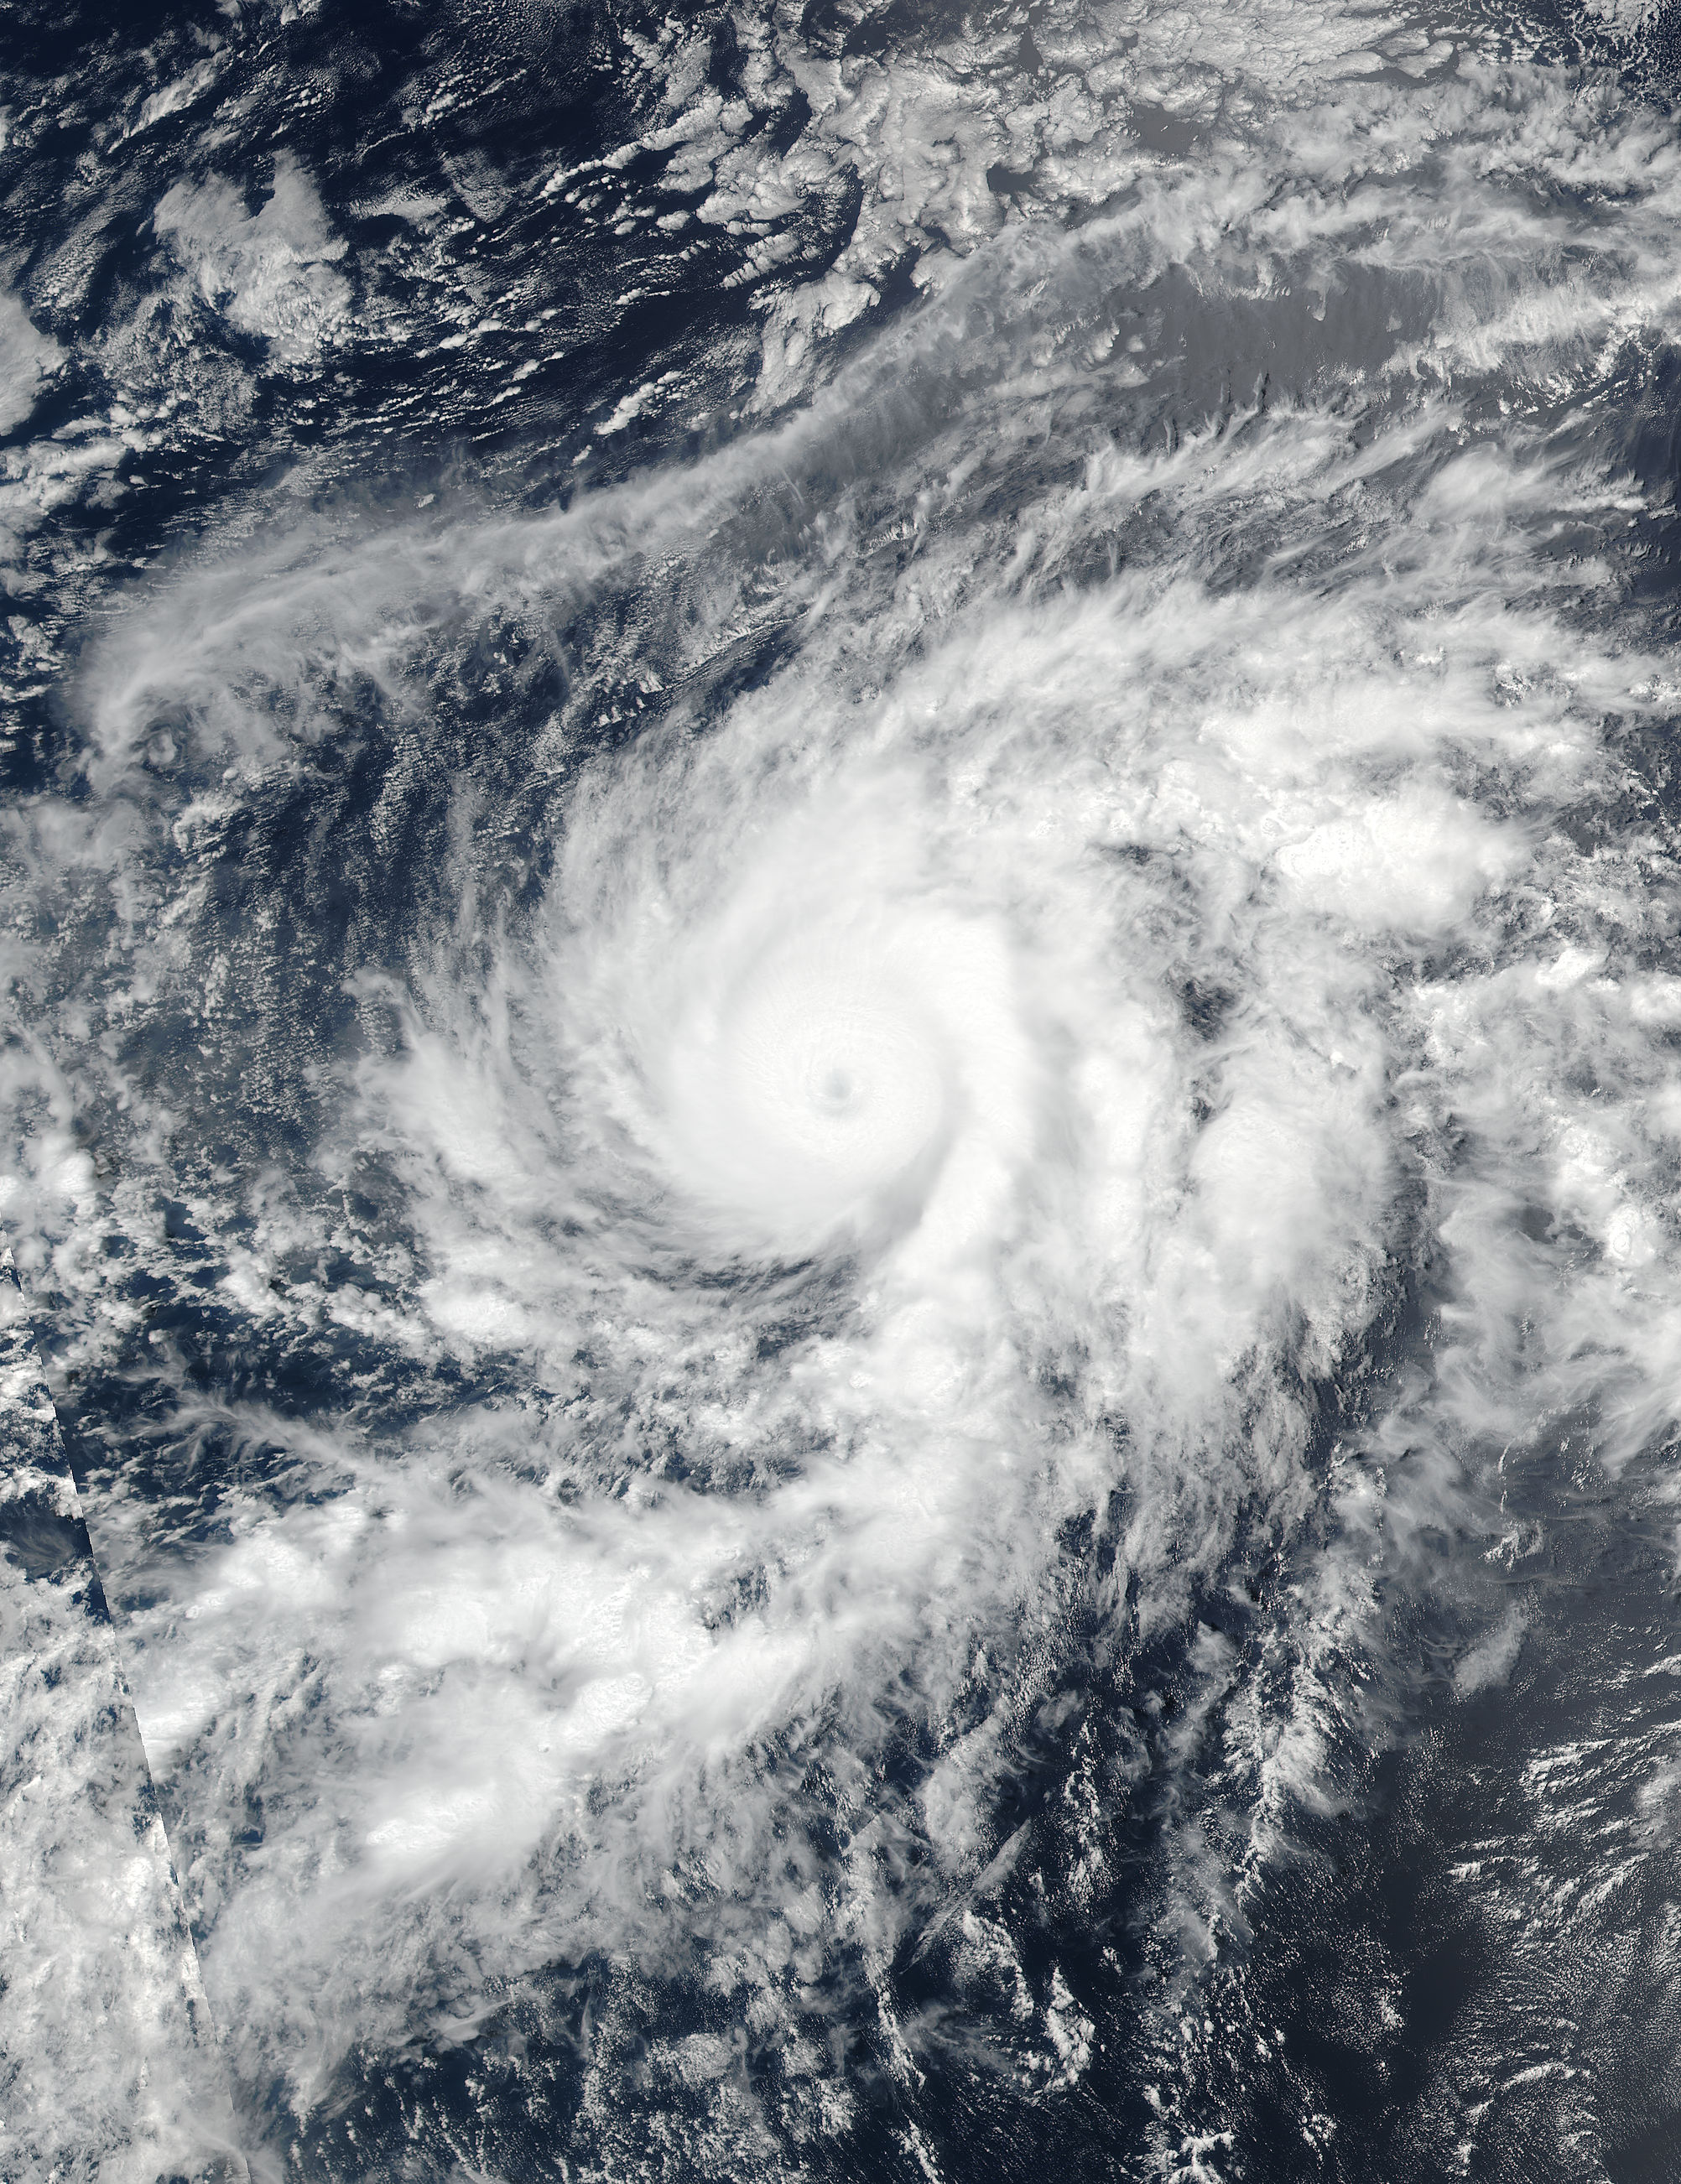
The Global Precipitation Measurement mission’s Core Observatory satellite, or GPM, had an excellent view of hurricane Fernanda at 5:10 p.m. July 17, 2017 (0110 UTC on July 18). At that time, Fernanda had weakened from its peak wind speed of 143.75 mph (125 knots) attained on July 15, 2017, but the storm (then at category two on the Saffir-Simpson hurricane wind scale) still had maximum sustained wind speeds of about 109 mph (95 knots).
Maximum sustained winds have since decreased to near 70 mph (110 kph) with higher gusts, the NHC reports. Additional weakening is forecast during the next 48 hours, and Fernanda could become a tropical depression by late Friday.
GPM is a joint mission between NASA and the Japan Aerospace Exploration Agency.
By Hal Pierce and Rob Gutro
NASA’s Goddard Space Flight Center, Greenbelt, Md.
July 19, 2017, – Satellite Shows a Weaker Hurricane Fernanda
Hurricane Fernanda appears to be weakening on infrared satellite imagery. NOAA’s GOES-West satellite imagery on July 19 showed a more disorganized hurricane nearing the Central Pacific Ocean.
NOAA’s GOES-West satellite captured an infrared image of Hurricane Fernanda on July 19 at 8 a.m. EDT (1200 UTC). The National Hurricane Center noted that Fernanda’s convective cloud pattern has continued to wither, and has been accompanied by a general warming of the cloud tops.
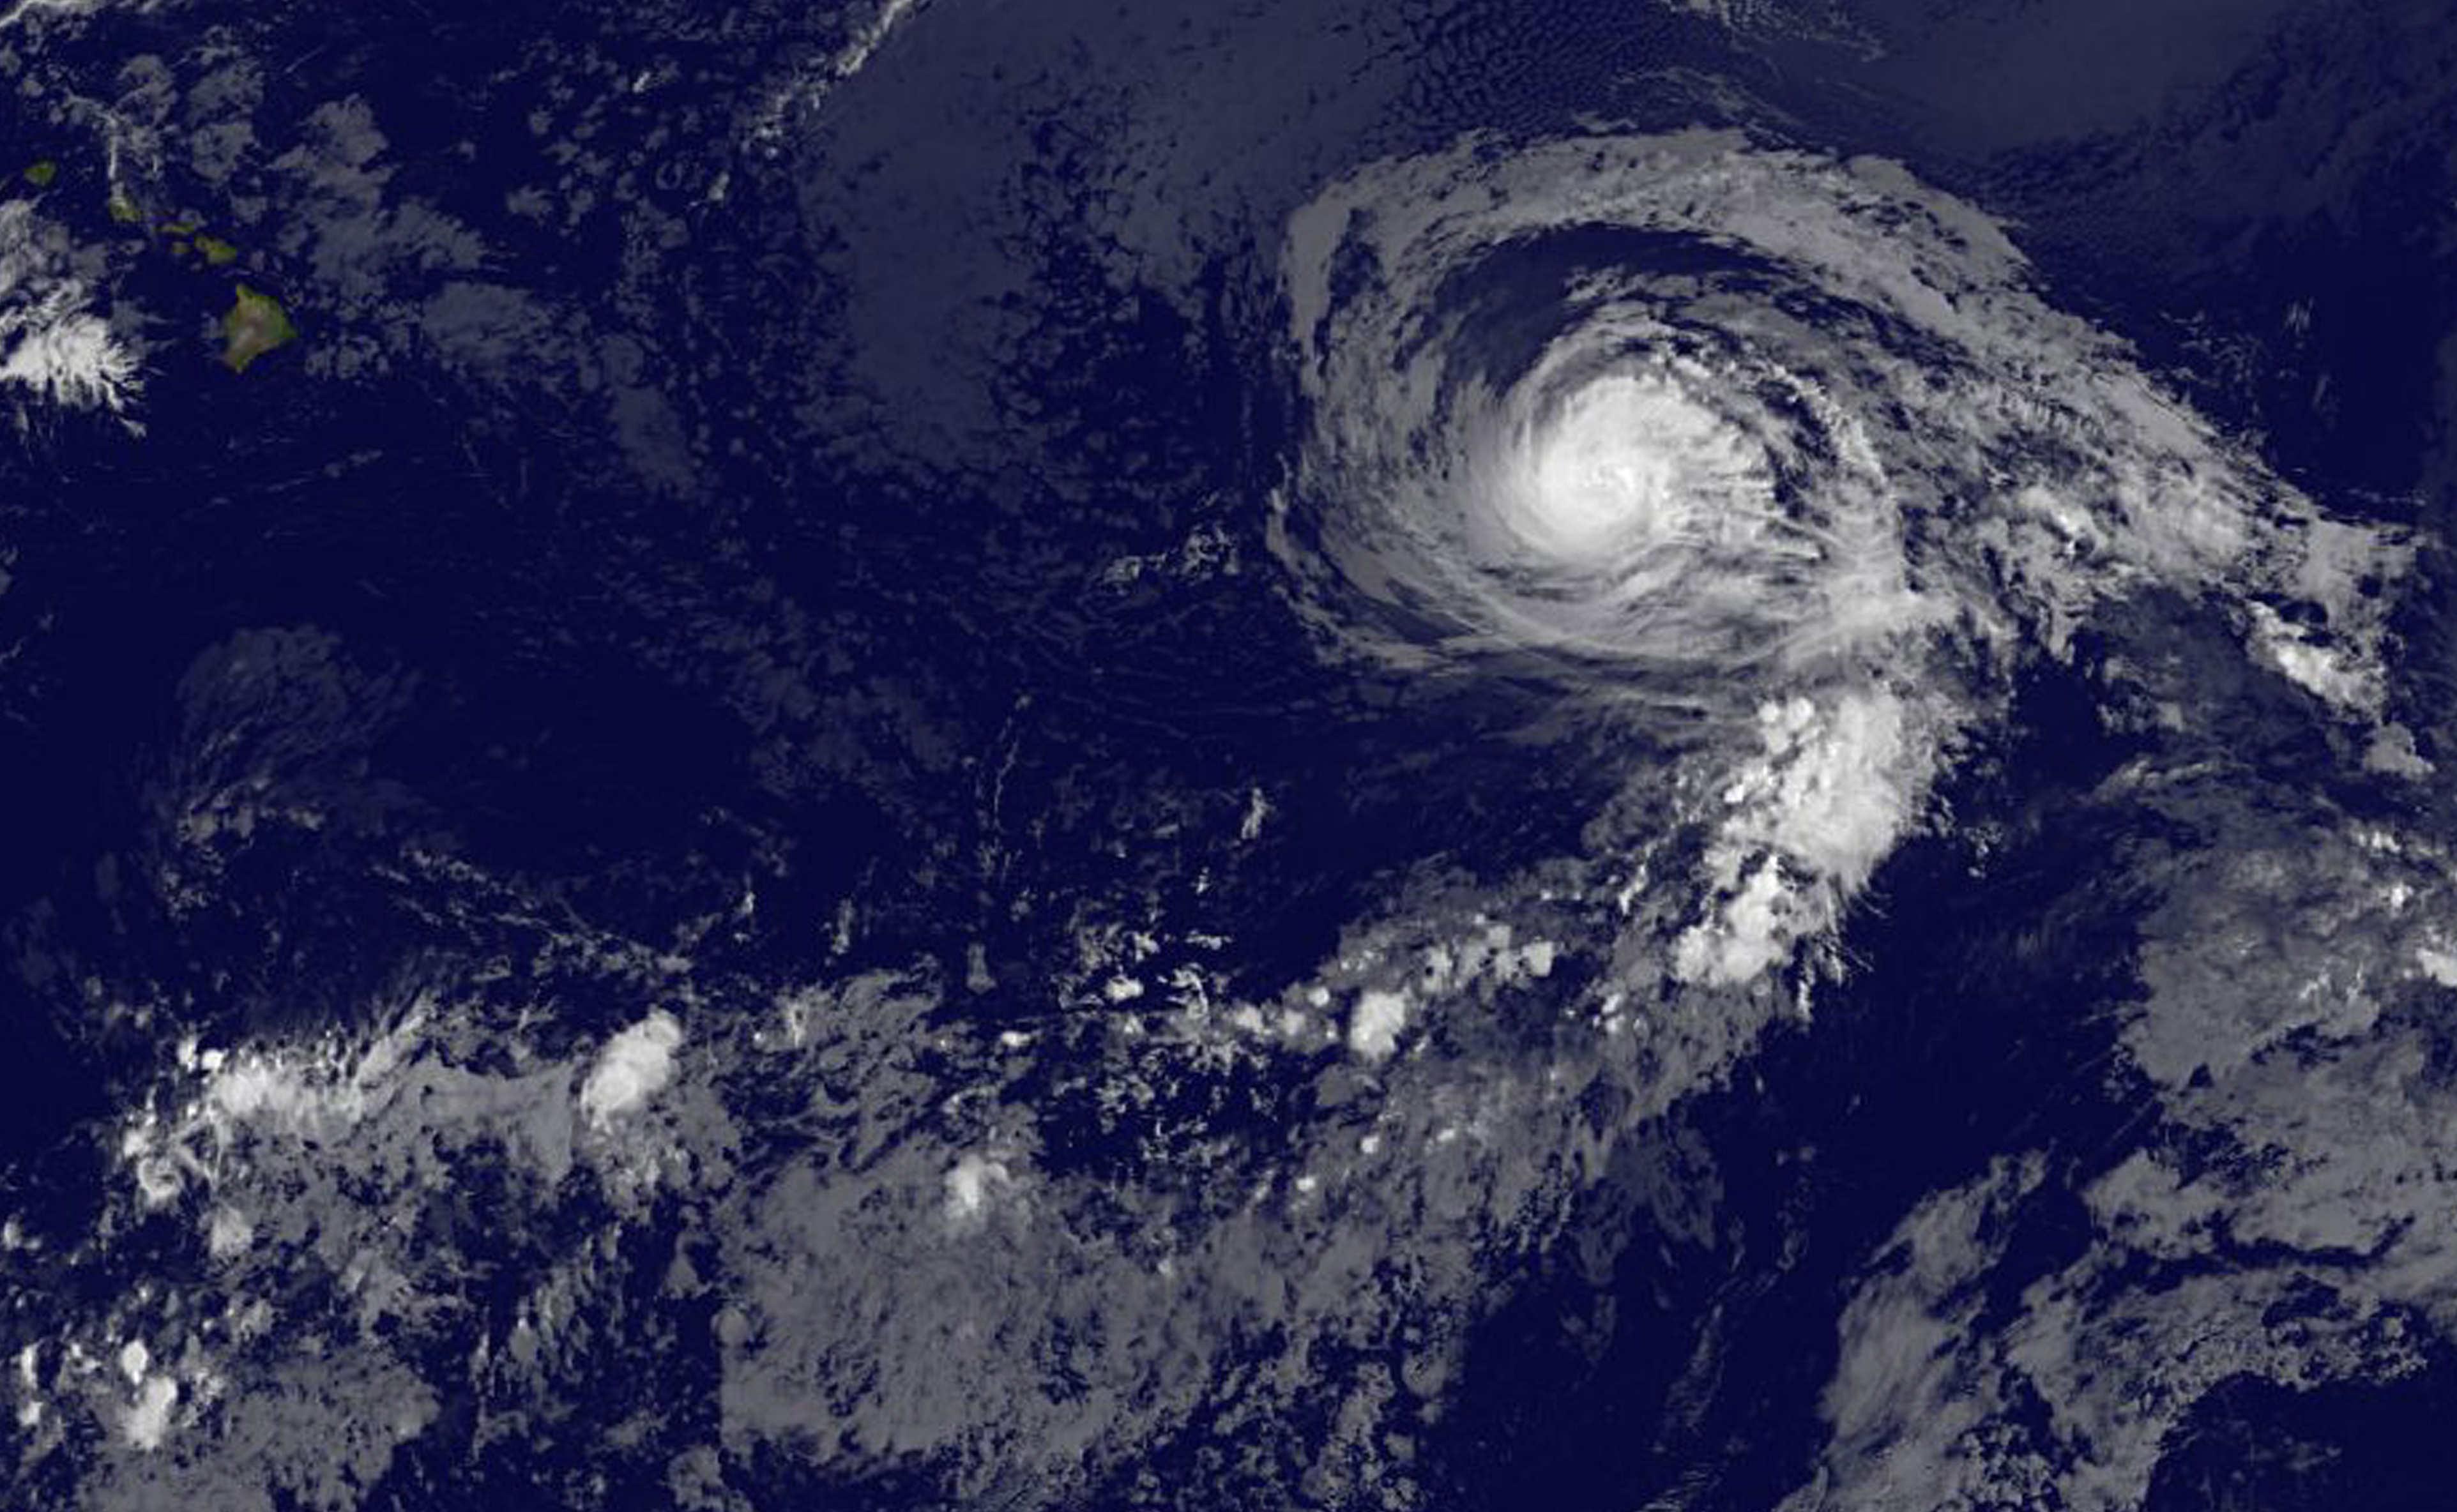
In the image, created by the NASA/NOAA GOES Project at NASA’s Goddard Space Flight Center in Greenbelt, Maryland, an area of strong thunderstorms still surrounded the center of circulation, but no eye was visible.
The National Hurricane Center (NHC) noted at 5 a.m. EDT (0900 UTC), the center of Hurricane Fernanda was located near 17.0 degrees north latitude and 135.0 degrees west longitude. That’s about 1,330 miles (2,140 km) east of Hilo, Hawaii. The hurricane was moving toward the northwest near 9 mph (15 kph). NHC said the hurricane is expected to turn toward the west-northwest later today at about the same rate of speed, and this general motion should continue through Thursday.
Maximum sustained winds have decreased to near 90 mph (150 kph) with higher gusts. Continued weakening is forecast during the next couple of days as it moves into cooler waters. Fernanda is expected to become a tropical storm by Thursday.
For updated forecasts, visit: www.nhc.noaa.gov
By Rob Gutro
NASA’s Goddard Space Flight Center, Greenbelt, Md.
July 18- NASA Keeps Tracking a Weaker Hurricane Fernanda
NASA’s Aqua satellite passed over the Eastern Pacific Ocean’s Hurricane Fernanda as it continued to track toward the Central Pacific. The storm continues to move over cooler waters and is on a weakening trend.
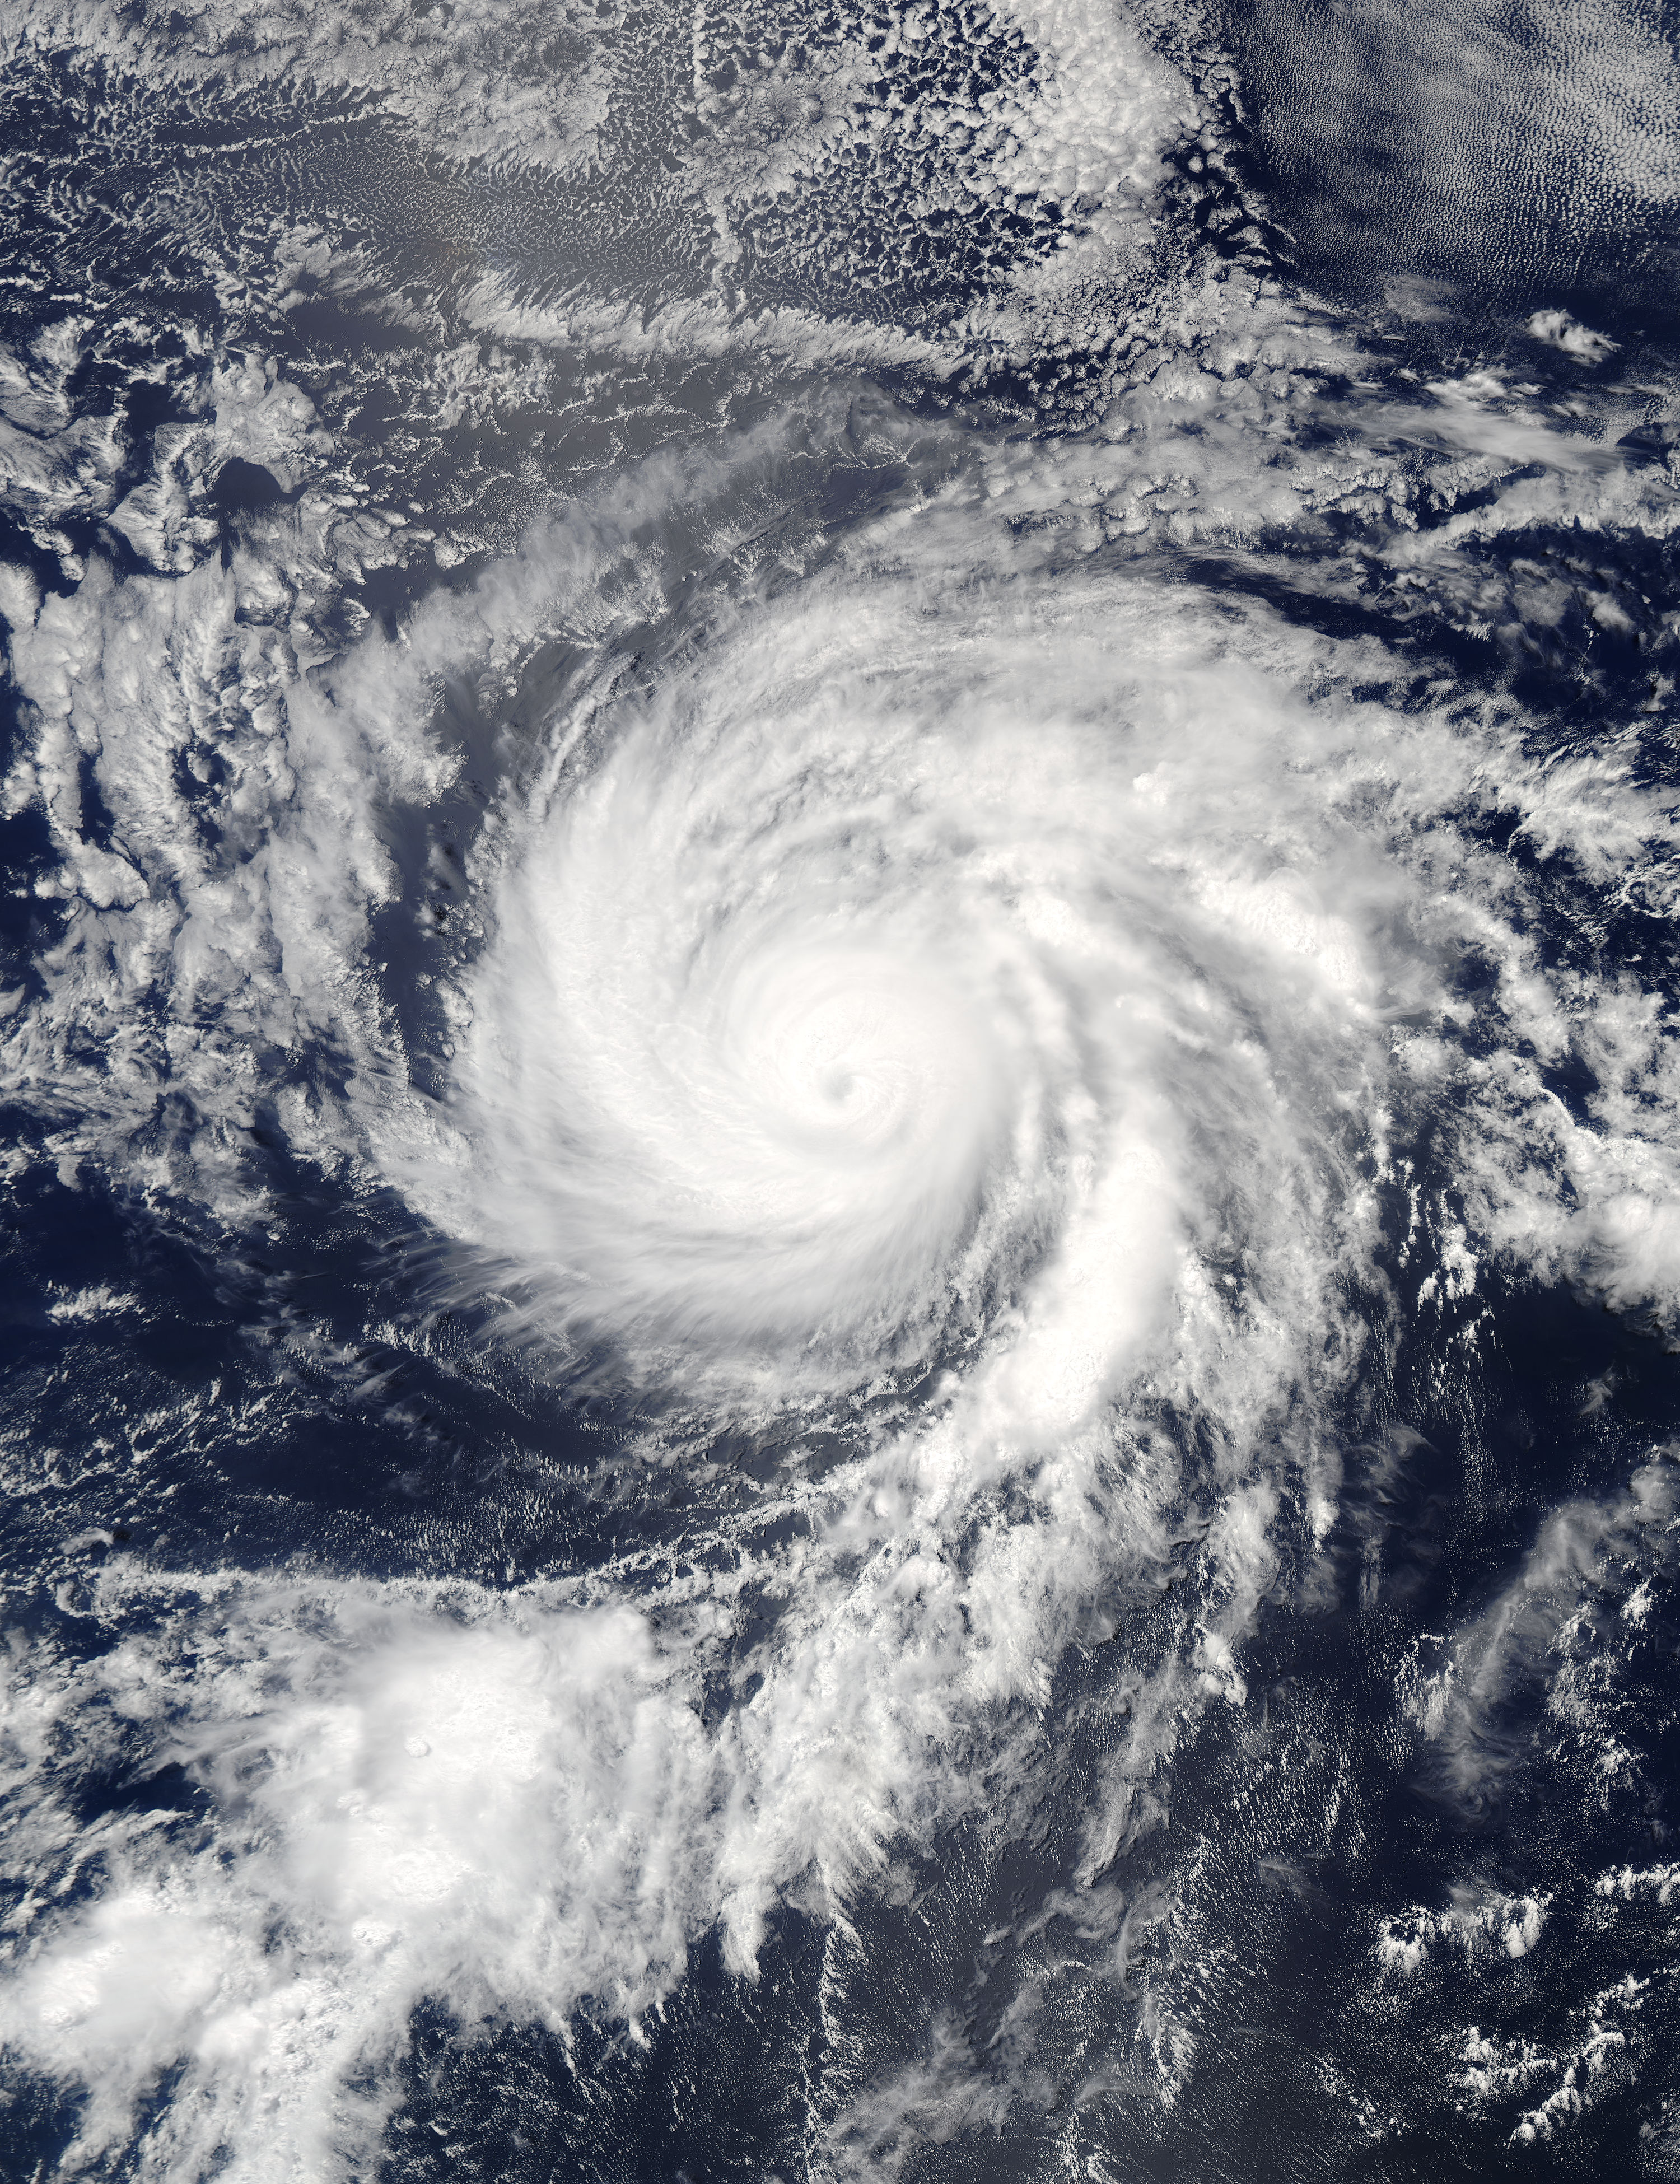
On July 17 at 6:10 p.m. EDT (2210 UTC) the Moderate Resolution Imaging Spectroradiometer or MODIS instrument aboard NASA’s Aqua satellite provided a visible picture of Fernanda. The image revealed strong thunderstorms continued to circle the low-level center of circulation, and the eye of the storm had become filled in from clouds.
At 5 a.m. EDT (0900 UTC), the center of Hurricane Fernanda was located near 15.4 degrees north latitude and 132.8 degrees west longitude. That’s about 1,495 miles (2,410 km) east of Hilo, Hawaii. Fernanda was moving toward the northwest near 9 mph (15 kph) and this general motion is expected during the next day or so. A turn to the west-northwest is expected on Wednesday. The estimated minimum central pressure is 971 millibars.
Maximum sustained winds are near 105 mph (165 kph) with higher gusts. Continued gradual weakening is forecast during the next couple of days.
For updated forecasts, visit: www.nhc.noaa.gov
By Rob Gutro
NASA’s Goddard Space Flight Center, Greenbelt, Md.
July 17 – NASA Sees Hurricane Fernanda’s Eye Blink
Satellite imagery taken over the life-time of Hurricane Fernanda has shown that the powerful hurricane has blinked. That is, the eye has become cloud-filled and cleared out, then filled with clouds again.
The Visible Infrared Imaging Radiometer Suite (VIIRS) instrument aboard the NASA-NOAA Suomi NPP satellite captured a visible light image Fernanda on July 16 at 5:24 p.m. EDT (2124 UTC) that showed the storm’s eye was cloud-filled.
By July 17 at 11 a.m. EDT (1500 UTC) Fernanda’s 15 nautical mile-wide eye had once again become clear in the shortwave infrared imagery. The imagery revealed that there was a slightly asymmetric ring of very cold cloud tops surrounding the eye.
At that time, the eye of Hurricane Fernanda was located near 13.7 degrees north latitude and 130.9 degrees west longitude. That’s about 1,515 miles (2,435 km) west-southwest of the southern tip of Baja California, Mexico, and 1,650 miles (2,660 km) east of Hilo, Hawaii.
Fernanda was moving toward the west-northwest near 10 mph (17 kph). The National Hurricane Center forecast calls for the hurricane to move toward the west-northwest or northwest at about the same rate of speed for the next two days. The estimated minimum central pressure is 954 millibars. Maximum sustained winds are near 125 mph (205 kph) with higher gusts. Fernanda is a category 3 hurricane on the Saffir-Simpson Hurricane Wind Scale. Steady weakening is forecast during the next 48 hours.
National Hurricane Center forecaster Chris Landsea noted in the 11 a.m. EDT discussion that in the short term, sea-surface temperatures beneath Fernanda will gradually cool beneath the threshold of 26.6 degree Celsius (80 degree Fahrenheit) needed to maintain a tropical cyclone’s strength. In addition, in four or five days, vertical wind shear is expected to increase and by that time the system is expected to become a remnant low-pressure area.
For updated forecasts, visit: www.nhc.noaa.gov.
By Rob Gutro
NASA’s Goddard Space Flight Center, Greenbelt, Md.
July 14, 2017 – NASA Gives Hurricane Fernanda a Close-Up
Hurricane Fernanda is moving through the deep tropics and there’s nothing in its way to prevent it from becoming a major hurricane. NASA’s Terra satellite took a closer look at the strengthening storm.
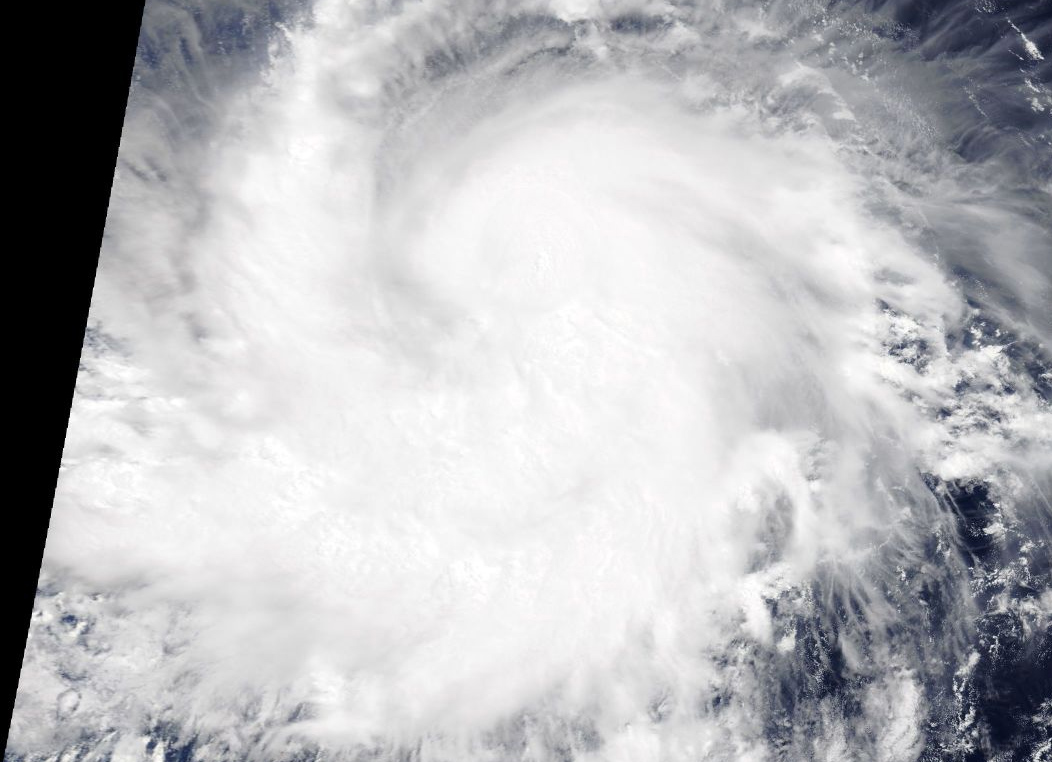
On July 13 at 1:30 p.m. EDT, the Moderate Resolution Imaging Spectroradiometer or MODIS instrument aboard NASA’s Terra satellite captured a close-up visible-light image of Hurricane Fernanda as it continued moving west through the Eastern Pacific Ocean. The visible MODIS image showed a concentration of strong thunderstorms wrapped around the low-level center and a large, thick band of thunderstorms spiraling into the center from the west. Although the image did not reveal an eye, a ragged eye formed later in the day and was seen in satellite imagery using infrared light.
By July 14 at 5 a.m. EDT (0900 UTC), the center of Hurricane Fernanda was located near 11.0 degrees north latitude and 117.9 degrees west longitude. That’s about 975 miles (1,570 km) southwest of the southern tip of Baja California, Mexico. Fernanda’s maximum sustained winds had increased to 100 mph (155 kph). Fernanda was moving toward the west near 12 mph (19 kph) and this motion is expected to continue over the next couple of days.
The National Hurricane Center said that some additional strengthening is anticipated during the next 48 hours, and Fernanda is likely to become a major hurricane later today.
For updated forecasts, visit: www.nhc.noaa.gov.
By Rob Gutro
NASA’s Goddard Space Flight Center, Greenbelt, Md.
July 13, 2017 – Satellite Sees Tropical Storm Fernanda Heading West
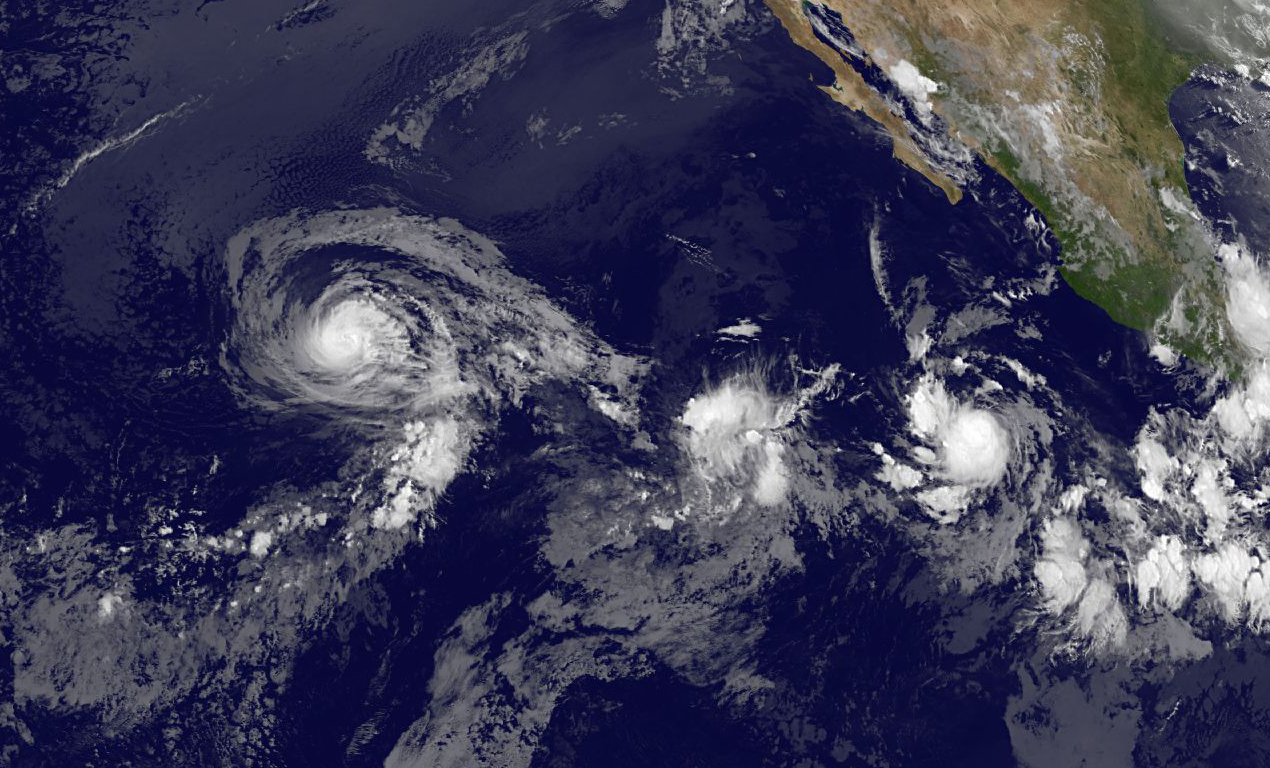
Tropical Storm Fernanda continues to strengthen as it moves west through the Eastern Pacific Ocean. NOAA’s GOES-West satellite provided an infrared image of the storm on July 13 as it was nearing hurricane strength.
NOAA’s GOES-West satellite captured an infrared image of Tropical Storm Fernanda on July 13 at 8 a.m. EDT (1200 UTC) as it continued moving west in the Eastern Pacific Ocean. The image was created by the NASA/NOAA GOES Project at NASA’s Goddard Space Flight Center in Greenbelt, Maryland.
The National Hurricane Center (NHC) noted in its 11 a.m. EDT discussion that the recent infrared and visible satellite images show that Fernanda has begun to establish good outflow in all quadrants, indicating that the vertical wind shear that previously affected the tropical storm is diminishing. In addition, imagery also shows that thunderstorms are wrapping all the way around a mid-level center. However, NHC noted, the low-level center remains displaced a little to the north-northeast.
At 11 a.m. EDT (1500 UTC), the center of Tropical Storm Fernanda was located near 11.7 degrees north latitude and 115.0 degrees west longitude, about 845 miles (1,355 km) south-southwest of the southern tip of Baja California, Mexico. NHC said Fernanda is moving toward the west near 12 mph (19 kph) and this motion is expected to continue for the next couple of days. Maximum sustained winds are near 65 mph (100 kph) with higher gusts. Significant strengthening is forecast over the next 48 hours, and Fernanda is expected to become a hurricane later today and to be near major hurricane strength by tomorrow evening.
For updated forecasts, visit: www.nhc.noaa.gov.
By Rob Gutro
NASA’s Goddard Space Flight Center, Greenbelt, Md.
July 12, 2017 – NASA Sees Formation of Tropical Storm Fernanda in Eastern Pacific Ocean
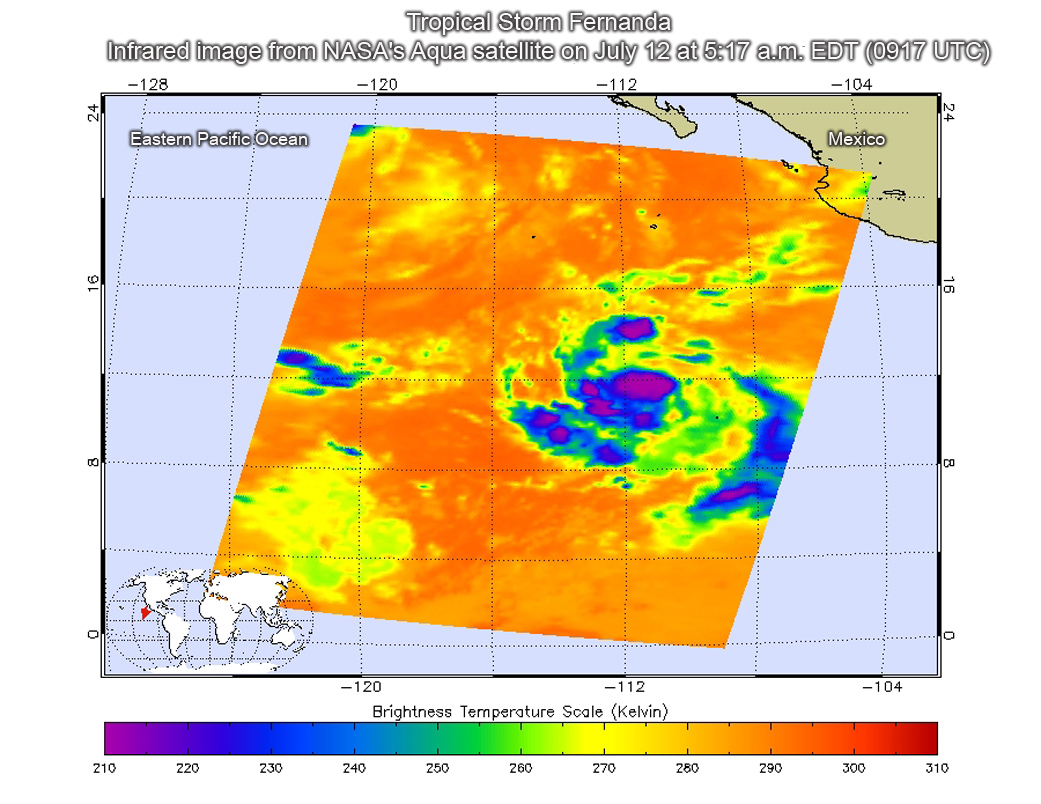
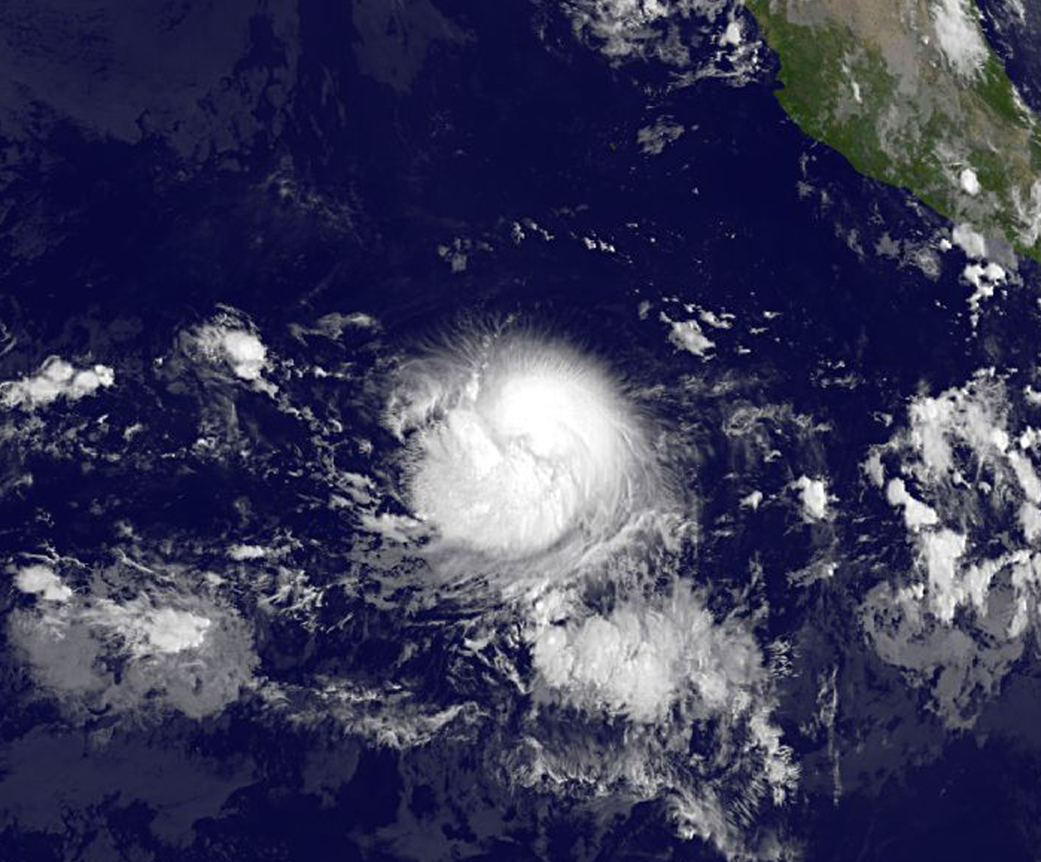
The sixth tropical depression of the Eastern Pacific Ocean hurricane season formed near southwestern Mexico and quickly strengthened into Tropical Storm Fernanda. NASA’s Aqua satellite provided infrared imagery of the strengthening storm.
Tropical Depression 6E formed on July 11 at 11 p.m. EDT (July 12 at 0300 UTC) about 740 miles (1,190 km) south of the southern tip of Baja California, Mexico.
Infrared satellite imagery from the Atmospheric Infrared Sounder or AIRS instrument that flies aboard NASA’s Aqua satellite taken on July 12 at 5:17 a.m. EDT (0917 UTC) provided a look at the temperatures of Tropical Depression 6E’s clouds. That data was false colored and made into an image at NASA’s Jet Propulsion Laboratory in Pasadena, California to highlight cloud top temperatures. In infrared imagery, the coldest cloud tops indicate towering thunderstorms high into the troposphere. The colder the clouds, the stronger the storms. AIRS data showed that some cloud tops around the center of circulation were as cold as minus 63 degrees Fahrenheit or minus 53 degrees Celsius. Cloud top temperatures that cold have been shown to generate heavy rainfall.
Less than six hours later, by 11 a.m. EDT (1500 UTC) on July 12, the National Hurricane Center (NHC) in Miami noted the depression strengthened into a tropical storm. At that time, the center of Tropical Storm Fernanda was located near 12.0 degrees north latitude and 111.5 degrees west longitude. That’s about 760 miles (1,225 km) south of the southern tip of Baja California, Mexico.
Fernanda was moving toward the west near 10 mph (17 kph) and the NHC expects this motion to continue with some increase in forward speed during the next couple of days. Maximum sustained winds have increased near 40 mph (65 kph) with higher gusts. Additional strengthening is expected during the next 48 hours.
Because Tropical Storm Fernanda is far from land, there are no coastal watches or warnings in effect.
For updated forecasts, visit the NHC website at: www.nhc.noaa.gov.
By Rob Gutro
NASA’s Goddard Space Flight Center, Greenbelt, Md.