


Not all raindrops are created equal. The size of falling raindrops depends on several factors, including where the cloud producing the drops is located on the globe and where the drops originate in the cloud. For the first time, scientists have three-dimensional snapshots of raindrops and snowflakes around the world from space, thanks to the joint NASA and Japan Aerospace Exploration Agency Global Precipitation Measurement (GPM) mission. With the new global data on raindrop and snowflake sizes this mission provides, scientists can improve rainfall estimates from satellite data and in numerical weather forecast models, helping us better understand and prepare for extreme weather events.
This video and related visualizations are public domain and can be downloaded at the Scientific Visualization Studio
“The drop size distribution is one of many factors that determines how big a storm will grow, how long it will last and how much rain it will ultimately produce,” said Joe Munchak, research meteorologist at NASA’s Goddard Space Flight Center in Greenbelt, Maryland. “We’ve never been able to see how water droplet sizes vary globally until now.”
Storm clouds contain a wide variety of drop sizes that ultimately fall as rain or snow. In general, in the cores of clouds the drops tend to be bigger because they collide with each other and aggregate as they fall towards the Earth’s surface, while smaller droplets occur at the edges and higher altitudes. Drops tend to be small when they miss colliding into others or break apart. Scientists refer to the number of drops and snowflakes of different sizes at various locations within a cloud as the “particle size distribution.”
In order to accurately know how much precipitation is falling in a storm, scientists need to understand the ratio of large drops to smaller or medium sized drops. Previously, researchers had to make assumptions of the ratio because earlier studies were conducted in isolated locations and global data were limited, said Munchak.
“Without knowing the relationship or the ratio of those large drops to the smaller or medium sized drops, we can have a big error in how much rain we know fell and that can have some big implications for knowing long term accumulations which can help with flash flood predictions,” said Munchak.
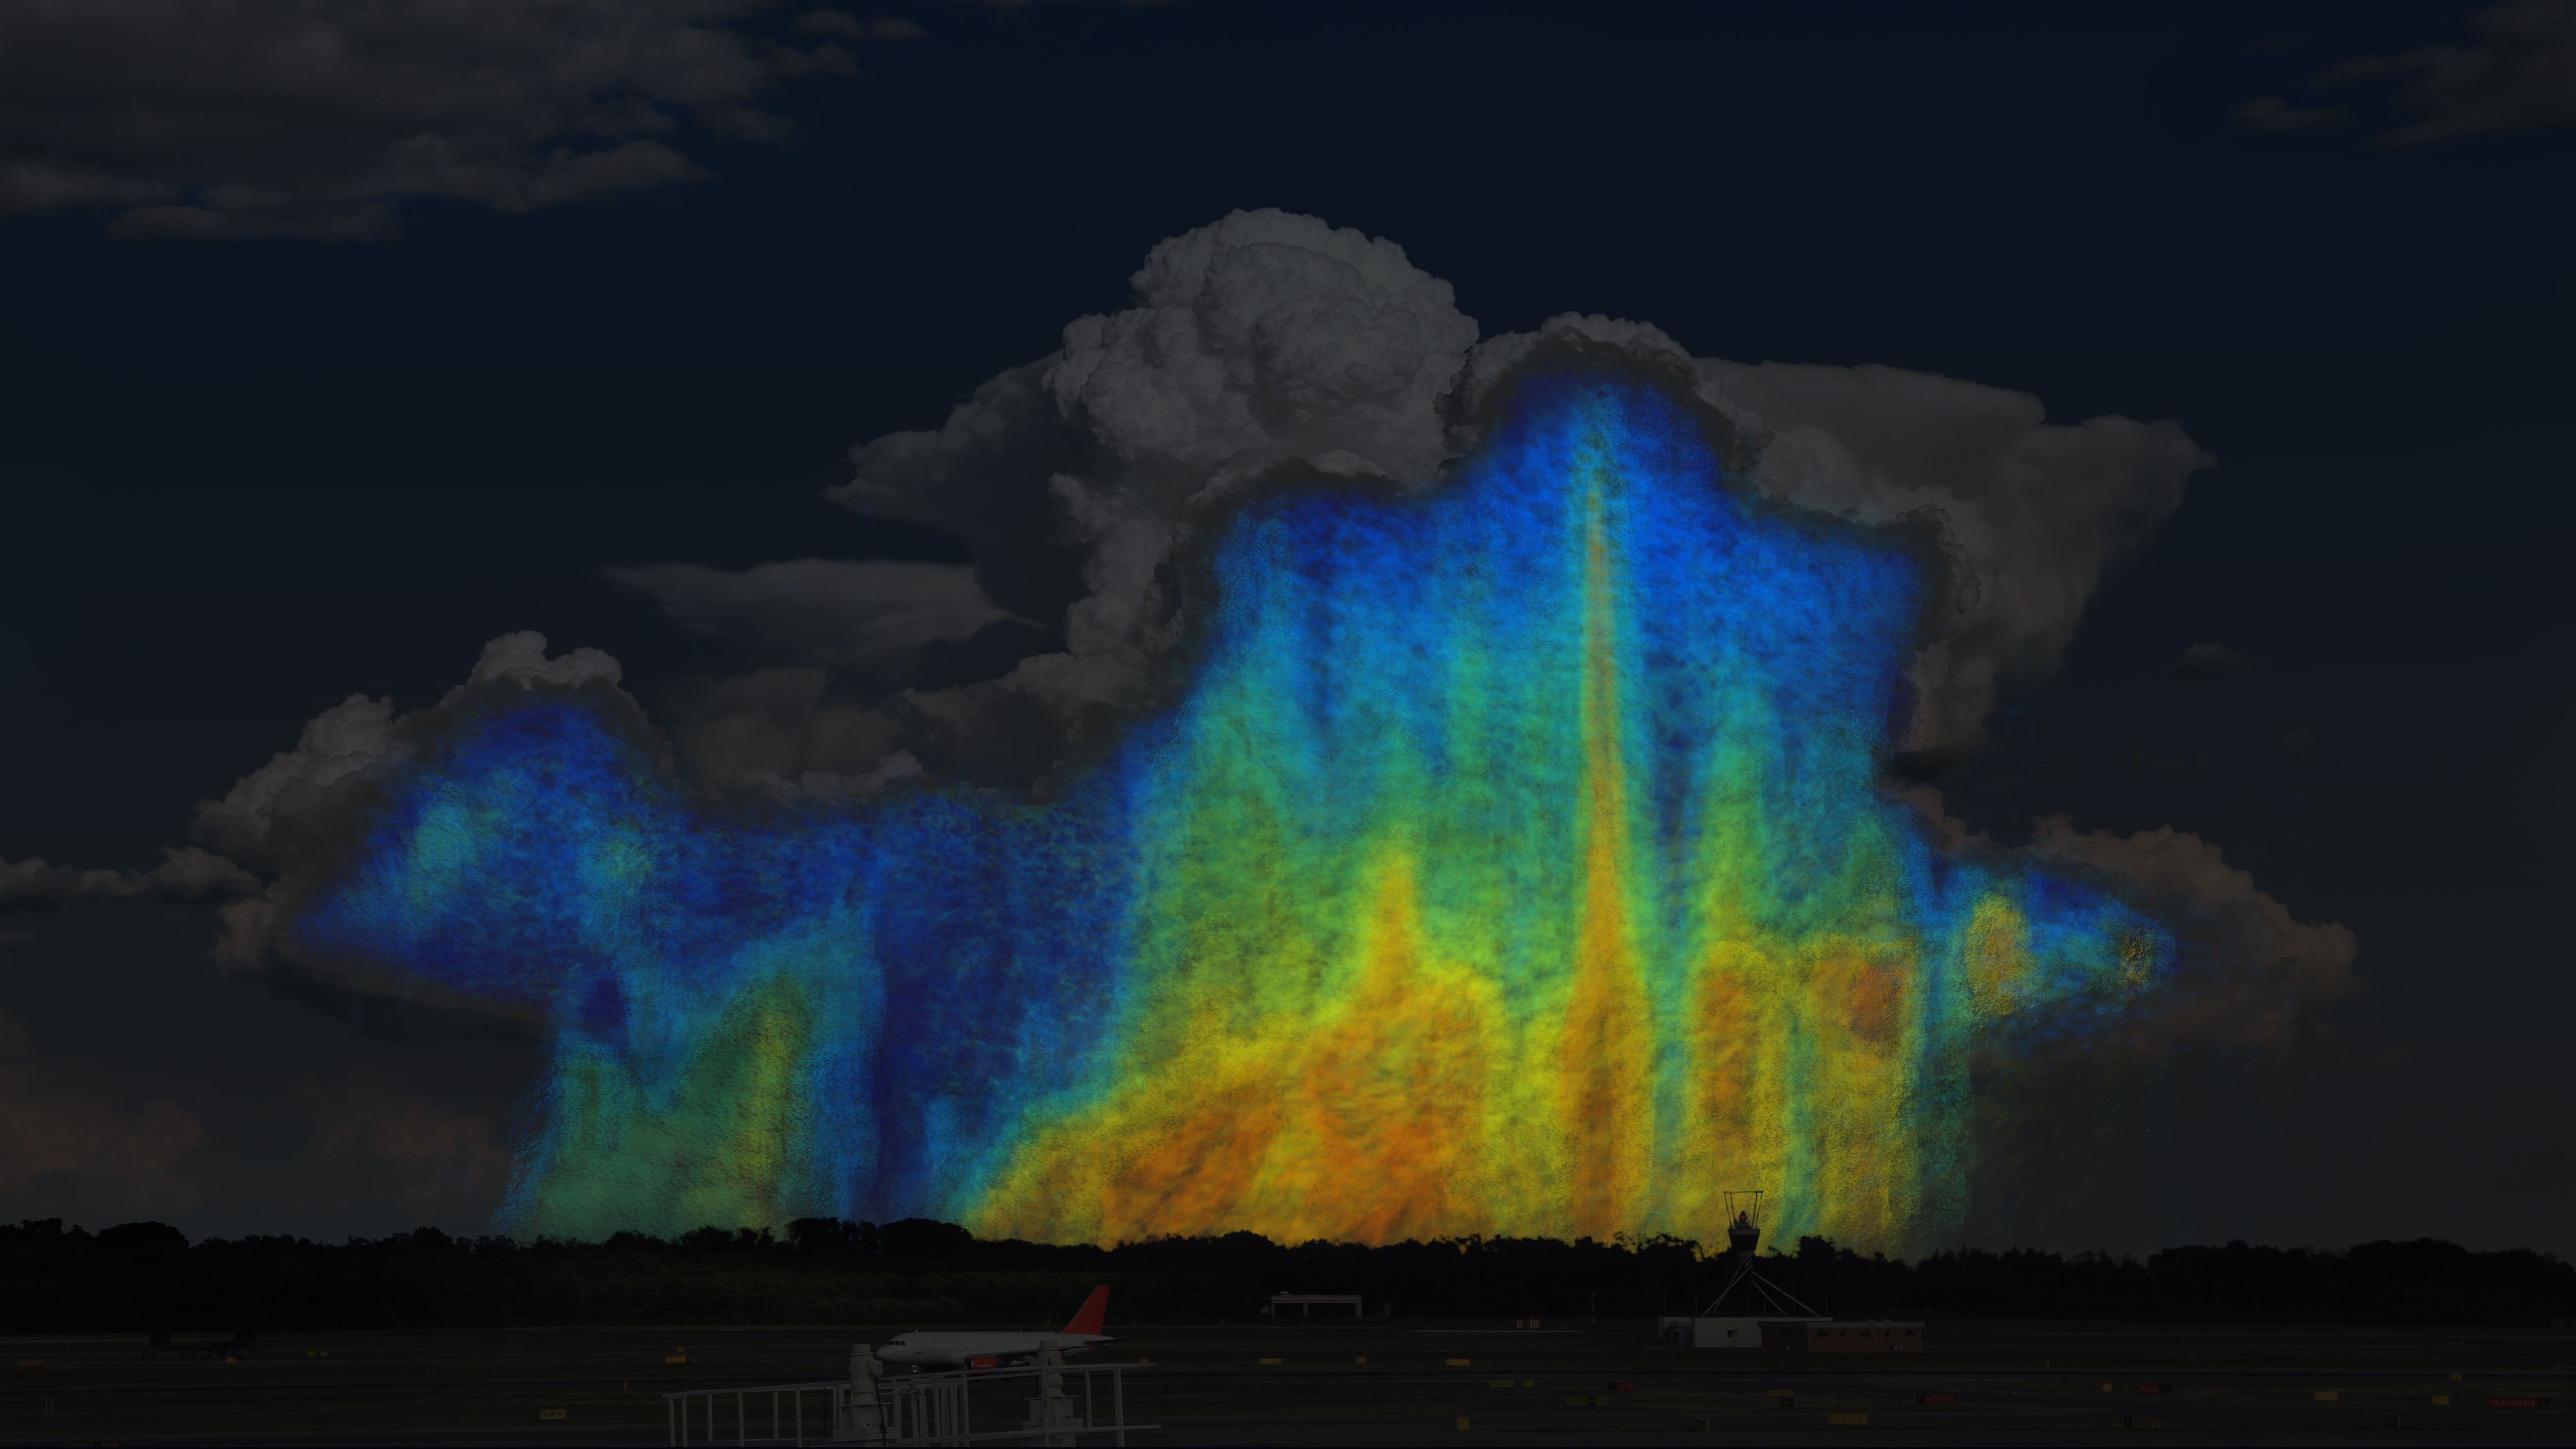
With GPM’s three-dimensional snapshots of drop size distribution, scientists can also gain insight into the structure of a storm and how it will behave. Drop size distribution influences storm growth by changing the rate of evaporation of rain as it falls through dry air, said Munchak. Smaller drops, for instance, will tend to evaporate faster and subsequently cool the air more. This leads to stronger flow of downward moving air that can cause damaging winds when they reach the ground. However, these same downdrafts can interfere with the upward flowing air that fuels the storm and cause the storm to weaken or dissipate.
“GPM measurements will really help predict these complex interactions that depend in part of the drop size distribution,” said Munchak.
GPM was launched in 2014 and carries the first Dual-frequency Precipitation Radar (DPR) to fly in space, as well as a multi-channel GPM Microwave Imager (GMI). The DPR makes detailed 3D measurements of rainfall, while the GMI uses a set of 13 optimized frequencies to retrieve heavy, moderate, and light precipitation measurements at the Earth’s surface. As GPM improves our understanding of precipitation from space, that information will be vital in improving weather models and forecasts.
For more information on GPM, visit: www.nasa.gov/GPM