


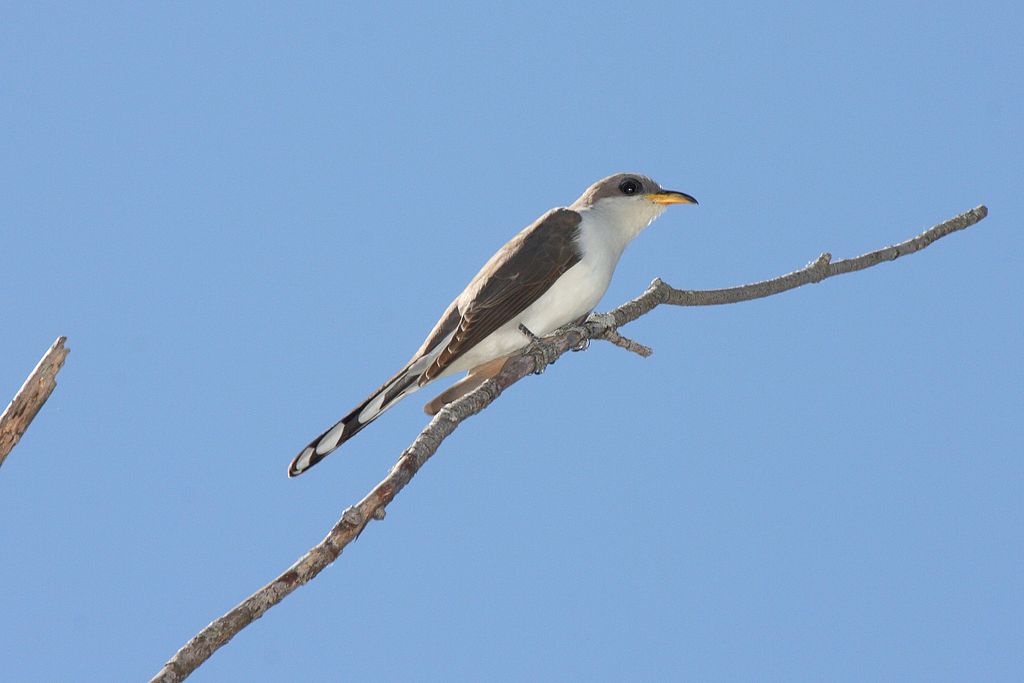
The Yellow-billed Cuckoo has soft brown wings, a white belly, a long tail with black and white spots, and is running out of places to live. The cuckoo’s population in its native breeding range in the eastern United States has declined in recent decades due to urbanization, heat waves and other factors. Climate change will likely further reduce its suitable habitat.
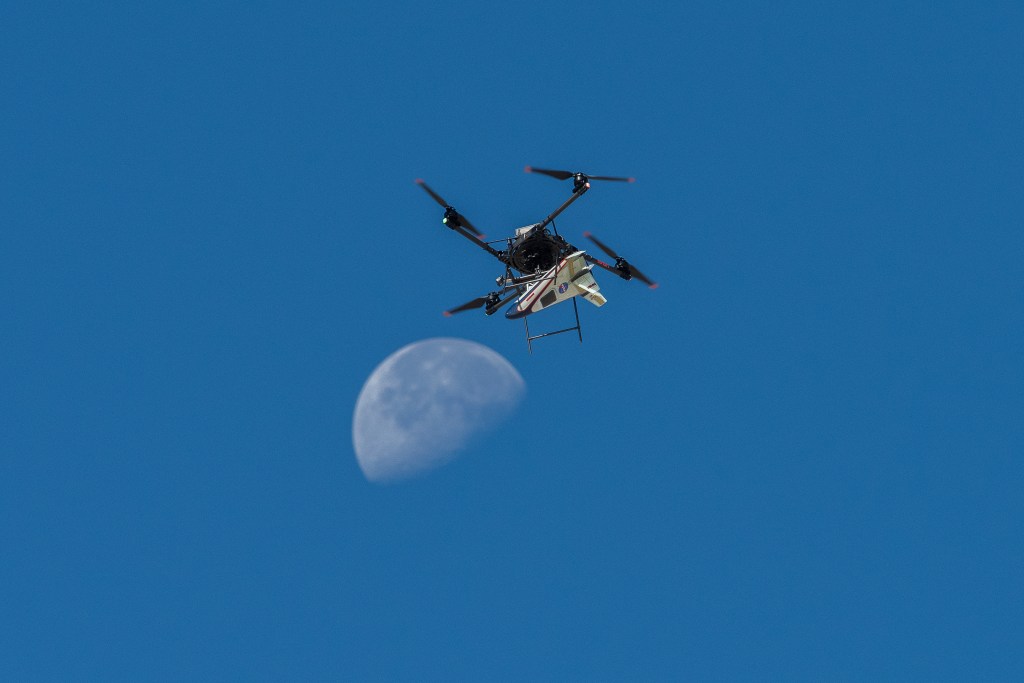
Although the cuckoo is only one species in a vast world of flora and fauna, its story is not unique. To study and monitor changes in Earth’s biodiversity, or the immense volume of organisms in the world, scientists and citizen scientists record their sightings in the field. At the same time, sensors on the ground and on board satellites and aircraft monitor flora and fauna on a regional to global scale.
NASA has funded four projects to create new, virtual portals that bring into focus this wealth of biodiversity information to help inform scientists, land managers and decision makers around the world regarding the status and health of terrestrial ecosystems.
Each of these projects highlights a different aspect of biodiversity and lets users create easy-to-use maps and other information products to track healthy and vulnerable species as they compete for resources, migrate to safer habitats and adapt to climate change.
“Healthy ecosystems and rich biodiversity are fundamental to life on Earth,” said Laura Rogers, a project manager overseeing these efforts at NASA’s Langley Research Center in Hampton, Virginia. “These projects provide critical information to conservationists and policymakers to protect our planet,” Rogers said.
Where are the plants and animals?
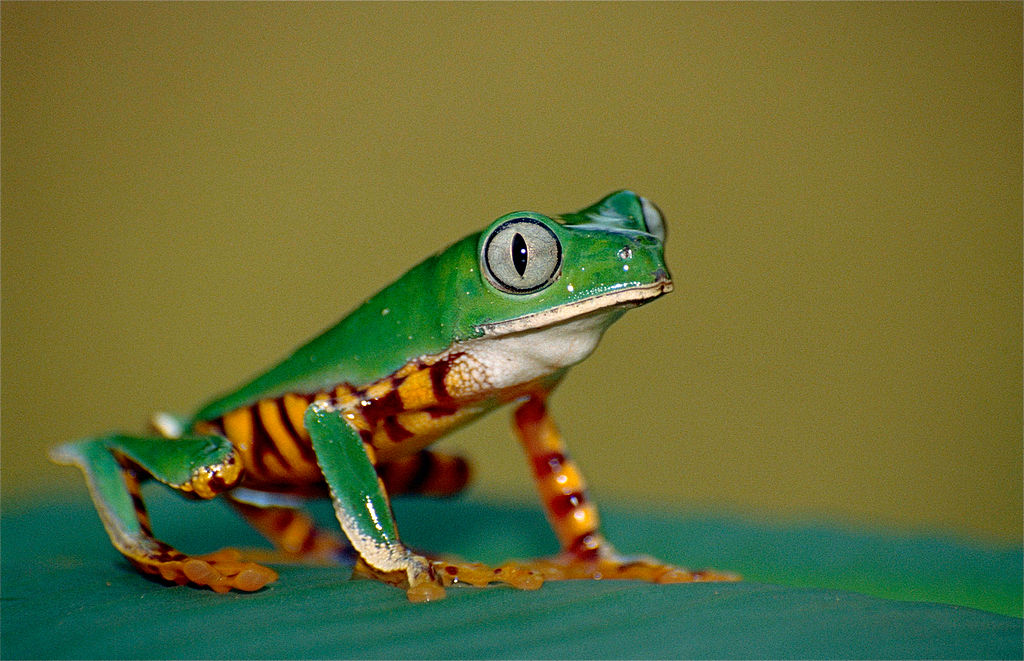
If you’ve ever spotted a bright green frog with tiger stripes and wondered, what is that and how can I find more of them, you’re in luck. Tiger-striped leaf frogs are one of many species included in the Map of Life, an interactive virtual database that tracks mammals, birds, reptiles, amphibians, and some fish, insect and plant species around the world. The database can also forecast where species will live in the future and help you determine if their habitats will be protected by laws and regulations.
“As the world around us changes rapidly, society, policymakers, businesses and individuals need to make decisions about how we engage with the environment,” said Walter Jetz, a professor at Yale University leading the Map of Life effort. “The data is rapidly increasing,” Jetz said.
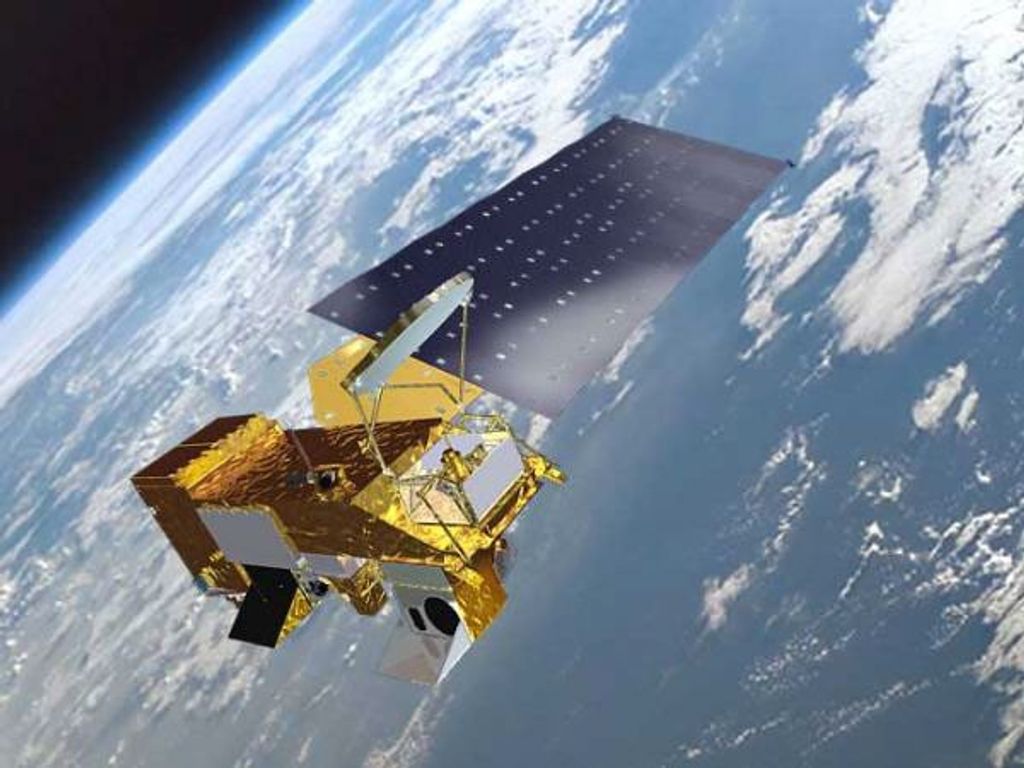
The Map of Life tool integrates satellite images, museum records, modeling outputs and ground- and water-based information from citizen scientists. For example, the Map of Life gathers information from NASA’s satellites, like Landsat, which is jointly run with the U.S. Geological Survey, and instruments like the Moderate Resolution Imaging Spectroradiometer (MODIS) aboard the Terra and Aqua satellites. “These satellites are offering global data that we can use and put together with raw data about species occurrences,” Jetz said.
The tool aims to help government and nongovernment agencies make informed decisions as they work to conserve and protect our planet’s most vulnerable species. Jennifer McGowan, the Spatial Planning Technical Coordinator for The Nature Conservancy, is responsible for helping her organization prioritize conservation actions. “The Map of Life project provides species-level information,” McGowan said, which is useful for prioritizing which conservation actions to take to protect specific species.
“The Map of Life’s species range maps, in particular, are invaluable” to help efforts that balance conservation opportunities across land and ocean habitats in cost-efficient and pragmatic ways, McGowan said.
The team also created a mobile app of Map of Life that lets the user explore their surroundings and record their own sightings. It contains information on over 30,000 species around the world. If someone in Houston, Texas wanted to discover local dragonflies, for example, they would open the app, search their location and see a photo and description of Powdered Dancers, or Argia moesta, marble sized insects with long, translucent wings.
Both the app and online portal reveal how land use changes, like growing food, cutting trees and building cities, are the primary drivers to shaping biodiversity, Jetz said. If there’s a change in the environment, like a new building over a wetland, there will likely be an impact to biodiversity, like a decrease in dragonflies in a particular area.
How are communities of species impacted by climate change?
Researchers at Duke University in Durham, North Carolina, are also creating a tool to help identify biodiversity changes in North America. In particular, the team, led by Jennifer Swenson and Jim Clark, both professors at Duke, want to know how one species could impact another as it relocates and competes for suitable habitats in a warming world. The team created an interactive web portal that pulls together satellite, airborne and ground-based information, as well as climate projections and ecological forecasts, to track how climate change will impact species and wildlife communities.
For instance, the Predicting Biodiversity with a Generalized Joint Attribution Model, or PBGJAM, used information gathered by the National Ecological Observatory Network (NEON) and NASA’s remotely sensed Earth data and climate data, among other sources, to reveal where pileated woodpeckers, desert pocket mice and white fir trees, among many species, could migrate under future climate scenarios.
“We need to consider who’s living with whom in order to understand larger impacts,” said Swenson. For instance, if the desert pocket mice don’t survive a drought, will their predators find other sources of food, change locations or also perish?
The PBGJAM portal aims to explore how a biodiverse community responds to climate change as a whole to more accurately predict the impact on both the individual species and the entire ecosystem.
To tackle this, the PBGJAM team built on its powerful Generalized Joint Attribution Model, or the latter part of the acronym, which can pull in different kinds of data for multiple species. For instance, the desert pocket mouse and other mice species are currently concentrated in the southwestern region of the U.S. As they start losing viable habitats with climate change and development, they’ll be forced to move north or east, all the while competing with each other for resources and scurrying from new and old predators.
The model considers how many species live in a specific region and how many suitable habitats exist for specific species. The model can also predict how all this could change in the future and how one species’ movements could affect another’s as communities shift.
PBGJAM provides a web interface that lowers the barrier of entry for decisionmakers, scientists and any interested individual to get involved. They only need to choose an ecosystem type and then see how it’s shifted, said Adam Wilson, a professor at the University at Buffalo.
When will things bloom?
While PBGJAM takes a broad approach to studying climate change impacts on communities of species, the Advanced Phenological Information System (APIS) focuses on the seasonal dynamics of plant species. More specifically, APIS provides a framework to explore how climate change and other factors can impact phenology, or the study of seasonal life-cycle events such as leafing, flowering, reproduction and migration.
APIS includes a constellation of software that relies on millions of field-based observations, near surface cameras and satellite data to explore and synthesize phenology observations from different times and on various spatial scales. The effort was co-led by Jeff Morisette, Chief Scientist for the National Invasive Species Council and Tom Maiersperger, Project Scientist for the Land Processes Distributed Active Archive Center. The center is part of NASA’s Earth Observing System Data and Information System and is located at the U.S. Geological Survey’s Earth Resources Observation and Science Center in Sioux Falls, South Dakota.
APIS includes information from MODIS, PhenoCam (a digital camera set up at fixed locations to capture time-lapse images and led by researchers at Northern Arizona University), the USA National Phenology Network (USA-NPN), and NEON. The project also includes Conservation Science Partners who led the development of software to develop near-term phenological forecasts.
“When you see a lilac tree blooming, you can say, that’s spring for that one lilac tree,” Morisette said. But what does that mean for the start of the season, as detected by a satellite observation?
“APIS provides more comprehensive information over a wider area, across several monitoring networks, and at a range of scales,” Morisette said. “In the context of invasive plants and animals, it is important to understand how species compete with each other and how broader ecosystem dynamics and climate are impacting those species,” Morisette said. “If you only observe at limited temporal and spatial scales, you’re likely to miss something,” he said
“Our goal for APIS was to develop technology to make data more accessible and easier to integrate with the data from other observational sources,” Kathy Gerst, a scientist with the USA-NPN, said. Gerst worked with Morisette and others to create APIS. “APIS allows people to bring data together seamlessly,” Gerst said.
Ecologists, natural resource managers and climatologists can use APIS to look at the relationship between phenology and climate to see how threatened, endangered and invasive species respond to temperature and rainfall changes, Gerst said.
APIS can also help researchers create maps to determine if spring is early in a particular year and study the long-term patterns to see how trends change over time. For example, Gerst and others published a paper that ties spring indices, or models that show the onset of spring, to actual phenological activity, like flowering, in 19 species of trees and shrubs.
Other groups using APIS include the U.S. Geological Survey’s Southwest and North Central Climate Adaptation Science Centers. Both centers are examining phenology ties to drought. The U.S. National Park Service is using APIS to better understand vegetation and soils in its Inventory and Monitoring Division, and the Denver Zoo and Ikh Nart Nature Reserve in Mongolia are using APIS to inform their rangeland management strategy.
What are plants’ colors telling us?
To help supply APIS, PBGJAM and the Map of Life with robust plant data, a team led by Phil Townsend created the Ecological Spectral Information System (EcoSIS). Townsend is a professor at the University of Wisconsin-Madison.
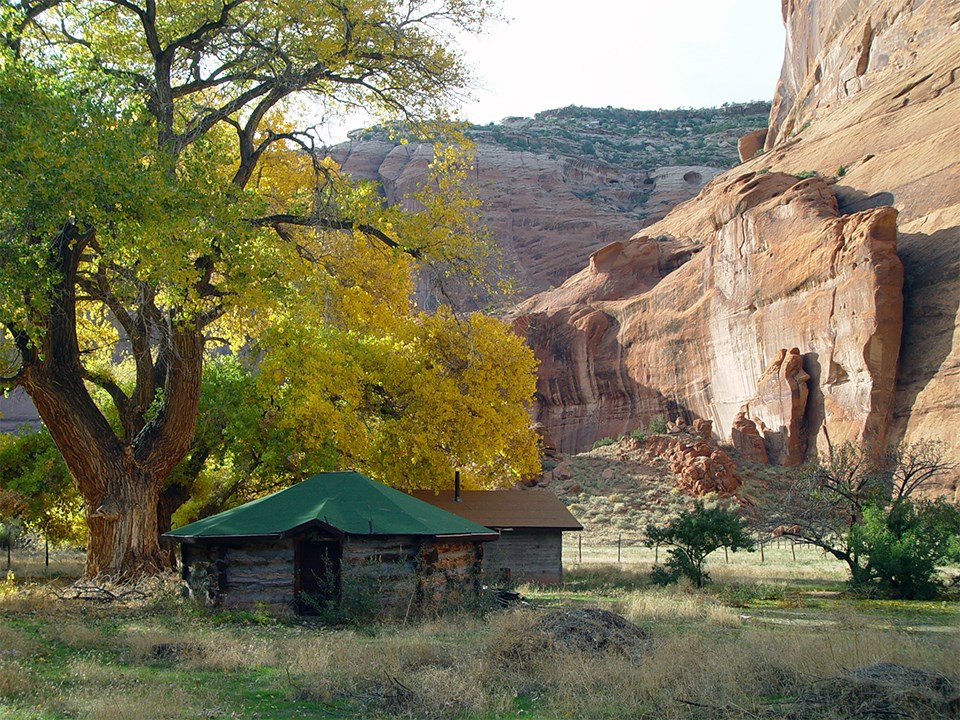
Fresh leaves and lush tree tops appear vibrantly green to our eyes because of spectra, or the way they reflect sunlight. Since they absorb every wavelength except for green, we see green. When they begin to change to yellow and red, the leaves are reflecting those colors’ wavelengths.
These telltale signs, or changes in spectra, help researchers understand vegetation health. Although there is more spectral data than ever before from airborne, satellite and ground sensors, the data are not always easy to use.
The EcoSIS database is a one-stop portal to add, discover and use spectral data. “Spectral information is an indicator for biodiversity,” Natasha Stavros, an engineer working with Townsend at NASA’s Jet Propulsion Laboratory, said. Spectral data can help us understand genetic diversity, Stavros said.
Now that EcoSIS is up and operating, the team is developing the Geospatial Spectroscopy Processing Environment on the Cloud (GeoSPEC), which is a prototype for a user-focused data system that makes it easier to access and use spectral information. As we send more instruments into space and collect data from aircraft and ground sensors, we end up with a tremendous amount of data.
To make that data accessible, GeoSPEC operates in a cloud environment so that researchers can access, work and play with data without having to overwhelm their computers’ hardware capabilities. “GeoSPEC is not about accessing data; it’s about enabling access to information,” Stavros said.

Next steps
While GeoSPEC builds on EcoSIS, the PBGJAM team plans to create tools that incorporate remotely sensed imagery to reveal canopy three-dimensional structure, composition and function. Many birds, mammals and insects make their homes in the vegetation canopy. The Map of Life team plans to create an online database that includes analysis products and visualizations from remotely sensed biodiversity data. These recently-funded tools will continue to lower the barrier of entry for users to interact with biodiversity data
The projects were all funded under NASA’s Advanced Information Systems Technology (AIST) program, which is part of the Earth Science Technology Office at NASA Headquarters. The AIST program funds evolutionary and disruptive projects that meet NASA’s goals to effectively monitor and understand our planet. The program aims to increase access to science data and enable new observation measurements and information products.
“AIST projects are defined and driven by science,” said Jacqueline LeMoigne, the AIST program manager. And in return, LeMoigne looks to the projects to help define new science goals and requirements to collect future science measurements from space.
“As climate changes, species and communities of species must either adapt or migrate to areas with more favorable conditions,” Rogers said. These AIST projects help predict and track these adaptions and migrations. “In the long run, the program also aims to enable future NASA Earth science missions by discovering and maturing breakthrough computer science, software, and information system technologies,” LeMoigne said.