


![Request for Information – Potential [Placeholder for Prize]](https://assets.science.nasa.gov/dynamicimage/assets/science/missions/a-step/FFR_Earth_Background_20251120%20.png?w=1024)


NASA EVM Tutorial
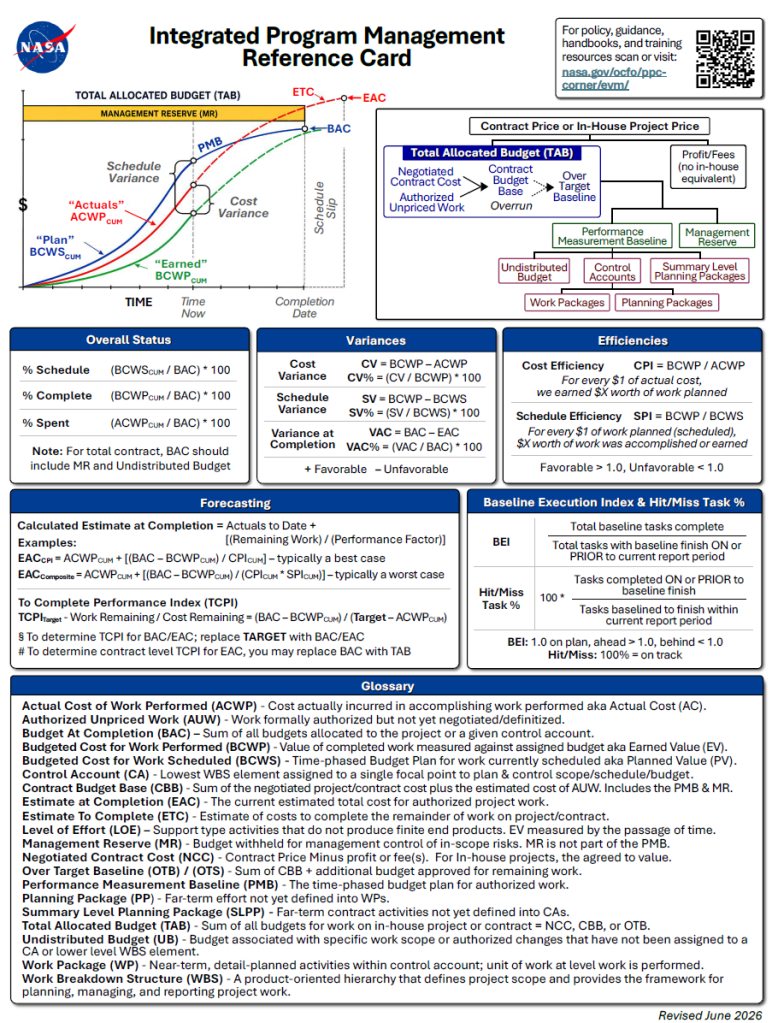
Earned value provides an objective measurement of how much work has been accomplished on a project. Using the earned value process, the management team can readily compare how much work has actually been completed against the amount of work planned to be accomplished. All work is planned, budgeted, and scheduled in time-phased “planned value” increments constituting a Performance Measurement Baseline (PMB).
Let’s look at a simplified example:
The baseline plan shown in the above graph illustrates a task with a total budget amount of $240k, which is planned for accomplishment over 24-month time frame. The “time-now” line shows that $100k of the project resources was planned to be completed at this point in the project. Another way to look at this is that the project was planned to be 41.6% complete ($100k / $240k) at this point in time.
As work is performed, it is “earned” on the same basis as it was planned, in dollars or other quantifiable units such as labor hours. Comparing earned value with the planned value measures the dollar value of work accomplished versus the dollar value of work planned. Any difference is called a schedule variance.
Earned Value – Planned Costs = Schedule Variance (SV)
In our example the task was planned to have accomplished $100k worth of work in twelve months, but the real accomplishment was only $60k. The graph shows a “behind schedule” condition. The schedule variance in dollars would be a negative $40k, the difference between the earned value accomplished ($60k), and the value of the planned work ($100k) to date. According to our formula then:
$60k – $100k = ($40k)
The value earned for the work performed compared with the actual cost incurred for the work performed (taken directly from the contractor’s accounting systems), provides an objective measure of cost efficiency. Any difference is called a cost variance.
Earned Value – Actual Costs = Cost Variance (CV)
A negative variance means more money was spent for the work accomplished than was planned. Conversely, a positive variance means less money was spent for the work accomplished than was planned to be spent.
From the performing organization’s own accounting system, we determine the actual costs for performing the $60K work was $110K.
When the actual costs are compared with the earned value of $60k, the difference is the cost variance. The earned value of $60k less the actual cost of $110k, is a negative cost variance of $50k. In this example, the task is in an overrun condition by $50k.
$60k – $110k = ($50k)
Analysis of these variances should reveal the factors causing the deviation from plan.
The Task Manager uses this information in conjunction with his knowledge of the task, to project an estimate to complete for this task. The Task Managers analyzes variances resulting from comparisons of these five basic data elements; planned work, work accomplished, actual costs, total budget at completion and the estimate at completion. The work breakdown structure provides a useful framework for summarizing this performance information for all levels of management.
Earned value improves on the “normally used” spend plan concept (budget versus actual incurred cost) by requiring the work in process to be quantified. The planned value, earned value, and actual cost data provides an objective, quantifiable measurement of performance, enabling trend analysis and evaluation of any cost estimate at completion within multiple levels of the project.
EVM is a valuable tool in the Project Manager’s “toolbox” for gaining valuable insight into project performance and is the tool that integrates technical, cost, schedule and risk management. In addition, EVM provides valuable quantifiable performance metrics for forecasting at-completion cost and schedule for their project.
Earned Value – Planned Costs = Schedule Variance (SV)
Analysis Considerations
Favorable and unfavorable variances should be carefully evaluated. The program analyst should examine and understand the reasons for underruns as well as overruns because they could be masking a serious problem.
Establishing Thresholds for Reporting and Analysis
- Establish threshold reporting based on risk and tailored to WBS by specific dollar amount and/or variance percentage
- Identification of threshold reporting should also consider program phase, risk and WBS criticality
Good Variance Analysis Identifies
- The Problem
- Cause of the Problem
- Impact to the Program (Cost, Schedule and Technical)
- Corrective Action
- Get well date
Areas to Address
- Poor initial planning or estimating
- Technical breakthroughs or problems
- Cost (or usage) of labor, material, or Other Direct Costs higher or lower than planned
- Inflation and new labor contracts
- Front-end loading
Reconciliation Analysis
- Other budget/funding documentation
- Labor resource planning documentation
- Schedules
NASA Integrated Program Management Reference Card
Access Reference Card