


![Request for Information – Potential [Placeholder for Prize]](https://assets.science.nasa.gov/dynamicimage/assets/science/psd/solar/2023/09/s/solarsystem_0.jpg?w=1024)


Balance Constant Conversion Form Description
Purpose
This conversion form (BCC Form) provides rescale ratios to convert units of balance raw data (in SDS counts) into units for the balance calibration data reduction matrix (DRM). Typical DRM units are lbs (or inch-lbs) per microvolts per volt.
BCC form has a number of cells which calculate various signal levels such as Shunt and Rcal values, and maximum load levels. These estimates can be used to determine if instrumentation amplifier settings will result in overranges and also can be used to check basic EU calculations.
Download a Excel file of Balance Constant Conversion Form
Rescale Ratio
The two specific numbers that are critical for this conversion and must not have measurement errors or typos are the balance calibration shunt value and the SDS (wind tunnel) shunt value. This is the rescale ratio of calibration shunt to SDS wind tunnel shunt is multiplied to SDS balance data so the data can be applied to the DRM.
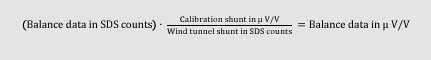
Balance data reduction matrix (DRM) is formatted to units of lbs (or inch-lbs) per microvolt per volt. Units of raw data from SDS wind tunnel data acquisition system are in “Counts” (one millivolt is equivalent to 3.2 counts). Rescale ratio converts SDS Counts to microvolts per volt so data has consistent units for the DRM. Rescale ratio also normalizes the data for amplifier gains, digitizing offsets, etc.
Previous versions of the BCC Form rescaled primary sensitivities of K1 and K2 before Ames implemented the AIAA Recommended Practice R-091-2003, which instead uses a multiple math term data reduction matrix (DRM).
Quick Example
Zero corrected calibration shunt from balance calibration lab is 1102.086 uV/V for the N1 gage. Same shunt resistor used in balance calibration lab is applied across the N1 gage and output is 18050.2 counts (zero subtracted).
Rescale ratio is 1102.086/18050.2 or 0.061056719593. Raw data from SDS, in counts, is multiplied to this value of 0.061056719593 and result is in microvolts per volt. This microvolt per volt data can then be applied directly to the data reduction matrix.
Unitary Plan Wind Tunnel Data Systems
Wind tunnel data system, SDS (Standard Data System), has dedicated signal conditioning instrumentation and computer systems to provide balance data. Raw data is acquired as “counts” equivalent to 3200 counts per volt. Exact conversion
to volts cannot simply use factor of 3200 because signal conditioning amplifiers (Precision Filters 2311) are not exactly
1024 (or 512). Also the digitizer (Preston Presys 1000) cannot be considered an exact conversion from analog voltage to
digital value.
Shunt Resistors
Precision shunt resistors provide the most accurate conversion of SDS counts to volts (or microvolts per volt) because they simulate a specific application of loads to balance gages. Gage output will change with application of a physical load or application of a resistor (i.e. shunt or Rcal) across one of the strain gage bridge. Advantage of using shunt ratio is it maintains and cancels whatever units are used, but need to use same resistors and maintain same units in wind tunnel as in balance calibration lab.
Create Shunt Calibration Values for Balances if there are no useful calibration shunt values with the balance.
Ames Balance Calibration Lab provides shunt resistor output values with the shunt resistors that were applied on balance gages during calibration. Shunt resistors are electrically connected across one of the strain gage wheatstone bridge arms (usually -excitation and -signal) to simulate precise loads, usually 80% of maximum calibrated loads. This value is called the Calibration Shunt Resistance (CALSNT or Bal Cal Shunt), it can also be used to simulate a precision weight that was applied to the balance gage.
After the balance is installed in the wind tunnel facility and warmed up for at least one hour, the same shunt resistors are applied on the balance gages exactly as done in the balance calibration lab. The balance gages will output exact same
voltage as in the balance calibration lab. This voltage output is considered the “standard” which is used to scale both data systems together.
Rcals are a set of precision metalfilm resistors on the PF2310 signal conditioning cards. Values are selected on the DIP switches mounted on the cards, Rcal resistors are applied by a command from SDS. Rcals are used to generate a value of loading similar to shunt resistors, Rcal values are used for health checks and for tracking drift in the data system, the calibration correction or CALCOR.
BCC Form Description
Some values are entered manually and other values are computed by the Excel worksheet. Set Values and Measured are user entered, Estimated and Calculated values are done by the Excel sheet. Equations on conversion form can be used for manual calculations for verification.
Although many numbers are listed in this form, the two critical values are the zero corrected calibration shunt value (Line F) and the wind tunnel shunt value (Line T).
It is good practice for calibration lab to furnish information of all lines from A to I. Also make notes of unusual balance orientation, if model is mounted on balance (produces a tare to gage outputs), and if shunt resistors are applied in different manner. Missing balance information can make troubleshooting more difficult.
Data from Balance Calibration Lab
Lines A, B, C, D, E, F, G, H, I
Balance type, inventory, serial number, calibration date, which pin number used, test name, etc. should be completed. “Cal Date” is when balance was calibrated, “Comp Date” is when data analysis was performed.
Other test information should be entered to help track documentation if needed. This form is always subject to revisions which Revision date and time should be listed.
Additional notes should include what leads the shunt resistors are applied.
Also enter the specific date and time when BALFIT analysis was performed (i.e. “3/26/2008 11:40:09 AM”), there may be more than one BALFIT report, don’t mix different reports to what DRM is used in SDS.
Gage Name (GAGNAM):
SDS name for balance channels: BAL1G1, BAL1G2, BAL1G3, BAL1G4, BAL1G5, BAL1G6 (balance 1 with 6 gages).
Gage Type:
Type of load in terms of AIAA recommended practice, gage order is typically forward normal (BAL1G1), aft normal (BAL1G2), forwared side (BAL1G3), aft side (BAL1G4), rolling moment (BAL1G5), axial force (BAL1G6).
Maximum Balance Capacity, Line A:
Highest magnitude of load applied to gage during calibration.
Engineering Units (EU), Line B:
Engineering units for the gage. i.e. lbs, inch-lbs.
Bridge Resistance (OHM), Line C:
Resistance of gage bridge in ohms, measured by Bal Cal lab across +excitation and -excitation leads.
Gage Excitation, Volts, Line D:
Gage excitation applied during balance calibration.
Primary gage sensitivities from balance calbration, Line E:
This is a basic EU calculation, not interaction corrected, typically in lbs per microvolt per volt.
Zero Corrected Calibration Shunt (CALRDG), Line F:
Gage output when shunt resistor was applied during balance calibration. Units are usually microvolts per Volt. Shunts are typically applied across -excitation and -signal. Note if shunts are applied across other wires, i.e. +exc and +sig or if applied on specific leads of a 6-wire or 8-wire gage.
Create Shunt Calibration Values for Balances if there are no useful calibration shunt values with the balance.
Shunt Resistance (CALSNT), Line G:
Value of shunt resistor applied on gage during calibration. Resistance is typically set to simulate 80% of load capacity.
Simulated Load by Shunt Resistor, Line H:
The shunt resistor simulates a specific load in pounds, inch-lbs, or whatever engineering units used. EUs are calculated by multiplying calibration shunt (Line F) to prime sensitivities (Line E).
Max Output from gage (load capacity), Line I:
Calculated output voltage from gage when it is loaded to capacity. Calculated from dividing load capacity (Line A) by primary gage sensitivity (Line E).
SDS FSP1 Balance Subsystem Settings
Lines J, K, L, M
These are settings to the Precision Filters amplifiers and values for Shunt and Rcal resistors.
Gage Excitation, Volts, Line J:
Excitation for the balance channel of the Precision Filters signal conditioning amplifier. Default is 5.000 volts.
Amplifier Channel Gain, Line K:
Gain setting for the balance channel of the Precision Filters signal conditioning amplifier. Default is 1024.
Shunt Resistor at Tunnel, Ohms, Line L:
Value of shunt resistor applied on balance gage to generate a wind tunnel shunt value. Resistor value must
be same as Line G.
Rcal Resistor on amp card, Ohms, Line M:
Value of Rcal resistor for balance channel. Select resistance to same as, or close as the shunt resistor (Line L). Rcal performs same function (electrical simulation of a specific weight) as shunt resistor but adjusts for shifts in the signal conditioning amplifier (CalCorr).
Internal relays on PF2310 signal conditioning card applies Rcal across minus excitation and minus signal of the balance gage.
Rcal resistors are a series of small metal film precision resistors soldered across a DIP switch. Switch settings are open (OFF) to select a particular value of resistance. These resistors are 1K, 2K, 4.99K, 10K, 20K, 40.2K, 80K, 160K.
Estimated SDS Output for Shunts and Rcal
Lines N, O, P
These are calculated values using strain gage equations as a function of gage resistance and amplifier settings. Values are not used for any final calculations, they are to check for over-range and also examine if amplifiers are spanned for maximum fidelity. Estimates may be about 200 counts or higher different that actual observed. If actual observed values are on order of 5000 counts or higher differences, then check for input or wiring errors.
Estimated Shunt Output Value, Line N:
This is the estimated change of output when shunt resistor of Line L is applied across the bridge. Units are in SDS counts. Calculation is from a strain gage equation.
Expressing as line numbers, Counts = ( C • J • K • 500 • 3.2) / ( C + 2 • L )
Estimated Rcal (INCAL) Output Value, Line O:
This is an estimated change of output when Rcal resistor of Line M is applied across the bridge. Units are in SDS counts. Calculation is from a strain gage equation.
Expressing as line numbers, Counts = ( C • J • K • 500 • 3.2) / ( C + 2 • M )
Estimated Output for Max Load, Line P:
This estimated value, in SDS Counts, is calculated from value of maximum applied load on gage (Line A), approximate gage output of max load (Line I) that has been adjusted for the SDS settings of excitation and gain (Lines J and K).
Expressing as line numbers, Counts Output for Max Load = ( I • J • K • 3.2) / 1000
Examine these values to determine whether Precision Filters amplifier outputs will overrange. If there is overrange, then either excitation or gain are set too high.
Measurements at Tunnel
Lines Q, R, S, T, U
These values are measured after balance is connected and warmed up for least one hour. SDS Data should be the “_MEAN” counts from balance. Never use computed values.
It is important that Rcal and shunt values are not zero corrected. If a zero corrected value is entered, Shunt and INCAL will have its zero subtracted twice and will cause unacceptable computations of balance data. This error is not easy to detect but will cause unacceptable errors in final balance computations.
SDS Run and Sequence numbers are entered for reference if there is a need to examine that point for additional data.
Zero Level from Tunnel, Line Q:
Gage output of no-load zero level, usually in SDS “_MEAN” counts. Get this value by taking a SDS “Zero Point.” Prefer this be a bare balance but many times in wind tunnel test section the model will be on balance. Note Run and Sequence number.
Rcal Applied at Tunnel, not zero corrected, Line R:
Gage output with Rcal resistor applied (on Precision Filters amplifier card) in SDS “_MEAN” counts. Get this value by taking a SDS “Cal Point” and “_MEAN” value is not zero subtracted (subtraction is done later in Line U). Note Run and Sequence number.
Shunt Applied at Tunnel (not zero corrected), Line S:
Gage output with shunt resistor applied (on same wires as done during balance calibration) in SDS “_MEAN” counts. Apply shunt resistor and take a Bal Check (BCH) point. Don’t take a “Cal Point” because Rcal will be applied while shunt resistor is already applied. This shunt value is not zero subtracted (subtraction is done later in Line T). Note Run and Sequence number.
Shunt Value to be used for ratio, Line T:
Zero corrected value of wind tunnel shunt. Do not enter any numbers here (Excel does the calculations).
Line T = S – Q
INCAL Value to be used for SDS, Line U:
Zero corrected value of Rcal called INCAL in SDS. This is considered the first value for Cal Points, and CALCORs are referenced to this value. Do not enter any numbers here (Excel does the calculations).
Line U = R – Q
Conversion from Balance Calibration Values to Wind Tunnel Values
Line V
This rescale ratio is the most important function of this form. It is the ratio of balance calibration shunt to SDS wind tunnel shunt to convert the balance data from SDS counts to microvolts per volt. This is calculated by the Excel spreadsheet, do not enter numbers here.
Rescale Ratio of Bal Cal Shunt to SDS Shunt, Line V:
Rescale Ratio (Line V = F / T)
This is an important calculation, a mistake will cause disaster in balance computations. This ratio is zero-corrected balance calibration shunt divided by zero-corrected wind tunnel shunt.
Calculations of wind tunnel SDS systems
Line W, X, Y
Primary gage sensitivities are basic balance EU coefficients to compute lbs and inch-lbs from SDS counts but are not interaction corrected. These coefficients can be used to first order load calculations but these are not used for actual data reduction (that is done using the DRM). Values are calculated by multiplying balance calibration primary gage sensitivities (Line E) by the Rescale Ratio of Line V.
Primary gage sensitivities, Line W:
These coefficients compute primary loads from SDS Counts. Results are only used for preliminary checks.
Line W = E • V
Simulated Shunt Load, Line X:
As in Line H, this computes the load simulated by the shunt resistor. The computed load (lbs or inch-lbs) should equal to the load computed in Line H. If not, check for typos and/or mis-wiring errors.
Line X = T • W
Amplifier Gain, Line Y:
This calculates amplifier gain of balance channel by dividing amplifier output voltage by amplifier input voltage. Because voltages are not measured they are computed from shunt values. Amplifier output is wind tunnel shunt value in SDS counts converted to microvolts per volt. This value is divided by the balance calibration shunt microvolts per volt. Calculated amplifier gain should be approximate to gain set of applicable channel (in most cases it will be slightly less). If significantly different, check for typos and/or excitation and gain settings.
Line Y = (T • (1000 / 3.2) / J) / F
Derivation of Strain Gage Equation of Bridge Output vs. Applied Shunt Resistance

Analysis of the Estimated Shunt Output Value
Line N of conversion form
Bridge Output, mVolts = ( R • Ei • 1000 ) / ( 2 • R + 4 • Rsh)
Where R is gage resistance in Ohms (Line C)
Ei is gage excitation in Volts (Line J)
Rsh is shunt resistance in Ohms (Line L)
SDS output in counts is,
Counts = ( Bridge Output, mVolts ) • ( G ) • 3.2
Where G is the Gain (Line K) and “3.2” is the conversion of millivolts to SDS Counts.
Equation to calculate Shunt Counts is,
Counts = ( R • Ei • G • 3.2 • 1000 ) / ( 2 • R + 4 • Rsh )
Where R is gage resistance in Ohms (Line C)
Ei is gage excitation in Volts (Line J)
Rsh is shunt resistance in Ohms (Line L)
G is amplifier channel gain (Line K)
3.2 is the conversion of millivolts to SDS Counts.
Canceling factors from numerator and denominator,
Counts = ( R • Ei • G • 3.2 • 500 ) / (R + 2 • Rsh )
Expressing as line numbers,
Counts = ( C • J • K • 3.2 • 500 ) / ( C + 2 • M )
To calculate value for Rcal, same equations are used except substitute Line N with Line O (the rcal resistance).
Other Useful Strain Gage Equations
Rsh Shunt calibration resistance (or Rcal for resistor on PF card)
Ei Bridge input or excitation, Volts
K Gage factor, typically 2
Eo Bridge output, mV
Em Modulus of elasticity
S Stress, psi or (ksi for 1000 psi)
N Number of active gages
R Bridge resistance, ohms
For balances, N is typically 4 (all four gages are active).
Modulus of Elasticity, or Young’s Modulus

The modulus of elasticity, also called Young’s Modulus, is the constant relating stress and strain for a linearly elastic material.
In practical terms, modulus of elasticity is a measure of a material’s stiffness. The higher the modulus of elasticity, the stiffer a material is.
Figure above shows a typical stress-strain curve for a material and will be useful in describing some of the physical properties.
(1) is the slope of the elastic portion of the stress-strain curve termed the modulus of elasticity. By definition, the proportional limit,
(2) is the point within the elastic range where the stress-strain curve departs from being linear. This point can also be thought of as the elastic limit.
Beyond (3) point, the specimen will show permanent deformation, after removal of the load, due to plastic strain.
Typical Values for Modulus of Elasticity, Em:
Steel 30 million psi
Aluminum: 10.3 million psi
Iron: 24 million psi
References
Strain Gage Users Handbook, Chapter 2, by Larry Shull, 1992 Hannah and Reed, Society of Experimental Mechanics, ISBN 1-85166-686-9, TA 413.5 S86 1992.
“Techniques for System Calibration”, Barry Pogach, B&F Instruments, Aerospace Instrumentation Symposium, June 3, 1968, Boston, Mass.
“Errors Due to Wheatstone Bridge Non-Linearity”, 1982, Measurements Group, Inc. TN 507.
“Optimizing Strain Gage Excitation Levels”, 1988, Measurements Group, Inc. TN 514.
“Shunt Calibration of Strain Gage Instrumentation”, 1988, Measurements Group, Inc. TN 514. Measurements Group is a manufacturer of strain gages and accessories.
Strain Gage Primer, 2nd Edition, C.C. Perry & H.R. Lissner, McGraw-Hill Book Co. This is an extensive discussion about strain gages.
Strain Gage Technology, A.L. Window & G.S. Holister, Applied Science Publishers, TA413.5 S87 c.1
“Wheatstone Bridges”, Chapter 5, from Applied Measurement Engineering, Charles P. Wright, Prentice-Hall Inc., 1995