December 2019: NASA’s contributions to aviation
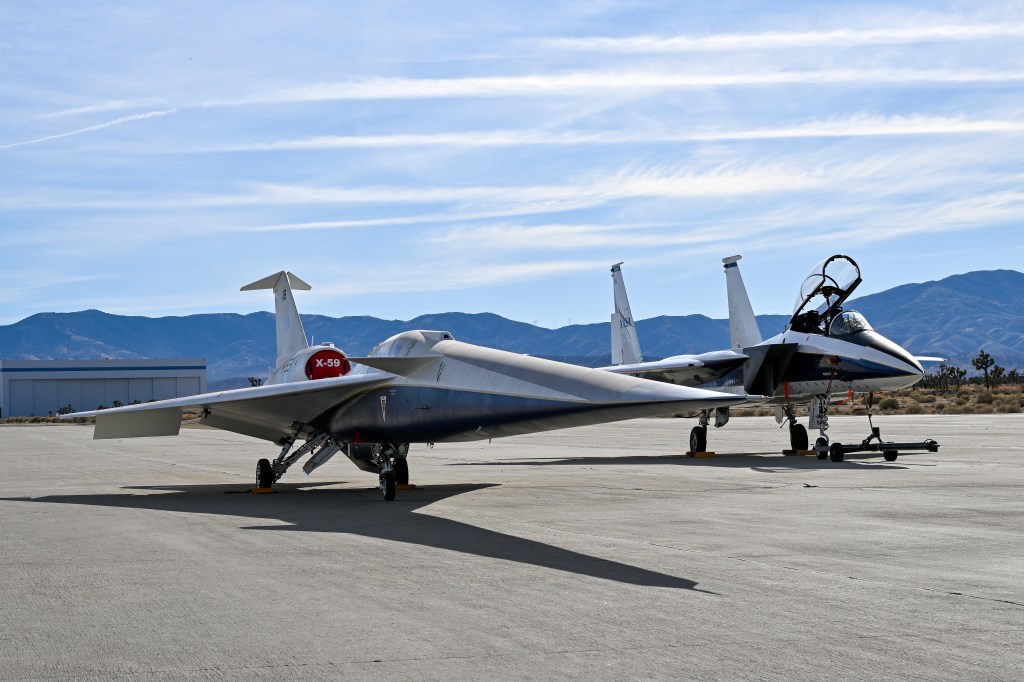
In a recent conversation, Emmett Quigley, of the Code SS Instrument Lab, mentioned that he had worked on some wind tunnel model components for the Boeing 777 program. That got us to wondering about NASA’s influence on aviation in general and in particular on the commercial aircraft on which many of us fly as passengers without giving much thought to how they and all their highly technical systems and components have come into being. A little research led us to a much greater appreciation for the substantial role NASA aeronautical research has played in the development of aviation.
In January 2009, birds struck the engines of US Airways Flight 1549 and forced an emergency landing into the Hudson River. Everyone on board survived, and the crew was lauded for remaining calm under pressure and keeping passengers safe. But even before they knew they had an emergency, the crew were utilizing specific training and procedures for safe and effective operations—parts of key operational methods and technologies originally developed by NASA.
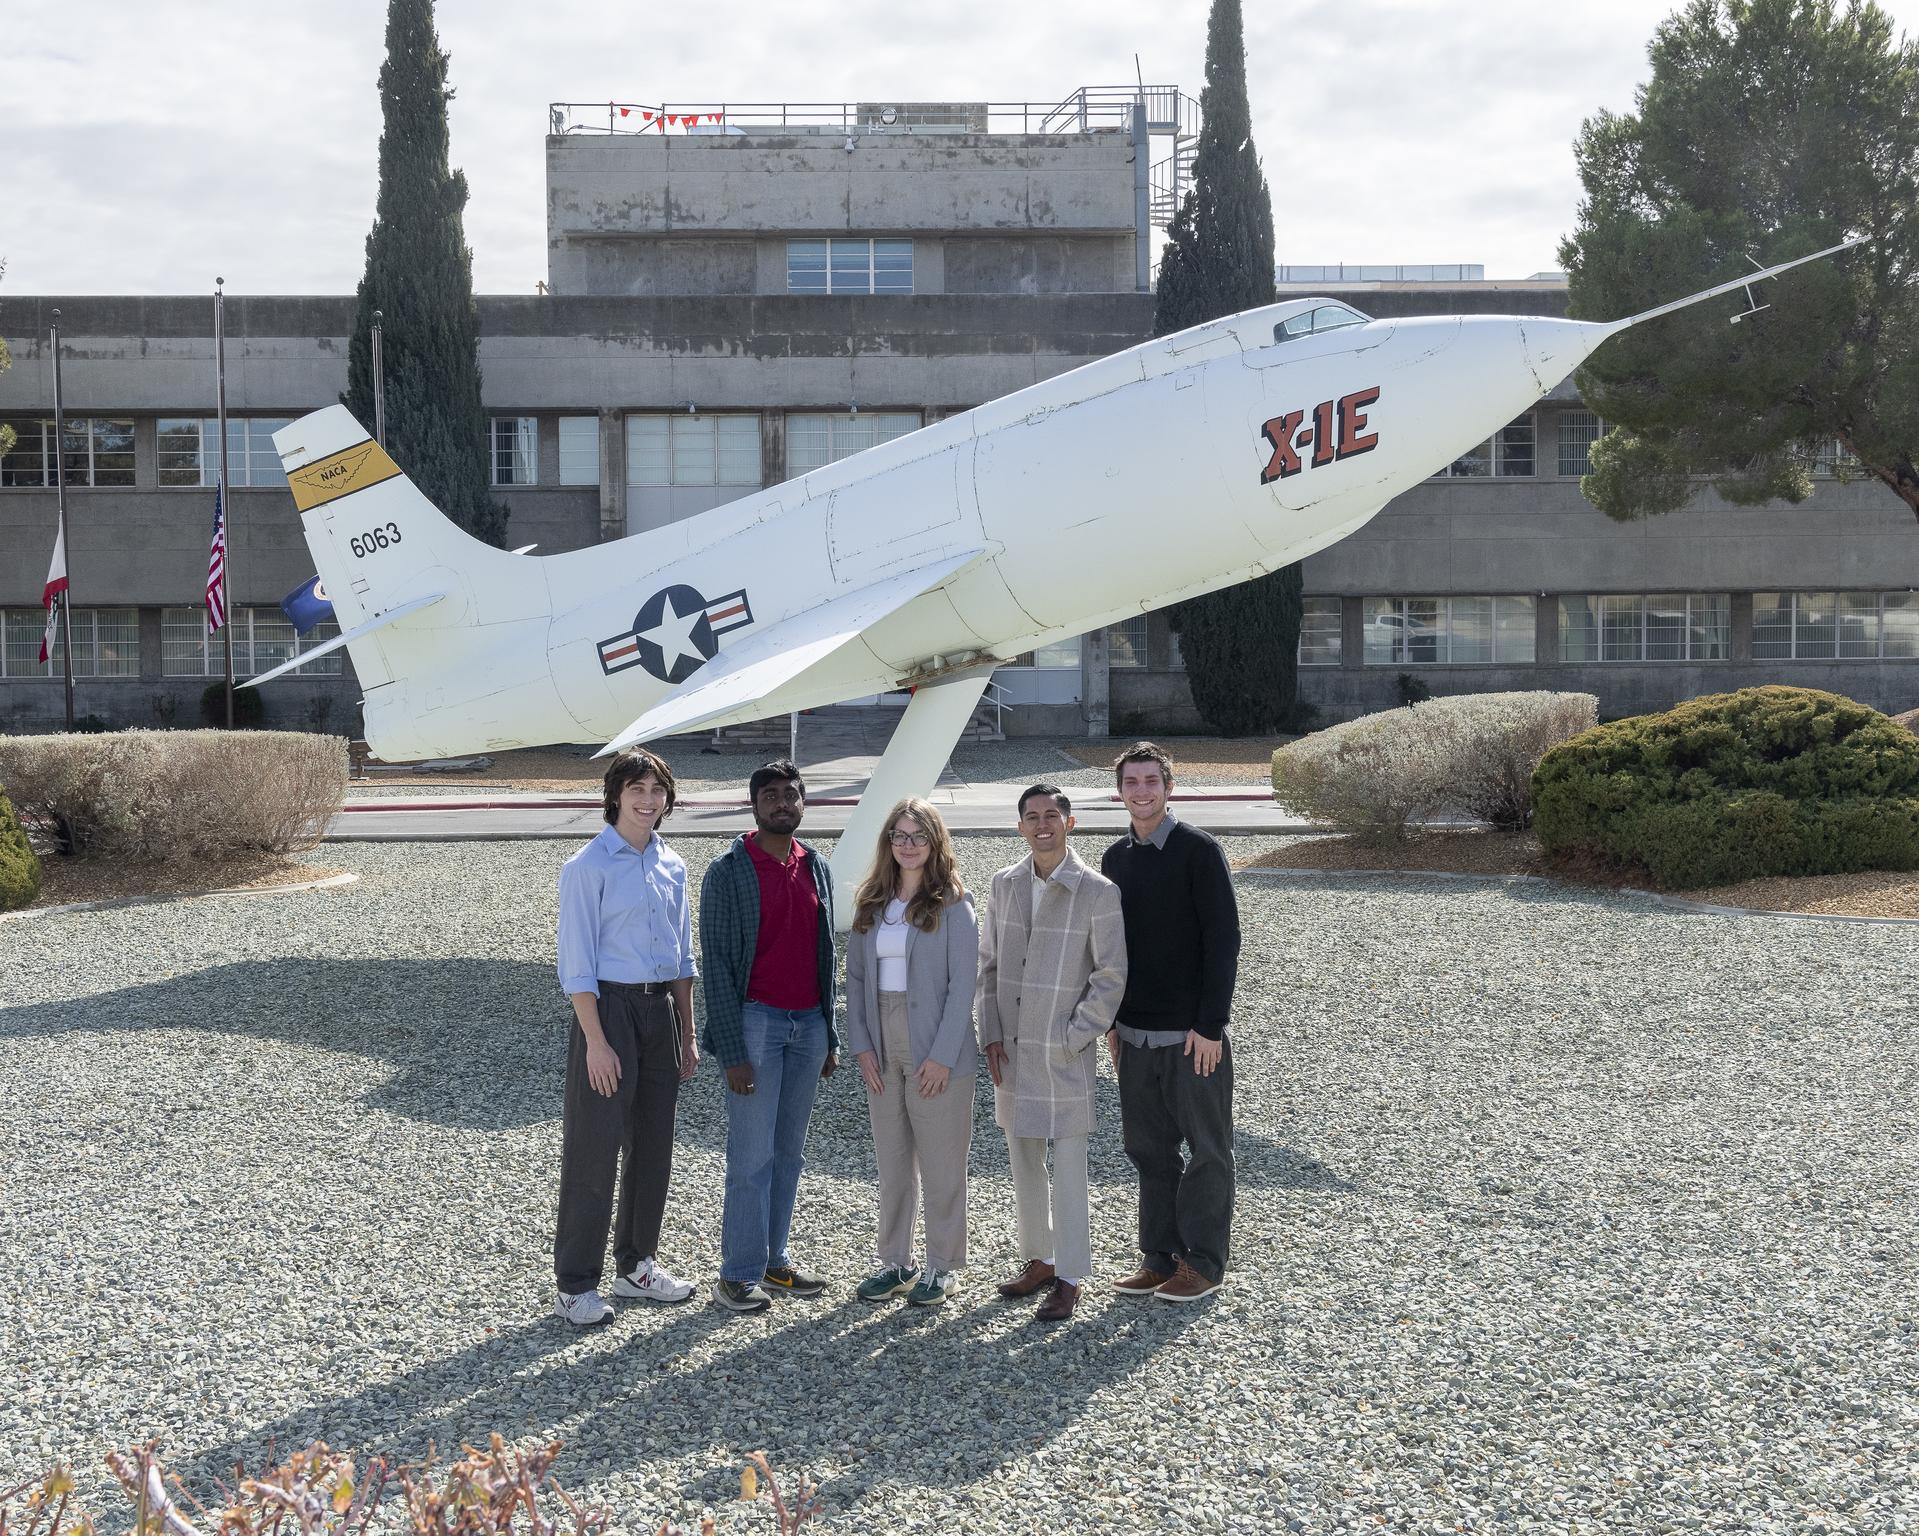
Actually, aeronautical research by the United States predates the creation of NASA as an agency, going back to its predecessor, the National Advisory Committee for Aeronautics (NACA), established in 1915 in an effort to catch up with Europe’s rapid technological advancements in aviation. For more than forty years, NACA managed and conducted aeronautics research, experiments, flight tests, and simulations, solidifying a major role in the growth of the industry. During the course of its lifetime, NACA established four centers across the United States: Langley Memorial Aeronautical Laboratory in Virginia, the Aircraft Engine Research Laboratory in Ohio, and Ames Aeronautical Laboratory and Muroc Flight Test Unit, both in California. In 1958, NACA was evolved to include space, and its laboratories formed the nucleus of a new government space agency, the National Aeronautics and Space Administration. You’ve already guessed that Ames has played a leading role in both agencies and has an impressive record of contributions to human flight. Herewith, for your reading pleasure is a summary of some of the major contributions of these two agencies to the improvement of aviation for all.
One example, recently featured in a television series about aviation safety, is a contribution from Dr. Asaf Degani, a former NASA Ames (SJSUF) researcher who developed an improved digital checklist to reduce the possibility of missing or overlooking items on paper checklists. The improper use, or the non-use, of checklists by flight crews has been cited as a contributing factor to a number of aircraft accidents.
Then there is the Aviation Safety Reporting System (ASRS) which collects voluntarily submitted aviation safety incident and situation reports from pilots, controllers, and others. An important aspect of the system is that these reports can be submitted confidentially. The ASRS collects, analyzes, and responds to these aviation incident reports, makes them available to the aviation public, and acts on the information they contain in order to lessen the likelihood of accidents. The ASRS is run by NASA as a neutral party, since it has no powers of enforcement. The success of the system, which is located here at Ames, serves as a positive example that is often used as a model by other industries seeking to make improvements in safety. You can browse these reports at http://www.37000feet.com
Below are some additional examples of NASA contributions to aviation safety and efficiency.
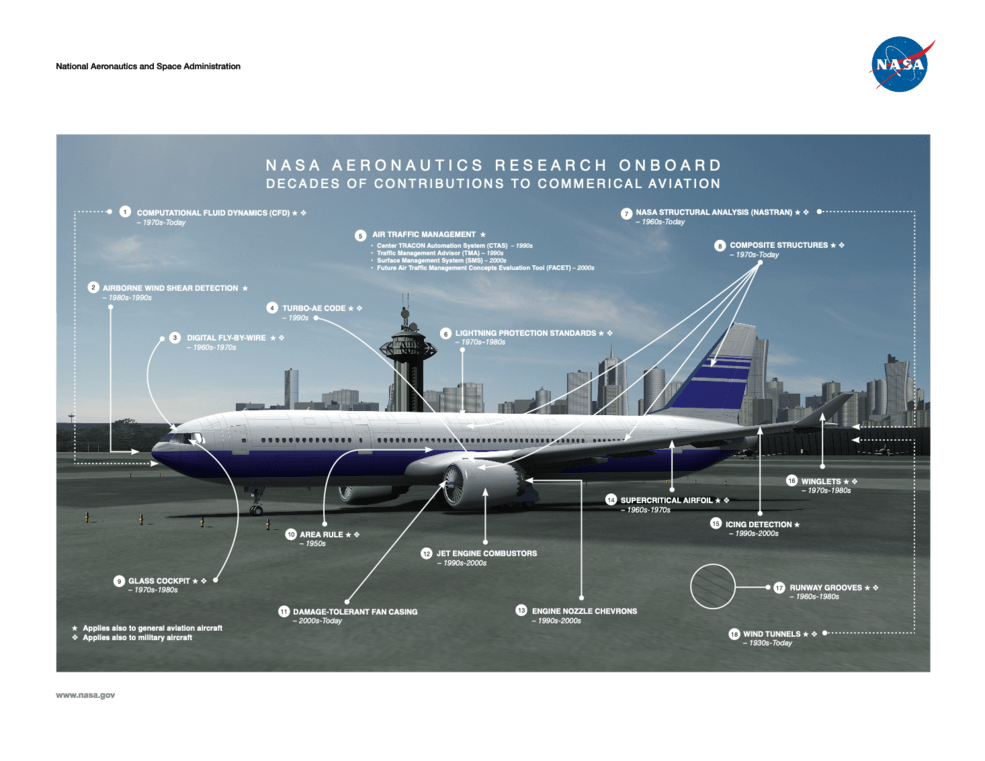
1. Computational Fluid Dynamics (CFD)
Starting in the 1970s, NASA began developing sophisticated computer codes that could accurately predict the flow of fluids, such as the flow of air over an aircraft’s wing or fuel through a space shuttle’s main engine. Those ideas and codes became CFD, which today is considered a vital tool for the study of fluid dynamics and the development of new aircraft, greatly reducing the time and cost required for designing and testing nearly any type of aircraft.
2. Airborne Wind Shear Detection
During the 1980s and 1990s, NASA led a comprehensive research program to identify the characteristics of dangerous wind shear, and validated technologies that can predict its severity while in flight. Today, aircraft are equipped with forward-looking sensors that alert pilots to wind shear hazards.
3. Digital Fly-by-Wire
During the 1960s and 1970s, NASA helped develop and flight test the digital “fly-by-wire” system, which replaced heavier and less reliable hydraulics systems with a digital computer and electric wires to send signals from the pilot to the control surfaces of an aircraft. “Fly-by-wire” is used today on new commercial and military aircraft, and on the space shuttle.
4. TURBO-AE Code
During the 1990s, NASA developed a computer code that generates two-dimensional simulations of potential aeroelastic (AE) problems that can occur in jet engine blades. Such problems include flutter or fatigue that can eventually cause engine fan blades to stall or fail.
With TURBO-AE, engineers can more efficiently design thinner, lighter, faster-rotating blades for today’s jet engines built for higher performance, lower emissions and lower noise.
5. Air Traffic Management
Over the decades, NASA has developed a number of air traffic management simulation tools, including:
Center TRACON Automation System (CTAS) – 1990s
CTAS is a suite of software tools developed by NASA that generates new information for air traffic controllers.
Traffic Management Advisor (TMA) – 1990s
TMA software forecasts arriving air traffic to help controllers plan for safe arrivals during peak periods.
Surface Management System (SMS) – 2000s
SMS software provides controllers with data to know when aircraft arrive on the ground or at the gate.
Future Air Traffic Management Concepts Evaluation Tool (FACET) – 2000s
FACET maps thousands of aircraft trajectories to improve traffic flow across the United States.
6. Lightning Protection Standards
During the 1970s and 1980s, NASA conducted extensive research and flight tests to identify the conditions that cause lightning strikes and the effects of in-flight strikes on aircraft. NASA’s knowledge base was used to improve lightning protection standards for aircraft electrical and avionics systems.
7. NASA Structural Analysis (NASTRAN)
In the 1960s, NASA partnered with industry to develop a common generic software program that engineers could use to model and analyze different aerospace structures, including any kind of spacecraft or aircraft. Today, NASTRAN is an “industry-standard” tool for computer-aided engineering of all types of structures.
8. Composite Structures
NASA first partnered with industry during the 1970s to conduct research on how to develop high-strength, nonmetallic materials that could replace heavier metals on aircraft. Gradually used to replace metals on parts of aircraft tails, wings, engines, cowlings and parts of the fuselage, composites reduce overall aircraft weight and improve operational efficiency.
9. Glass Cockpit
During the 1970s and 1980s, NASA created and tested the concept of an advanced cockpit configuration that replaced dial and gauge instruments with flat panel digital displays. The digital displays presented information more efficiently and provided the flight crew with a more integrated, easily understood picture of the vehicle situation.
Glass cockpits are in use on commercial, military, and general aviation aircraft, and on NASA’s space shuttle fleet.
10. Area Rule
In the 1950s, NASA scientist Richard Whitcomb discovered several fundamental solutions to key aerodynamics challenges. One of the most revolutionary was the “area rule,” a concept that helped aircraft designers avoid the disruption in airflow and resulting drag caused by the attachment of the wings to the fuselage. By using the area rule, aircraft designers for decades have been able to make aircraft fly more efficiently at high speeds.
11. Damage-Tolerant Fan Casing
In the 2000s, NASA began spearheading research into developing a cost-effective turbofan jet engine casing that could be lighter, but still protect against possible fan blade failure inside the engine. The solution was a fan case made of braided composite material that can reduce overall engine weight, increase safety and improve aircraft structural integrity.
12. Jet Engine Combustors
During the 1990s and early 2000s, NASA improved the technology associated with jet fuel combustion to help engines burn fuel more cleanly. The improved combustion helps reduce polluting emissions from aircraft engines, making them more environmentally friendly.
13. Engine Nozzle Chevrons
During the 1990s and early 2000s, NASA computer simulations provided the latest improvements in design for chevrons—asymmetrical scallops that can be used on jet engine nozzles and nacelles to help reduce engine noise. Ground and flight tests by NASA and its partners proved that the new chevron design reduced noise levels in the passenger cabin and on the ground. Chevrons are being implemented on many of today’s aircraft, including the new Boeing 787.
14. Supercritical Airfoil
During the 1960s and 1970s, NASA scientist Richard Whitcomb led a team of researchers to develop and test a series of unique geometric shapes of airfoils or wing sections that could be applied to subsonic transports to improve lift and reduce drag. The resulting “supercritical airfoil” shape, when integrated with the aircraft wing, significantly improves the aircraft’s cruise efficiency.
15. Icing Detection
During the 1990s and early 2000s, NASA was called upon by the FAA to identify the characteristics of a dangerous and little-understood icing phenomenon called Supercooled Large Droplets (SLD). Results from NASA flight tests and research were compiled in a large database to improve weather models and instrumentation for detecting SLD.
16. Winglets
During the 1970s and 1980s, NASA studies led to the development of vertical extensions that can be attached to wingtips in order to reduce aerodynamic drag without having to increase wingspan. Winglets help increase an aircraft’s range and decrease fuel consumption.
The first aircraft to adopt winglets were within the general aviation and business jet communities. In the mid-’80s, Boeing produced the 747-400 commercial jetliner, which used winglets to increase its range.
17. Runway Grooves
During the 1960s, NASA conceived and developed a process for cutting transverse grooves into runways to channel away standing water. During the 1980s, NASA conducted more than one thousand test runs of aircraft and ground vehicles, proving that grooved runway surfaces have significantly greater friction properties. Grooved runways have since helped aircraft make safe landings on the pavement made slick from rain, snow, or ice. NASA’s groove process was adapted for use on military base runways, U.S. public highways, and even swimming pool decks, playgrounds and refinery floors.
18. Wind Tunnels
As early as the 1930s, wind tunnels built and operated by NASA’s predecessor, the National Advisory Committee on Aeronautics, or NACA, played a critical role in the design and improvement of aircraft. Through the decades, NASA’s expanded suite of tunnels continued to host valuable foundational testing in such areas as stability and control, in-flight icing, stall avoidance, propulsion systems, airframe development, flutter avoidance and noise reduction.
November 2019: Diamonds in Space?
As space facts go, this is pretty amazing: there may be a planet made out of diamonds!
The story of how diamonds are formed has been told numerous times by geologists. It is an age-old story of carbon and other carbon-based materials put under tremendous heat and pressure over millions of years and then pushed up from the Earth’s mantle through volcanic eruptions. But relatively recently, scientists have discovered that a new form of diamond exists, one previously unknown and never written about in the storybooks. It is now known that there are diamonds in outer space; some, tiny fragments not even big enough to put on a ring, but more recently, stars as big as the sun and planets as big as the Earth, comprised largely of diamond!
In 2012, scientists at Yale University discovered one of these, a nearby super-Earth they believe to be a “diamond planet” — a planet that has a mantle made of graphite and diamond. Called 55 Cancri e, it is just 40 light-years from Earth and orbits the binary star 55 Cancri, but is visible to the naked eye in the constellation of Cancer, which appears in the Northern Hemisphere in the early spring and in the Southern Hemisphere during autumn.
When the planet, which has a radius twice Earth’s and a mass eight times greater, was first observed in 2004, it was thought to be a water planet, similar to Earth, but new information has allowed the scientists to infer that the planet is much more likely to be a diamond planet. Diamond planets have been spotted before, but 55 Cancri e is the first one discovered orbiting a sun-like star.
Why is 55 Cancri e made out of diamonds? Because the star system itself is primarily made up of carbon, iron, and silicon — and over millions of years of pressure and heat, its carbon mantle has slowly turned into diamond. The Yale scientists estimate that as much as one-third of 55 Cancri e’s mass is made up of diamond — the same as three Earth masses, or roughly 18×1024kg. This is a few trillion times more diamond than has ever been mined on Earth.
Suffice it to say, the identification of just a single diamond-rich planet is fascinating news. In recent years, hundreds of rocky, Earth-like planets have been identified — and until now, we had assumed they had similar make-ups. It is now fairly safe to assume that there are millions of diamond planets in the universe.
There could be other planets out there with different chemistries, too — water planets, gold planets, uranium planets — and each are likely to have very different atmospheres, biologies, and geological/tectonic characteristics.
October 2019: The Doppler Effect
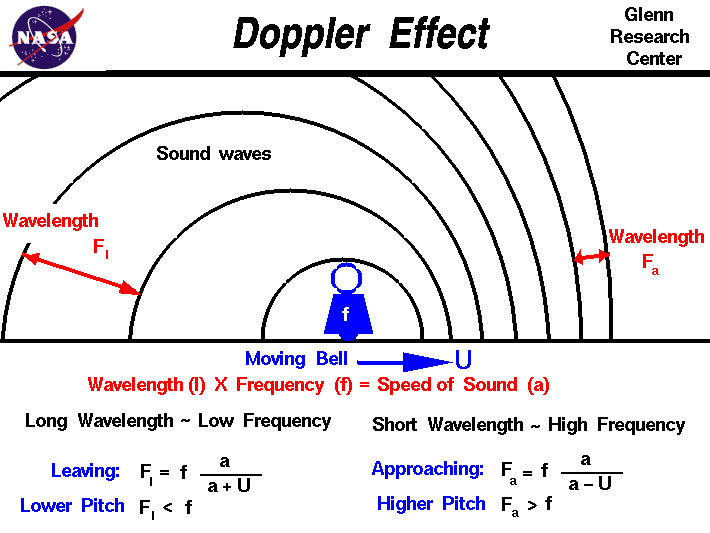
If you were to ask a little child to make the sound of the racing car zooming past, he or she would start with a high-pitched sound and then drop the pitch while mimicking the sound, ending on a much lower note. But the race car actually doesn’t change its sound unless it’s speeding up or slowing down. So why does the child perceive it differently? The answer was explained by Austrian mathematician and physicist Christian Doppler who postulated that the observed frequency of a wave depends on the relative speed of the source and the observer.
Consider a case where a fire truck is parked at a fire station. If the siren is on, a listener some distance away will perceive the siren at the same frequency at which it is emitted. Now consider how this situation changes when the truck is moving with a constant velocity towards the stationary observer. While the frequency of the fire engine’s siren as heard by a person on the firetruck has not changed, the waves in the direction of the truck’s motion bunch up as the fire truck is catching up to its own sound waves. The pressure variations impinge upon the eardrum of the stationary observer at an increased frequency. The stationary observer, therefore, perceives a higher tone than the one actually emitted from the fire truck. As the fire truck passes the stationary observer and begins moving away, the sound waves behind the fire truck are spread out because the siren is moving away from its own sound. This causes a stationary observer to perceive a decrease in the frequency of the siren, illustrating the Doppler effect or Doppler shift in the audio realm.
Now think about how this affects the light spectra of distant objects in the Universe. Does light experience the Doppler shift? Think about the spectrum of visible light: red-orange-yellow-green-blue-indigo-violet. It turns out that light from any part of the electromagnetic spectrum can be shifted up or down in frequency depending upon one’s relative motion to the emitting source.
Suppose that a scientist looks at a lamp that produces a very pure green light. Then imagine that the lamp begins to move rapidly away from the observer. The Doppler effect states that the frequency of the light will decrease. Instead of appearing to be a pure green color, it will tend more toward the red end of the spectrum. The faster the lamp moves away from the observer, the more it will appear to be first yellow, then orange, then red. At very high speeds, the light coming from the lamp will no longer look green at all but will have become red.
This green lamp example has been used to great advantage by astronomers when observing stars. The light of a star as seen from Earth is always slightly different from its true color because all stars are in motion. When astronomers observe stars in our own Milky Way galaxy, for example, they find that the color of some stars is shifted toward the blue, while the color shift in other stars is toward the red. Blueshift stars are moving toward Earth, and redshift stars are moving away from Earth.
The Doppler effect is therefore of intense interest to astronomers who use the information about the shift in frequency of electromagnetic waves produced by moving stars in our galaxy and beyond in order to derive information about those stars and galaxies. The belief that the universe is expanding is based in part upon observations of electromagnetic waves emitted by stars in distant galaxies. Furthermore, specific information about stars within galaxies can be determined by the application of the Doppler effect. Galaxies are clusters of stars that typically rotate about some center of mass point. Electromagnetic radiation emitted by such stars in a distant galaxy would appear to be shifted downward in frequency (a redshift) if the star is rotating in its cluster in a direction that is away from the Earth. On the other hand, there is an upward shift in frequency (a blue shift) of such observed radiation if the star is rotating in a direction that is towards the Earth.
In 1923, American astronomer Edwin Hubble (1889–1953) made an interesting discovery. He found that all stars outside our own galaxy exhibit redshifts of light. That is, all stars outside our galaxy must be moving away from Earth. Furthermore, the farther away the stars are, the more their redshift and, thus, the faster they are moving away from us.
Hubble’s discovery is one of the most important in all of modern astronomy. It tells us that the universe as a whole is expanding. Like dots on the surface of a balloon that’s being blown up, galaxies throughout the universe are racing away from each other. One conclusion to be drawn from this discovery is that—at some time in the past—all galaxies must have been closer together at the center of the universe. Ever since that time, those galaxies have been moving away from each other. This conclusion is the basis for the currently popular theory about the creation of the universe, the big bang theory.
On a lighter note: Since the Doppler shift also works for light then it must be possible to move so quickly towards a red traffic light that it would appear green to you! However, if you try to use this argument when stopped for running a red light, the police officer might then give you a ticket for speeding.
September 2019: Experiments in space: How will bacteria adapt in microgravity
Here on Earth, micro-organisms (or microbes for short) are everywhere. They are in the gardens we tend, the food we consume, and the surfaces we touch. Despite their ubiquitous nature, we are only now beginning to fully understand the key role they play in our lives. While some microbes cause diseases, the majority are relatively harmless and can even benefit human health, producing medicine – like probiotics – and different enzymes. Studying them, their environments, and their propensity for adaptation helps us to better understand our symbiotic relationship with these resilient creatures. While we couldn’t live without them, they certainly can live without us. https://www.nasa.gov/feature/experiments-in-space-how-will-bacteria-adapt-in-microgravity
The MVP Cell-02 mission will be studying how organisms evolve and adapt in a harsh space environment. Dr. Craig Everroad (PI) and team (Brad Bebout, Ph.D.; Jessica Koehne, Ph.D.; Antonio Ricco, Ph.D.) are sending the bacterium Bacillus subtilis to a controlled environment onboard the International Space Station (ISS). Over the course of three weeks, the team will watch cultures of B. subtilis adapt and evolve over 1,000 generations of growth in their specifically modified environmental hardware. Research from this experiment will help scientists understand the effects of the spaceflight environment on microbial evolutionary processes.
August 2019: Sunlight and the Earth
The Sun is the brightest and most familiar object in the sky. Life on Earth would not be possible without it:
- The food we eat exists because of sunlight falling on green plants, and the fuel we burn comes either from such plants or was accumulated by them (in the forms of coal, oil and natural gas) long ago.
- The Earth would probably not be fit for life. Life as we know it needs liquid water, and Earth is the only planet to have it: without the Sun, Earth would be an icy rock in space. Even now, Earth is probably the only place in our solar system fit for life: any water on Venus and Mercury would become steam, any on Mars or on more distant planets would freeze.
How sunlight is created
The Sun has no sharply defined surface like that of the Earth because it is too hot to be anything but gas. Rather, what appears to us as the surface is a layer in the Sun’s atmosphere, the “photosphere” (sphere of light) which emits light (“radiates”) because of its high temperature.
All hot substances radiate light, either the visible kind or beyond the rainbow spectrum, in the “infrared” (IR; “below red”) and “ultraviolet” (UV; “above violet”) ranges. This glow [called “black body radiation” by physicists–the glow of a body with no color of its own]is the way a red-hot piece of iron or the filament in an electric light bulb produce light. The hotter the object, the brighter it shines, and the further away from red is its color. Conversely, the color of a hot object (if it is dense) tells us how hot it is. In the case of the Sun, the color of the photosphere suggests a temperature of 5780 degrees Kelvin (degrees Celsius measured from the absolute zero, about 5500° C.)
Heating the Earth
Sunlight carries energy, which warms up the Earth and is the driving force behind all our weather and climate. As the ground is heated by sunlight, it begins to radiate, but being too cool to radiate even a dull red, its radiation is in the infra-red range. A hot pot or a hot laundry iron also radiates IR, and your hand can easily sense that radiation (as heat) if held close without touching.
Because the ground is nowhere as hot as the Sun, its emission is also much weaker. However, at any location the ground sends out radiation in all directions in the half-sky that is visible, while receiving radiation only from the small solar disk, covering only a small circle in the sky, 0.5 degrees across. Because of this, the total energy any area receives should be equal to the total energy it returns back to space.
Think it over! If all of Earth’s heat comes from the outside (neglecting internal heat), and if it maintains a steady temperature, no other way exists. Of course, only the average temperature is steady. Actually, the ground is heated only in the daytime, but radiates back day and night, so nights, when energy only goes out and hardly any comes in, are cooler than days.
The “Greenhouse Effect”
The actual flow of heat is complicated by the atmosphere, which has three strong effects:
- Clouds in the atmosphere reflect some of the sunlight before it reaches the ground, reducing the heating of the ground. This process, hard to estimate, has been monitored by measuring “earthshine”, the faint glow from the dark part of the Moon when only a thin crescent is visible.
- The atmosphere absorbs the infra-red (IR) light radiated from the ground and thus delays the escape of heat to outer space, keeping the ground warmer than it would otherwise be.
- Air can flow, and thus carry its heat from one place to another. That is what produces our weather.
The 3rd process is discussed further below. It is a big subject–made even bigger by the influence of water vapor, which produces rain, hurricanes and other interesting phenomena–and two additional sections are also devoted to it, starting here, and also one (written later) stressing the energy exchange processes.
The second process (which keeps us warmer) is stronger than the first (which reduces warming), so the net effect is that as a blanket, the atmosphere helps keep Earth warmer than it would be otherwise. This is called the “greenhouse effect,” because the same process operates in greenhouses used for growing vegetables in cold climates. A greenhouse is enclosed and roofed by glass panes, which let sunlight enter, but absorb the IR emitted back by the ground, and thus keep the greenhouse warm.
The chief absorbers of IR in the atmosphere are not nitrogen and oxygen, the main constituents of air, but a relatively minor percentage of “greenhouse gases” such as water vapor (H2O), carbon dioxide (CO2) and methane (CH4), which are strong absorbers of IR.
Another molecule, responsible for an important effect even though only a very small amount of it is present, is ozone, a variant of the oxygen molecule–O3 rather than the usual O2. It is produced at high altitudes by the action of sunlight on ordinary oxygen and its peak concentration is around 25 kilometers. It is also a greenhouse gas, but more importantly, it absorbs the Sun’s ultra-violet (UV) light, which can cause skin burns and hurt eyes. The ozone found near the ground and forming part of the urban air pollution comes from a completely different process.
High altitude ozone is destroyed by the presence of chlorine, and recently attention has been drawn to ozone removal by chlorine produced by escaping refrigerant gases, of the types preferred until recently for use in air conditioners, refrigerators, aerosol cans and also some industrial applications. These gases are very, very stable, and can persist in the atmosphere for many years. Unfortunately, sooner or later their molecules wander into the stratosphere, where the ultra-violet sunlight is capable of breaking them up and releasing chlorine. Because of the damage from these gases to the ozone layer, their use is being phased out.
The greenhouse effect helps keep Earth at temperatures comfortable for life, but that is a finely balanced situation. In the last half-century, the burning of fossil fuels–coal and oil– has steadily increased the atmospheric content of CO2. The average temperature of the Earth has also risen, and this rise is believed to be due to the added CO2.
Weather
By absorbing infra-red (as well as by its contact with the hot ground), air heats up. As hot air expands, each cubic meter (or cubic foot) of it weighs less than before heating. Where the heating is most pronounced, the warm air is more buoyant than the cooler air surrounding it, and tends to float upwards: soaring birds and glider pilots seek such “thermal currents” and allow themselves to be carried upwards by them. This buoyancy is the basic process responsible for weather.
Rising air expands, and expansion of gas cools it down, which is why mountaintops are cooler. Ultimately, a height is reached where not enough air remains on top to stop the IR radiation from escaping to space. The air then cools by radiation and stops rising, producing a relatively stable layer of the atmosphere known as the stratosphere. As one goes up in the stratosphere, air actually gets warmer from the absorption of ultra-violet light by ozone, and this extra heating keeps it even more stable.
Just below the boundary of the stratosphere (“tropopause”), air which has cooled is forced down again by warmer air rising from below. The result is a circulation of air, rising hot and returning cold, going around, again and again, a motion known as convection. On a cold winter day, such convection also occurs in homes: near poorly insulated windows the air cools and descends (as the flame of a candle will show–but careful with that fire!), while further inside the room it rises again. The region between the ground and the stratosphere where convection and weather take place is known as the troposphere.
Sunlight also evaporates water–from the oceans, from lakes and rivers and from green plants. Energy is invested in turning liquid water into vapor, and therefore humid air has more energy stored in it than dry air.
The capacity of air to hold water vapor depends strongly on temperature and is smaller in cold air (just as less sugar can dissolve in cold water). As warm humid air rises, it expands and cools, and since it then cannot hold as much water as before, the excess is forced out: Initially into the tiny droplets of clouds, then if the cooling is more drastic, into raindrops.
The remaining air is drier and warmer–warmed by water vapor turning back to liquid and returning energy to its surroundings–and warmer air is better able to radiate its heat into space. That is how water, clouds, and rain play a major role in the transport of solar heat from the ground back to space and help create the complex patterns of weather and climate.
July 2019: How fast is the Earth moving?
Earth is the fifth largest of the planets in the solar system, one of four terrestrial planets, (Mercury, Venus and Mars being the others) that is rocky at the surface. It is the third planet from the sun and the only one known to support an atmosphere with free oxygen, oceans of liquid water on the surface and — the big one — life. The existence of water in its liquid phase on Earth is due to the temperature span that exists here: 0 – 100 degrees Celsius. Water boils at 100 degrees Celsius, thus converting it into gas and making it unusable for consumption by living beings including humans, animals, and birds, etc. Earth is the only place in the solar system where water can be present in all the three states – solid, liquid and gas.
Earth travels around the Sun at an average velocity of 107,182 kilometers (about 67,000 miles) per hour. At the same time it is also spinning with enormous speed: rotating once every 23 hours, 56 minutes and 4.09053 seconds (called the sidereal period) and its circumference is roughly 40,075 kilometers. Thus, the surface of the Earth at the equator moves at a speed of 460 meters per second–or roughly 1,000 miles per hour. Rockets are often launched from near equatorial latitudes and in the direction of this rotation to take advantage of the extra boost of speed.
Continuing this thought, our solar system–Earth and all–whirls around the center of our galaxy at some 220 kilometers per second, or 490,000 miles per hour. As we consider increasingly large size scales, the speeds involved become absolutely huge! The galaxies in our neighborhood are also rushing at a speed of nearly 1,000 kilometers per second towards a structure called the Great Attractor, a region of space roughly 150 million light-years (one light year is about six trillion miles) away from us. This Great Attractor, having a mass 100 quadrillion times greater than our sun and span of 500 million light-years, is made of both the visible matter that we can see along with the so-called dark matter that we cannot see.
Each of the motions described above were given relative to some structure. Our motion about our sun was described relative to our sun, while the motion of our local group of galaxies was described as toward the Great Attractor. The question arises: Is there some universal frame of reference relative to which we can define the motions of all things? The answer may have been provided by the Cosmic Background Explorer (COBE) satellite.
In 1989, the COBE satellite was placed in orbit about the Earth (again, the Earth is the frame of reference!) to measure the long-diluted radiation echo of the birth of our universe. This radiation, which remains from the immensely hot and dense primordial fireball that was our early universe, is known as the cosmic microwave background radiation (CBR). The CBR presently pervades all of space. It is the equivalent of the entire universe “glowing with heat.”
One of COBE’s discoveries was that the Earth was moving with respect to this CBR with a well-defined speed and direction. Because the CBR permeates all space, we can finally answer the question “how fast is the earth moving?” using the CBR as the frame of reference. The earth is moving with respect to the CBR at a speed of 390 kilometers per second. We can also specify the direction relative to the CBR. It is more fun, though, to look up into the night sky and find the constellation known as Leo (the Lion). The Earth is moving toward Leo at the dizzying speed of 390 kilometers per second. It is fortunate that we won’t hit anything out there during any of our lifetimes!
(Thanks and attribution to Dr. Rhett Herman, a physics professor at Radford University in Virginia, for much of the above. )
June 2019: Distances in space.
We measure distances on earth using convenient, mutually acceptable standards such as yards, miles, meters or kilometers.
But the distances in space are so immense that more suitable standards must be adopted. One of these is the AU (Astronomical Unit). An AU represents the mean distance between the Earth and our sun, or more precisely, between the center of the earth and the center of the sun, or approximately 93 million miles (150 million km). The qualifier “mean” recognizes that Earth’s orbit around the sun isn’t a perfect circle, so the distance from the sun changes throughout the year. Averaging the maximum and minimum distances yields the mean AU: 92,955,807 miles (42,597,871 kilometers).
The AU then becomes a convenient standard for measuring distances of planets and objects within our solar system, as follows:
Mean distance from sun to each planet, in AU.
Mercury: 0.387 AU
Venus: 0.723 AU
Earth: 1.000 AU
Mars: 1.524 AU
Jupiter: 5.203 AU
Saturn: 9.582 AU
Uranus: 19.201 AU
Neptune: 30.047 AU
Mean distance from the sun to some dwarf planets and other distant objects, in AU.
Ceres: 2.767 AU
Kuiper Belt: 30 to 55 AU
Pluto: 39.53 AU
Eris: 67.958 AU
Sedna: 518.57 AU
But some objects (including one that originated on earth: Voyager 1, launched on September 5, 1977) are so far away that even the AU is too small for convenient measurement:
Oort Cloud: 5,000 to 100,000 AU
Farthest spacecraft: Voyager 1: 141,000 AU (as of February 2018)
Andromeda Galaxy: 16,000,000,000 AU
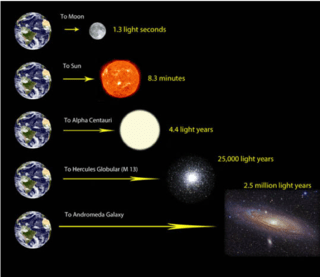
These objects are so remote that astronomers speak of their distances not in terms of kilometers, miles or even AU’s – but of light-years. Light, at 186,262 miles per second, is the fastest-moving stuff in the universe. But If we were to simply express light-years as miles or kilometers per hour or second, we again end up with impossibly large numbers (a light year = 5,879,000,000,000 (trillion) miles or 63,240 AU), so 20th century astronomer Robert Burnham, Jr. – author of Burnham’s Celestial Handbook – devised an ingenious way to portray the distance of one light-year and ultimately of expressing the distance scale of the universe, in understandable terms. He did this by relating the light-year to the astronomical unit – the Earth-sun distance. Since one AU equals about 93 million miles (150 million km) it can be said that one astronomical unit is a bit more than 8 light-minutes in distance, small enough when measuring our proximity to the sun, and convenient for many objects in our solar system and for nearby stars, but once again running into enormous numbers for objects farther away in what is called Deep Space:
Nearby stars: Light years
Alpha Centauri 4.3
Bernard’s star 6.0
Wolf 359 7.7
Sirius 8.6
Ross 154 9.4
Altair 16.6
Vega 26.4
Arcturus 35.8
Milky Way Galaxy
Hyades Star Cluster 150
Betelgeus 309
Pleiades Star Cluster 408
Rigel 913
Crab Nebula 6,000
Star Cluster M13 21,000
Deep Space
Large Magellanic Cloud 163,000
Small Magellanic Cloud 196,000
Andromeda Galaxy 2,357,000
Spiral Galaxy M101 25,000,000
Galaxy M87 54,800,000
Perseus Cluster 239,000,000
Ursa Major Cluster 670,000,000
Quasar C3273 1,900,000,000
Quasar 3C309.1 7,400,000,000
Hubble Radius 15,000,000,000
Thus, when astronomers want to express the truly vast distances of deep space, they tend to speak not of light years but of parsecs. A parsec is a unit of distance equal to about 19 trillion miles (more than 30 trillion km) or 204,301 AU and is more closely related to how astronomers actually go about the business of figuring out the size of the universe. The reason for this can be better understood by a simple demonstration:
To find the distance to a nearby star, astronomers use triangulation. You can try it for yourself, right now. Hold your finger in front of your face, focus on something in the distance, and close first one eye, then the other eye. As you alternate eyes, you’ll notice your finger appears to dance back and forth in front of your face. The motion is, of course, an illusion. Your finger isn’t moving. Each eye sees your finger from a slightly different angle. So the finger’s location, relative to the background, looks different. This apparent shift is called parallax, from a Greek word meaning alternation.
If you measure the angle over which your finger appears to move, you can figure out how far your finger is from your face. Likewise, astronomers measure angles to find the distances to stars. Rather than blink their eyes, however, astronomers move the Earth. Or rather, they use the fact that Earth moves around the sun. One parsec is the distance to an object whose parallax angle is one arcsecond. Don’t be thrown by the terms parallax angle, and arcsecond. Keep reading, and we’ll explain.
If we observe a star in January, and then look at it again in July, the Earth will have gone halfway around its orbit. We’re looking at the star from two locations around 200 million miles (~300 million km) apart. If the star is reasonably close, then – from one side of Earth’s orbit to the other – it will appear to move ever so slightly. Add some trigonometry, and the parallax angle, combined with the size of Earth’s orbit, lets astronomers calculate the distance to the star.
The diagram below illustrates the definition of parallax angle, and also of the word parsec:
These angles are minuscule. They’re too small for degrees to be a practical unit of measurement. That’s why parallax angles are typically measured in arcseconds – a unit of measurement equivalent to the width of an average human hair seen from 65 feet (20 meters) away – not degrees. There are 3,600 arcseconds in one degree.
And here’s how we arrive at parsecs as a unit of distance: one parsec is the distance to an object whose parallax angle is one arcsecond.
The term parsec is just over 100 years old. It first appeared in a 1913 paper by English astronomer Sir Frank Watson Dyson, and the term stuck. If you see a star with 1/2 arcsecond of parallax, it is two parsecs away. At 1/3 arcsecond, it is three parsecs away. And so on. One parsec is approximately 19 trillion miles (30 trillion km). That’s a bit over three light-years. The Voyager 1 probe, launched in 1977, is the most distant manmade object from Earth. It is a mere six ten-thousandths of a parsec away. The nearest star to the sun, a small red dwarf named Proxima Centauri, is just over one parsec from us. That is actually fairly typical in our neck of the galaxy – one star for every cubic parsec – but it’s not typical everywhere. In the cores of globular clusters, the density can reach well over a hundred stars per cubic parsec!
The center of the Milky Way galaxy lies just over 8,000 parsecs from us in the direction of the constellation Sagittarius.
The Andromeda Galaxy, the closest spiral galaxy to our own, is nearly 800 kiloparsecs away. A kiloparsec is one thousand parsecs.
At larger scales, astronomers start to talk of megaparsecs and even gigaparsecs. That’s one million and one billion parsecs, respectively. These are generally reserved for the largest structures in existence. The Virgo Cluster, a conglomeration of thousands of galaxies towards which our own Local Group is falling, lies 16 megaparsecs from home. It would take 54 million years to reach it traveling at the speed of light.
Bottom line: One parsec is defined as the distance to a star that shifts by one arcsecond from one side of Earth’s orbit to the other. One parsec is about 30 trillion kilometers or just over three light-years.
(With thanks and attribution to Dr. Christopher Crockett, of UCLA)
Aren’t you glad your daily commute is measured in mere miles, rather than any of these other standards of astronomical distance?
May 2019: 10 Fascinating facts about the moon that aren’t true
- The United States achieved the first lunar landing in 1969.
The Soviet Union landed an unmanned spacecraft in 1966. The United States’ feat was the first manned lunar landing.
- The first words spoken by an earthling on the Moon were by astronaut Neil Armstrong: “That’s one small step for [a] man, one giant leap for mankind”.
The first words spoken from the Moon were actually by astronaut Buzz Aldrin, who immediately after a sensor probe on the LEM (the Lunar Excursion Module in which they were riding) touched the moon’s surface said: “Contact light”, words from a procedural checklist. The full conversation was as follows:
Buzz Aldrin: “Contact light”.
Neil Armstrong: “Shutdown”
Aldrin: “OK. Engine Stop. ACA out of detent.” (ACA = Attitude Control Assembly)
Armstrong: “Out of Detent. Auto”.
Aldrin: “Mode Control both Auto. Descent Engine Command Override, Off. Engine Arm, Off. 413 is in.”
Charlie Duke (at mission control in Houston): “We copy you down, Eagle.”
Armstrong: “Engine arm is off. Houston, Tranquility Base here. The Eagle has landed.”
The words everyone remembers were from Armstrong more than 6 hours later when he actually stepped onto the lunar surface.
- The Moon is 238,000 miles from the Earth.
Due to the Moon’s elliptical orbit, the distance actually varies from 225,623 to 252,088 miles. The average distance is 238,855.
- The far side of the Moon, the side we can’t see, is dark.
In reality both sides of the Moon see the same amount of sunlight, however, only one face of the Moon is ever seen from Earth. This is because the Moon rotates around on its own axis in exactly the same time it takes to orbit the Earth, meaning the same side is always facing the Earth. The side facing away from Earth has only been seen by the human eye from spacecraft.
- Sound waves travel faster on the Moon because there is no atmosphere to impede them.
Sound waves don’t travel at all because there is no atmosphere to carry them.
- There are four phases of the Moon as seen from the Earth: New Moon, First Quarter, Full Moon, Last Quarter.
There are actually eight phases: New Moon, Waxing Crescent, First Quarter, Waxing Gibbous, Full Moon, Waning Gibbous, Last Quarter, & Waning Crescent.
- The first and last quarter phases (when approximately half of the Moon is visible from Earth) are about half as bright as the full Moon.
If the Moon’s surface were like a perfectly smooth billiard ball, its surface brightness would be the same all over. In such a case, it would indeed appear half as bright. But the moon has a very rough topography. Especially near and along the day/night line (known as the terminator), the lunar landscape appears riddled with innumerable shadows cast by mountains, boulders and even tiny grains of lunar dust. Also, the Moon’s face is splotched with dark regions. The end result is that at first quarter, the Moon appears only one-eleventh as bright as when it’s full. The Moon is actually a little brighter at first quarter than at last quarter, since at that phase some parts of the Moon reflect sunlight better than others.
- Astronauts visiting the Moon used Earth time because the Moon has no time system.
Actually, the Moon does have time zones. Back in 1970, Helbros Watches asked Kenneth L. Franklin, for many years the chief astronomer at New York’s Hayden Planetarium, to design a watch for moonwalkers that measures time in what he called “lunations,” the period it takes the Moon to rotate and revolve around the Earth; each lunation is exactly 29.530589 Earth days. For the Moon, Franklin developed a system he called “lunar mean solar time,” or Lunar Time (LT). He envisioned local lunar time zones similar to the standard time zones of Earth but based on meridians that are 12-degrees wide (analogous to the 15-degree intervals on Earth). “They will be named unambiguously as ’36-degree East Zone time,’ etc., although ‘Copernican time,’ ‘West Tranquility time’ and others may be adopted as convenient”, he explained. A lunar hour was defined as a “lunour,” and decilunours, centilunours and millilunours were also introduced. One Moon watch was sent to the president of the United States at the time, Richard M. Nixon, who sent a thank you note to Franklin. The note and another Moon watch were kept in a display case at the Hayden Planetarium for several years. Quite a few visitors would openly wonder why Nixon was presented with a wristwatch that could be used only on the Moon.
Nearly 50 years have come and gone without the watch becoming a big seller.
- The Moon’s main effects on the Earth are tidal forces and rotational perturbations, both caused by its gravitational pull.
Actually, the Moon has long been recognized as a significant stabilizer of Earth’s orbital axis. Without it, astronomers have predicted that Earth’s tilt could vary as much as 85 degrees. In such a scenario, the sun would swing from being directly over the equator to directly over the poles over the course of a few million years, a change which could result in dramatic climatic shifts. Such shifts have the potential to impact the development of life. Research reveals that fewer than 10 percent of terrestrial planets may have a satellite large enough to provide the stability life needs to develop.
- The Moon orbits the Earth.
Most people think the Moon is, well, a moon, but there is some talk that it should actually be classified as a planet. For one, it’s far too big to be a “true” moon. Being about one-fourth of the diameter of Earth, it is easily the biggest moon in relation to its planet in our solar system. (Pluto has a moon called Charon that is half its diameter in size, but since Pluto isn’t a real planet anymore, it doesn’t count.)Because of its large size, the Moon doesn’t actually orbit Earth at all. Instead, Earth and Moon orbit each other, around a point between them. This point is called a barycenter, and the illusion the Moon is actually orbiting Earth comes from the fact that the barycenter is currently located inside the Earth’s crust. The fact that the barycenter remains inside the Earth is pretty much the only reason Earth and Moon aren’t classified as a twin planet, instead of a planet and its satellite. However, this may change in the future.
Bonus trivia question:
What does Purdue University have to do with the Moon?
It is the alma mater of both the first person to walk on the Moon: Neil Armstrong in 1969; and the last one to do so: Gene Cernan in 1972.
April 2019: Venus is not Earth’s closest neighbor
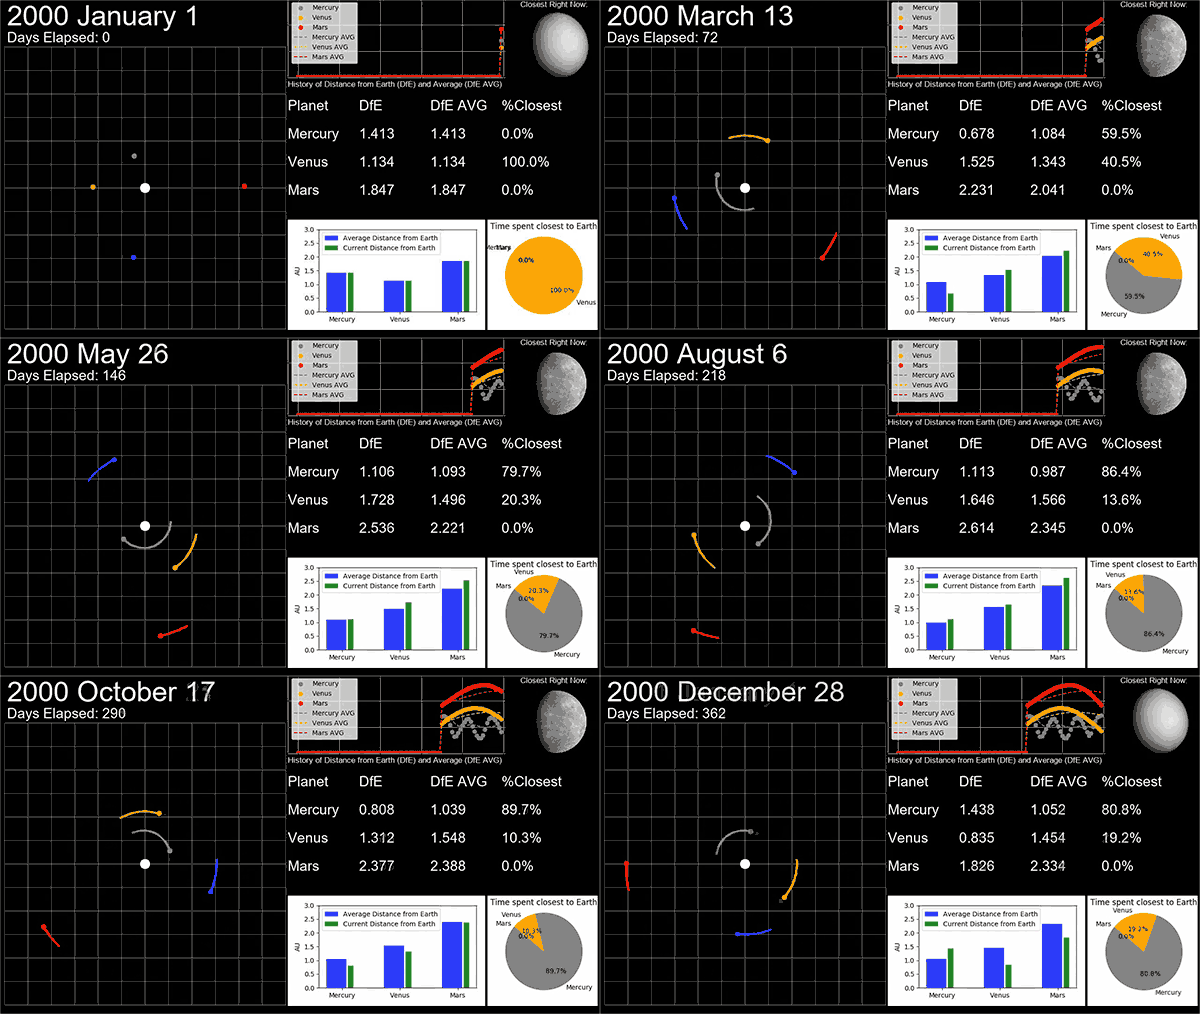
Calculations and simulations confirm that on average, Mercury is the nearest planet to Earth—and to every other planet in the solar system.
Quick: Which planet is closest to Earth? Ask an astronomer or a search engine, and you’ll probably hear that though the situation changes frequently, Venus is the closest when averaged over time. Several educational websites, such as The Planets and Space Dictionary, publish the distance between each pair of planets, and they all show that Venus is nearest to Earth on average. They’re all wrong. NASA literature even tells us Venus is “our closest planetary neighbor,” which is true if we are talking about which planet has the closest approach to Earth but not if we want to know which planet is closest on average.
As it turns out, by some phenomenon of carelessness, ambiguity, or groupthink, science popularizers have disseminated information based on a flawed assumption about the average distance between planets. Using a mathematical method that Physics Today devised, they determine that when averaged over time, Earth’s nearest neighbor is in fact, Mercury.
That correction is relevant to more than just Earth’s neighbors. The solution can be generalized to include any two bodies in roughly circular, concentric, and coplanar orbits. By using a more accurate method for estimating the average distance between two orbiting bodies, we find that this distance is proportional to the relative radius of the inner orbit. In other words, Mercury is closer to Earth, on average, than Venus is because it orbits the Sun more closely. Further, Mercury is the closest neighbor, on average, to each of the other seven planets in the solar system.
Fact provided by Joseph Roser from the Astrophysics Branch.
March 2019: Flash! There is an uncountable number of stars in the known universe.
We basically have no idea how many stars there are in the universe. Right now we use our estimate of how many stars there are in our own galaxy, the Milky Way. We then multiply that number by the best guesstimate of the number of galaxies in the universe.
So how many stars are in the Milky Way? “It’s a surprisingly difficult question to answer”, says David Kornreich, an assistant professor at Ithaca College in New York. You can’t just sit around and count stars, generally, in a galaxy,” The primary way astronomers estimate the number of stars is by determining the galaxy’s mass. The mass is estimated by looking at how the galaxy rotates, as well as its spectrum using spectroscopy. Once a galaxy’s mass is determined, the other tricky thing is figuring out how much of that mass is made of stars. Most of the mass will be made up of dark matter that emits no light but which is believed to make up most of the mass of the universe. You have to model the galaxy and see if you can understand what the percentage of that mass of stars is, says Kornreich. “In a typical galaxy, if you measure its mass by looking at the rotation curve, about 90 percent of that is dark matter.” Further, the size of the stars can vary greatly from something that is the size of our sun, to something dozens of times smaller or bigger. So is there any way to figure out how many stars there are for sure? In the end, it comes down to an estimate. In one calculation, the Milky Way has a mass of about 100 billion solar masses, so it is easiest to translate that to 100 billion stars. This accounts for the stars that would be bigger or smaller than our Sun and averages them out. However, since the mass is tough to calculate, other researchers believe the Milky Way galaxy has a mass of between 400 billion and 700 billion solar masses.
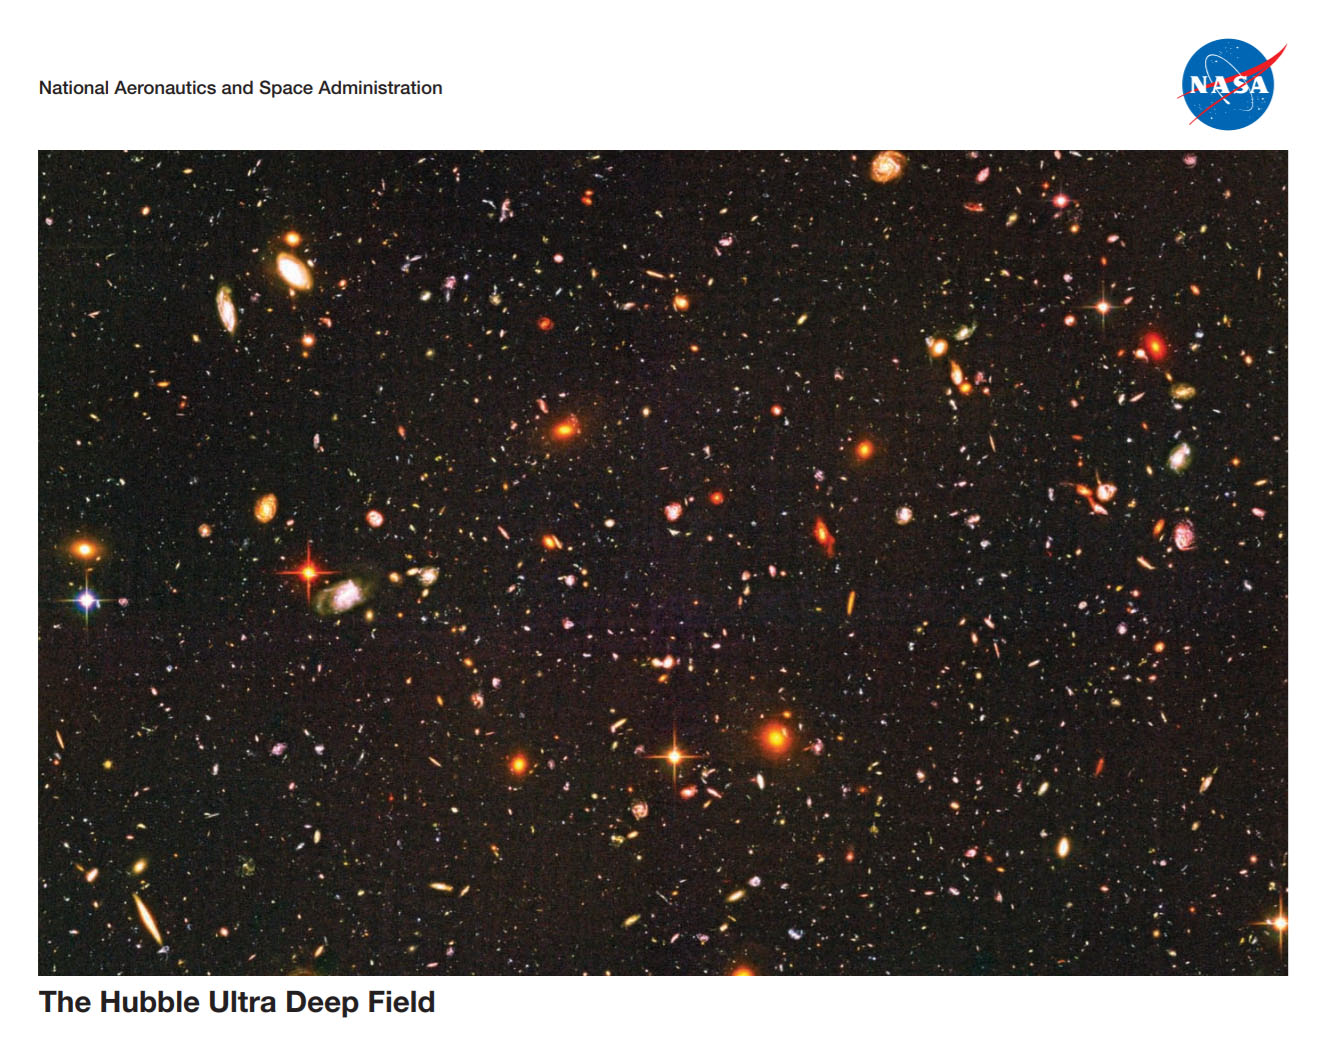
As for galaxies, astronomers have long sought to determine how many there are in the observable universe, the part of the cosmos where light from distant objects has had time to reach us. Over the last 20 years, scientists have used images from the Hubble Space Telescope to estimate that the universe we can see contains around 100 – 200 billion galaxies. Current astronomical technology allows us to study just 10% of these galaxies, and the remaining 90% will only be seen when bigger and better telescopes are developed. Undeterred, an international team of astronomers, led by Christopher Conselice, Professor of Astrophysics at the University of Nottingham, pursued this question by converting pencil beam images of deep space from telescopes around the world, and especially from the Hubble telescope, into 3-D maps. These allowed them to calculate the density of galaxies as well as the volume of one small region of space after another. This painstaking research enabled the team to establish how many galaxies have been missed, much like an intergalactic archaeological dig, and to postulate that the universe contains at least 2 trillion galaxies, ten times more than previously thought.
After all that math, NASA can confidently say that there are zillions of stars in the known universe. (A zillion is any uncountable amount.)
February 2019: Did you know these facts about Mars?
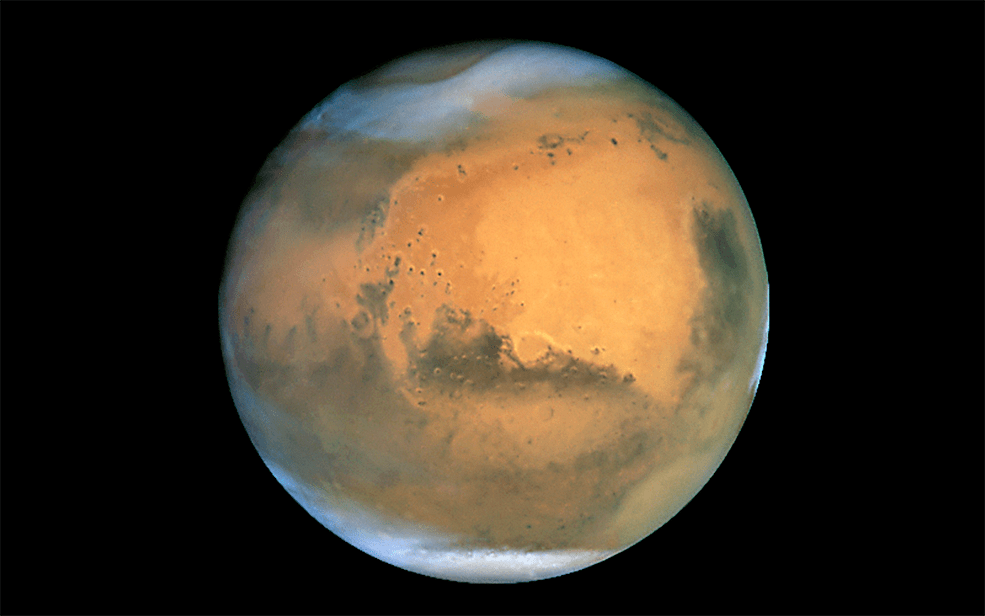
* Mars is home to the tallest mountain in the solar system.
Olympus Mons, a shield volcano, is 21 km (13 miles) high and 600 km (374 miles) in diameter. Despite having formed over billions of years, evidence from volcanic lava flows is so recent many scientists believe it could still be active.
* Mars has the largest dust storms in the solar system.
They can last for months and cover the entire planet. The seasons are extreme because its elliptical (oval-shaped) orbital path around the Sun is more elongated than most other planets in the solar system.
* One day Mars will have a ring.
In the next 20-40 million years Mars’ largest moon Phobos will be torn apart by gravitational forces leading to the creation of a ring that could last up to 100 million years.
* Mars may once have had oceans, but adding them up would give you just 1.5 percent of all water on Earth.
(Facts validated by Chris Mckay, Planetary Systems Branch)
January 2019: Planetary, Stellar and Galactic Orbital Time Scales: Happy New Year 2019!
It takes a little less than 24 hours for Earth to rotate on its axis to make a day, and a little more than 365 days to orbit around the sun for a year. It takes around 230 million years for our solar system to complete a single orbit around the Milky Way. The last time it was in its current position, the earliest dinosaurs had just appeared, and flowering plants wouldn’t evolve for another 100 million years.
(Fact validated by Jeffery Hollingsworth, Planetary Systems Bran

