


E.1 PURPOSE
A system designed for human use or habitation must accommodate the range of human characteristics and capabilities relevant to the system and operating environment for the NASAdefined crew population. The datasets provided include characteristics and capabilities for anthropometric dimensions, range of motion, strength, mass, volume, and surface area. The datasets and their supplemental information take into account human characteristics such as age, sex, and physical condition as well as mission characteristics such as clothing and suit pressurization.
The intent of the technical requirements in Section 4 is to accommodate the entire potential user population, not just meet the criteria in the datasets provided, which provide the most frequently used values. Identification of a design criteria not provided in the tables needs coordination and concurrence from NASA Stakeholders. Each dataset may be tailored by NASA based on program or mission specific criteria. Guidance on the evaluation of design for physical characteristics and capabilities can be found in NASA/TP-2014-218556, Human Integration Design Process (HIDP).
E.2 ANTHROPOMETRIC DIMENSIONS
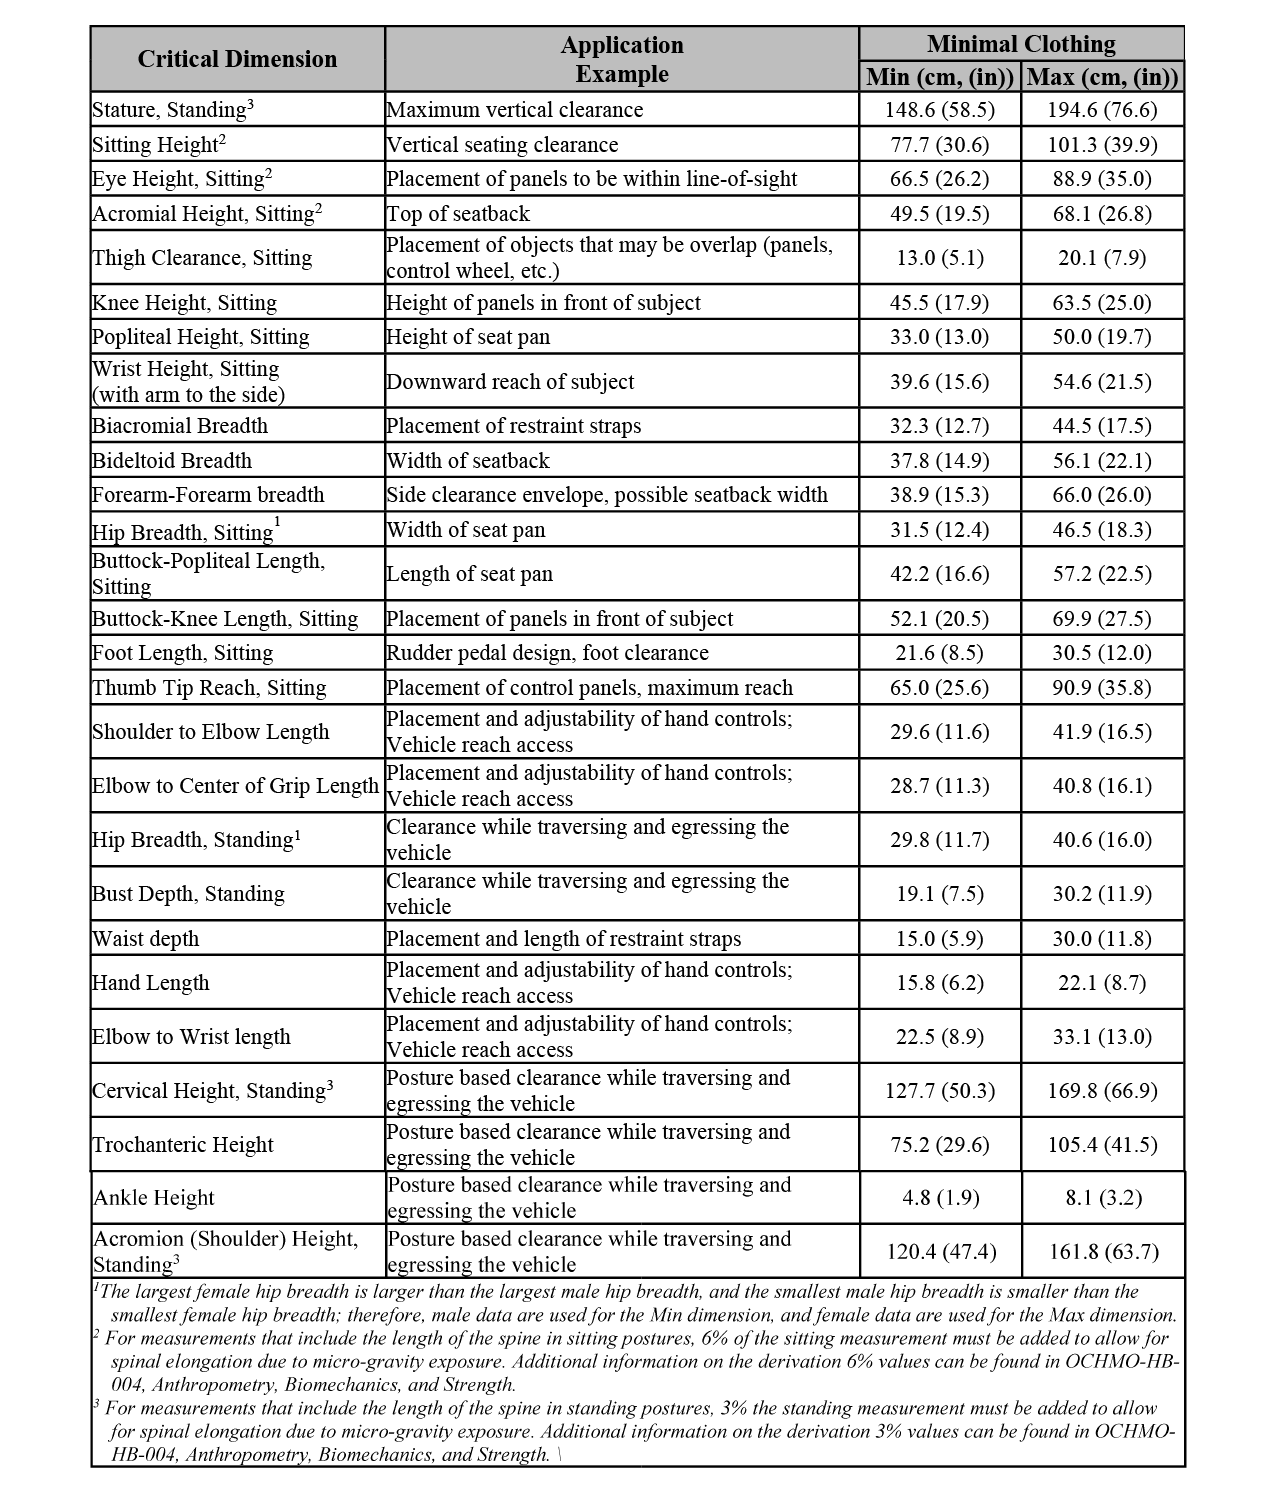
The data in the tables are from the population in the 1988 Anthropometric Survey of US Army Personnel (ANSUR) (ref. Natick/TR-89/044), projected forward by NASA to 2015 to account for the expected small growth in the size of members of the US population. Note that for measurements that include the length of the spine, 3% of stature (for standing measurements) or 6% of seated height (for sitting measurements) must be added to allow for spinal elongation due to micro-gravity exposure. Additional information on the derivation of 3% and 6% values can be found in OCHMO-HB-004, Anthropometry, Biomechanics, and Strength.
These dimensions must be considered in light of garments, space adaptive postures and personal protective equipment that is expected to be used per task, and environmental conditions.
E.2.1 References
Gordon, C.C., Churchill, T., Clauser, C.E., Bradtmiller, B., McConville, J.T., Tebbetts, I., Walker, R.A. (1989). 1988 Anthropometric survey of U.S. army personnel: methods and summary statistics. NATICK/TR-89/044, United States Army Natick Research, Development and Engineering Center, Massachusetts.
Table E.2-1—Anthropometric Dimensions
E.3 RANGE OF MOTION
The ranges of motion to be accommodated for crewmembers were collected in 1 g conditions as part of a 2007/2008 study in the NASA JSC Anthropometry and Biomechanics Facility.
Table E.3-1—Unsuited Range of Motion, provides several joint measures that were present in old versions of this table but were not reinvestigated as a part of the 2007/2008 mobility study. These values are specifically called out when listed in the table.
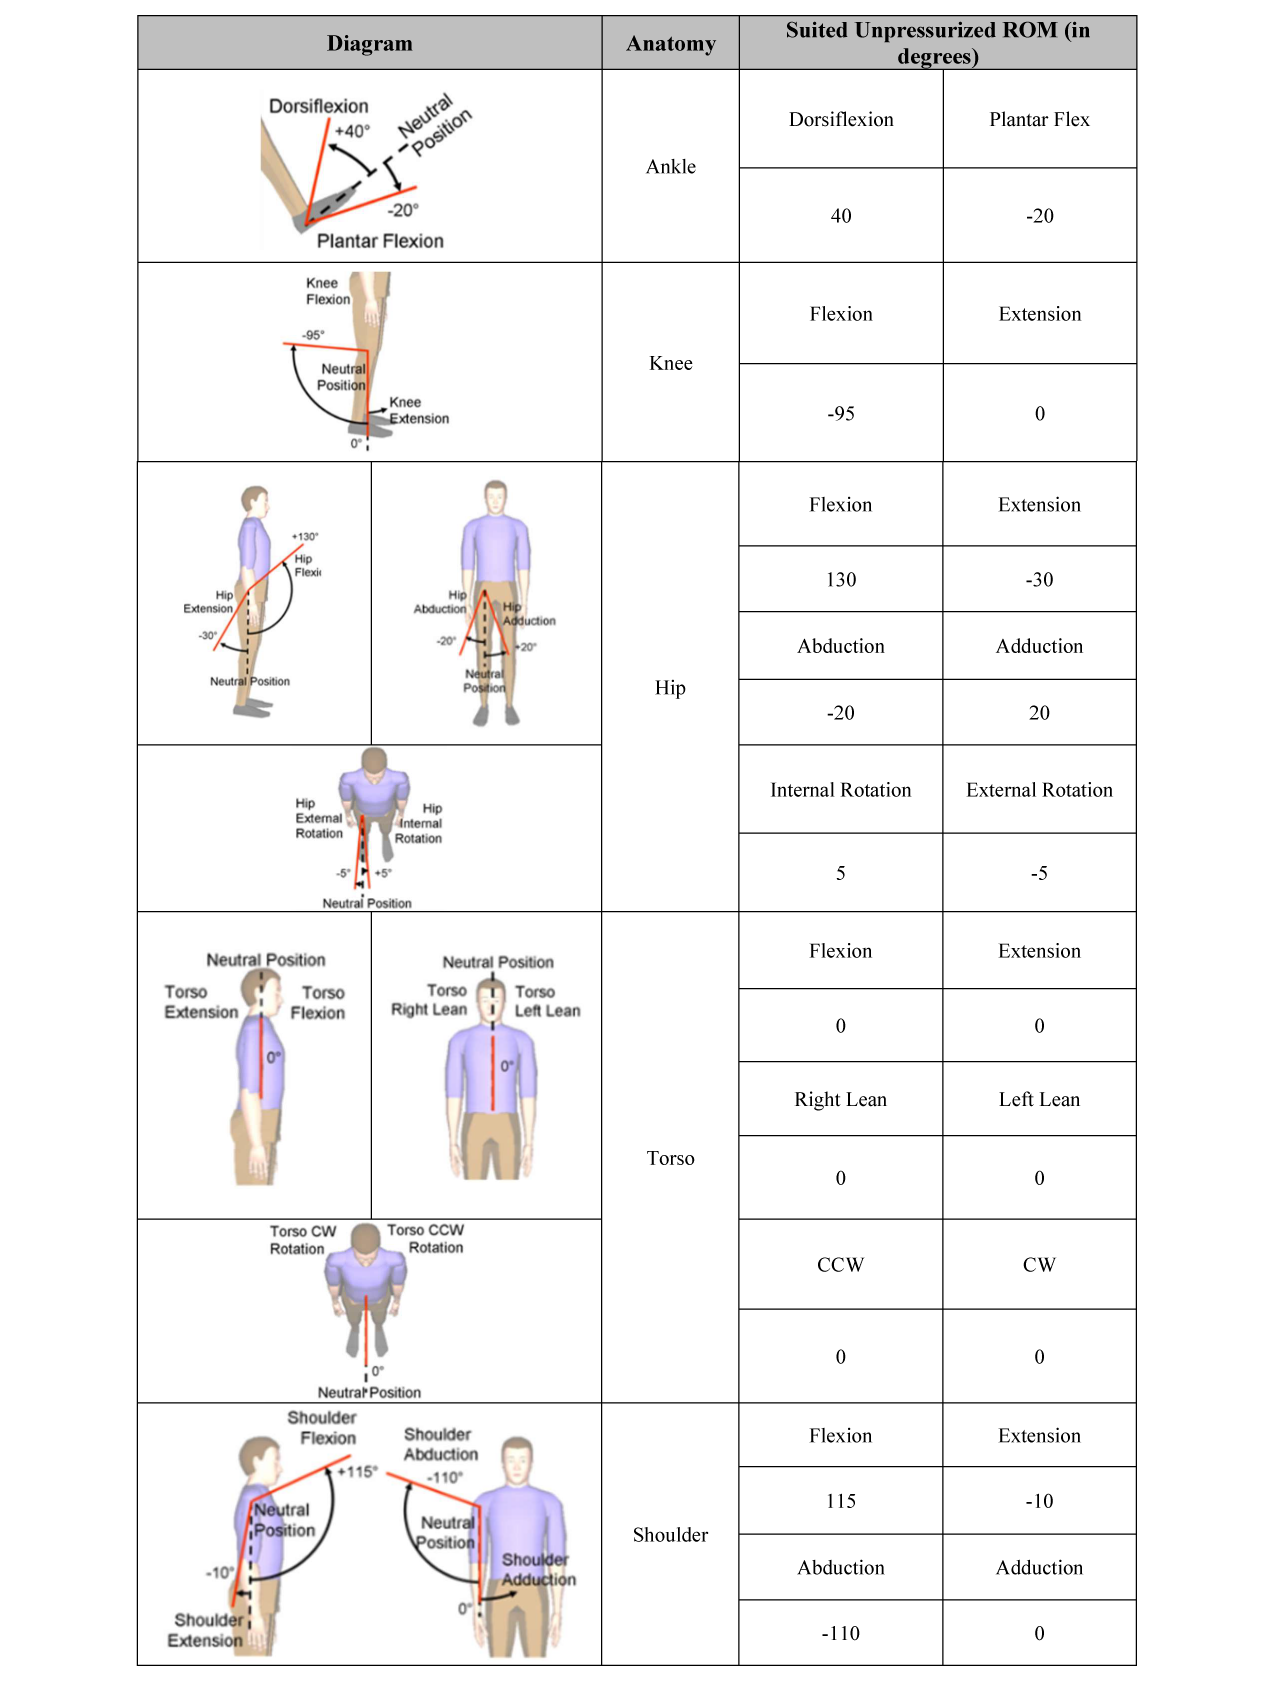
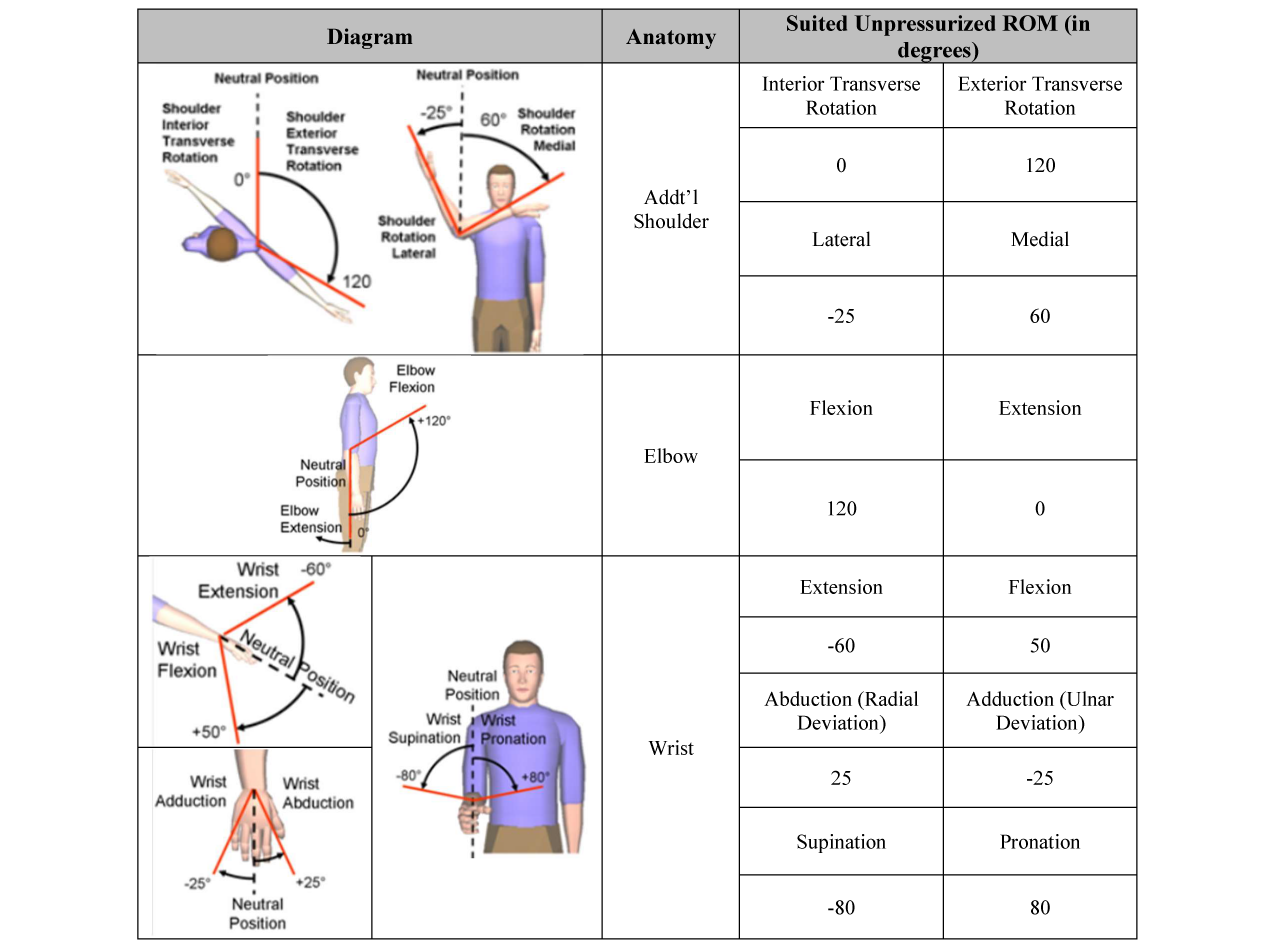
Tables E.3-2 and E.3-3 provide Range of Motion (ROM) for several joint measures under unpressurized and pressurized suit conditions. It should be noted that since pressurization causes severe restrictions to range of motion, no pressurized ROM for a LEA type suit is provided. Hence, pressurized ROM data are applicable only for an EVA type suit. The values represented in these tables show the level of mobility that was needed to perform a variety of relevant functional tasks performed using a hybrid representative EVA suit. These numbers do not necessarily indicate maximum level of mobility possible in a given configuration.
E.3.1 References
“1979 Study” refers to data from SP-2-86L-064 Thornton, W, and Jackson, J. Anthropometric Study of Astronaut Candidates, 1979 to 1980, (Unpublished Data) NASA-JSC.
Table E.3-1—Unsuited Range of Motion
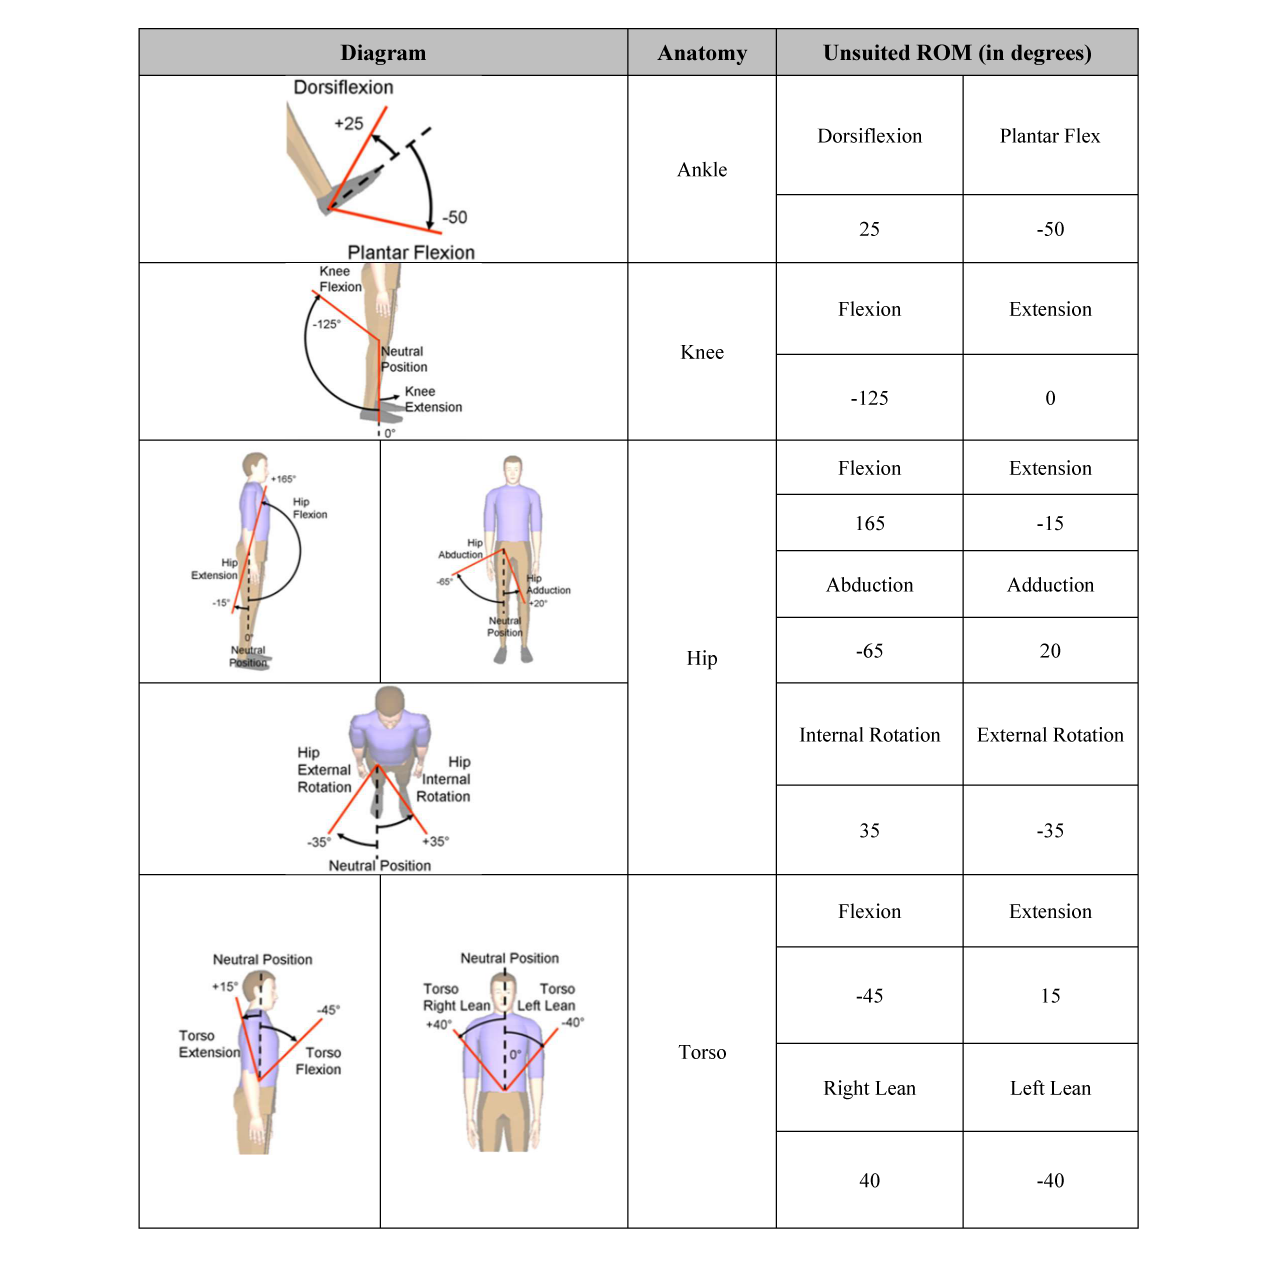
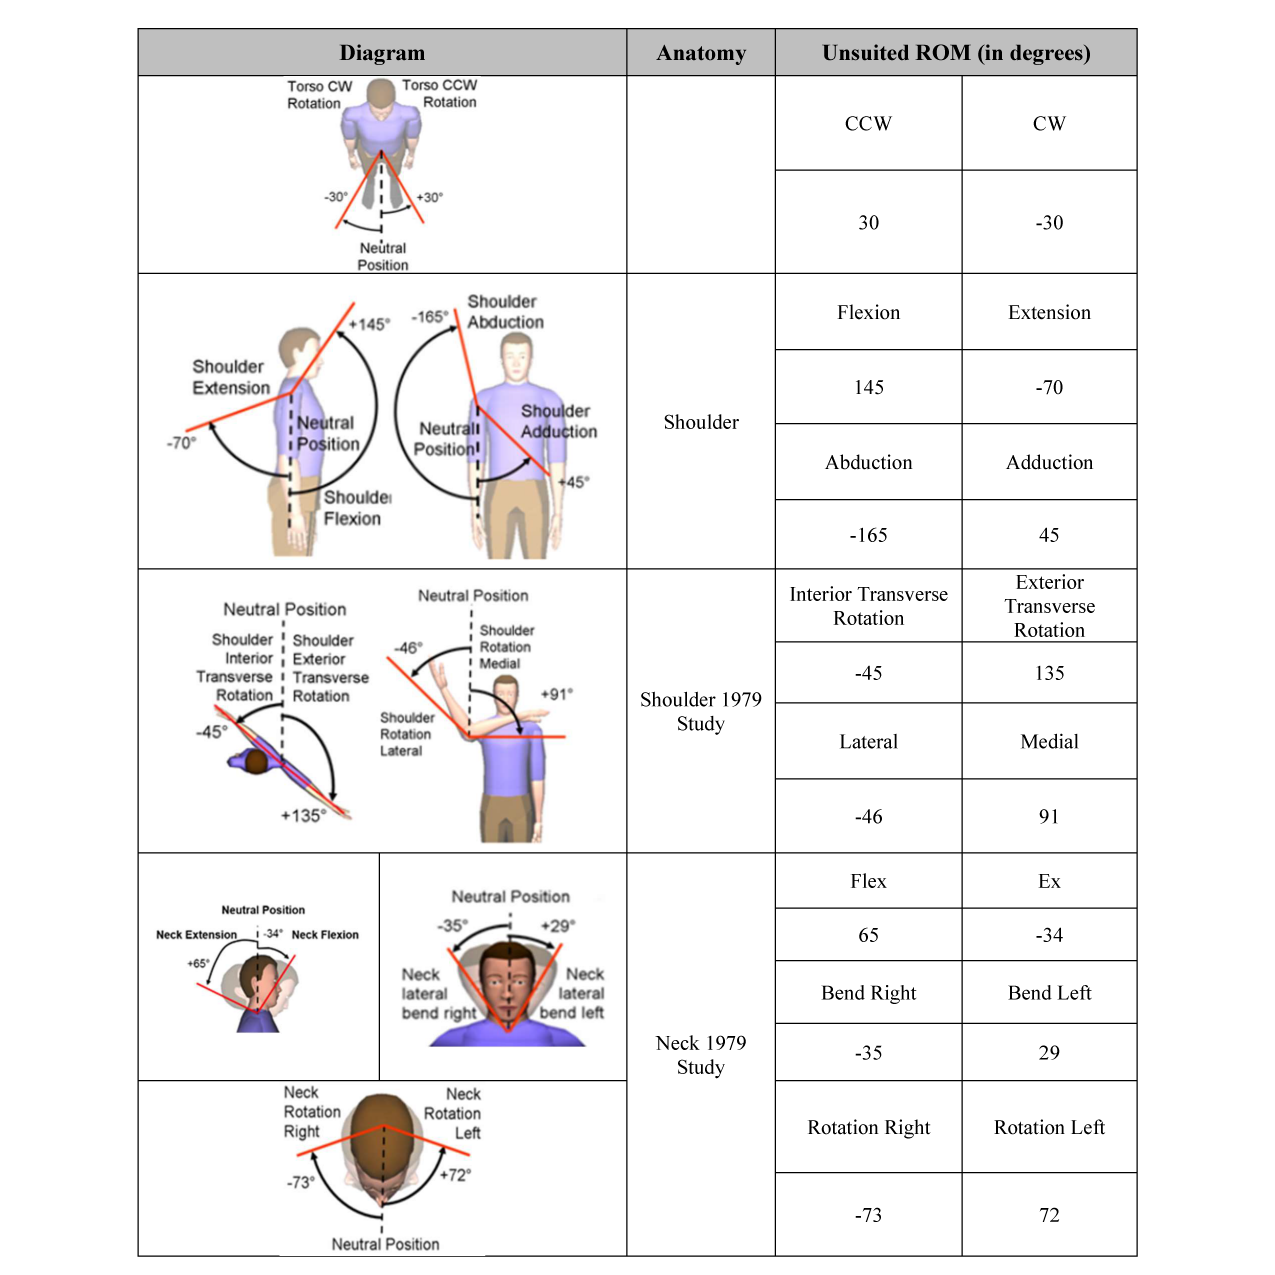
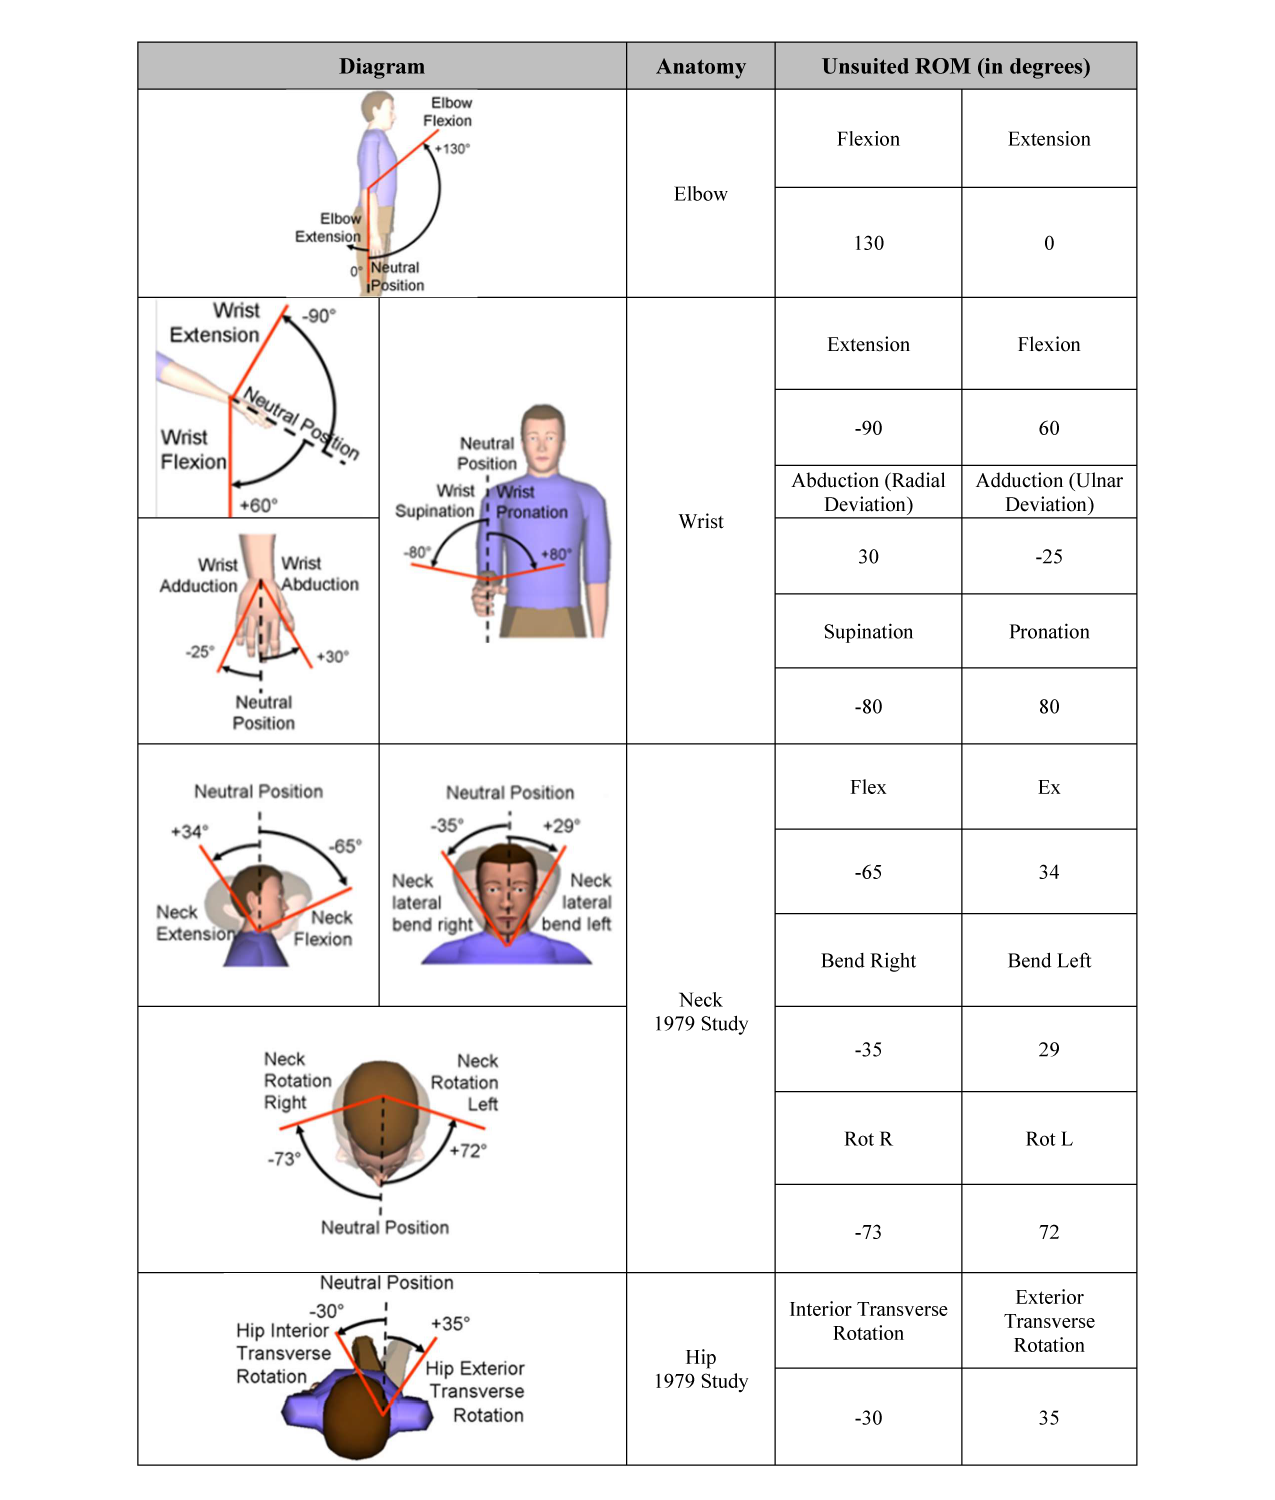
Table E.3-2—Suited/Unpressurized Range of Motion
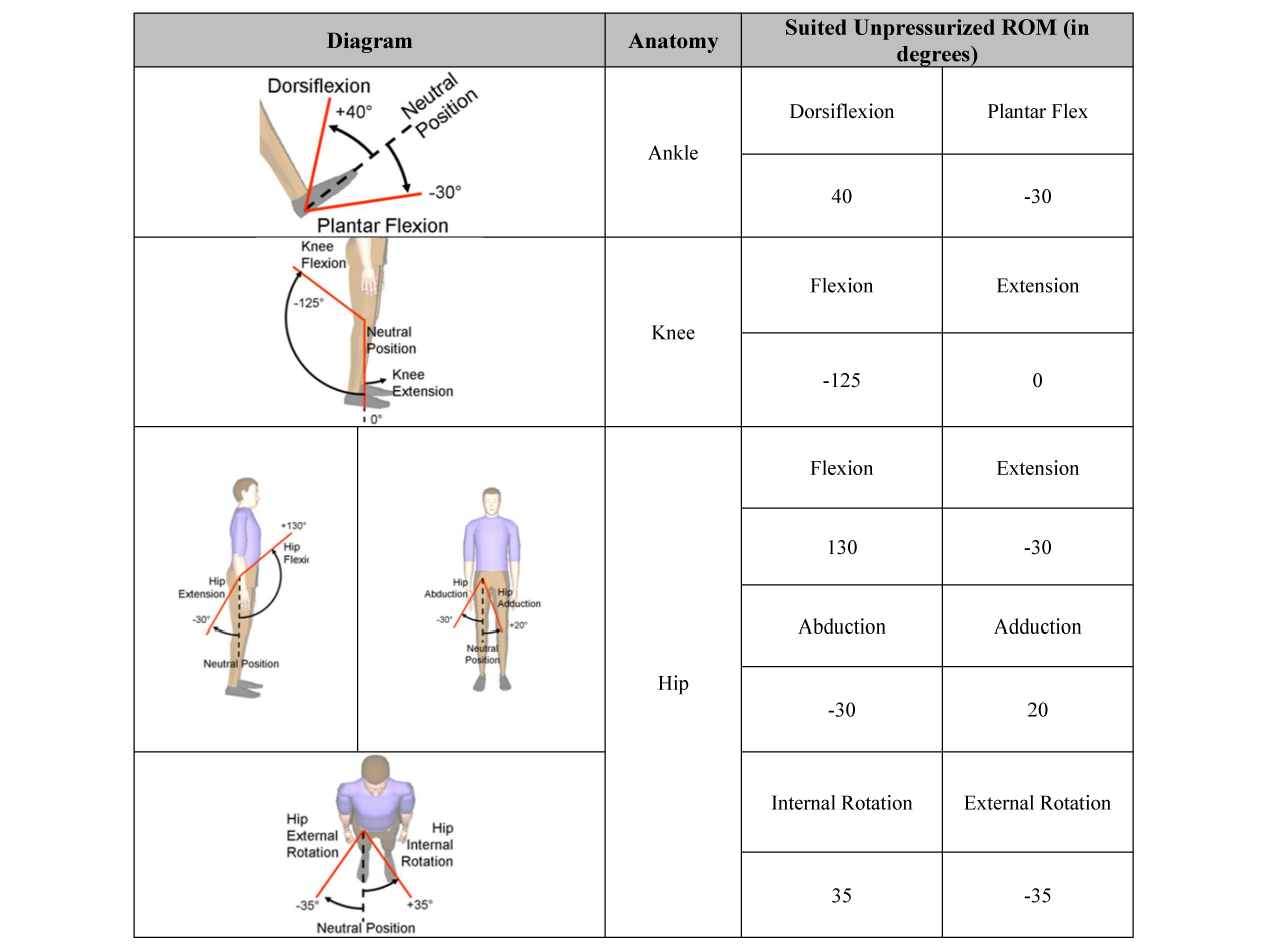
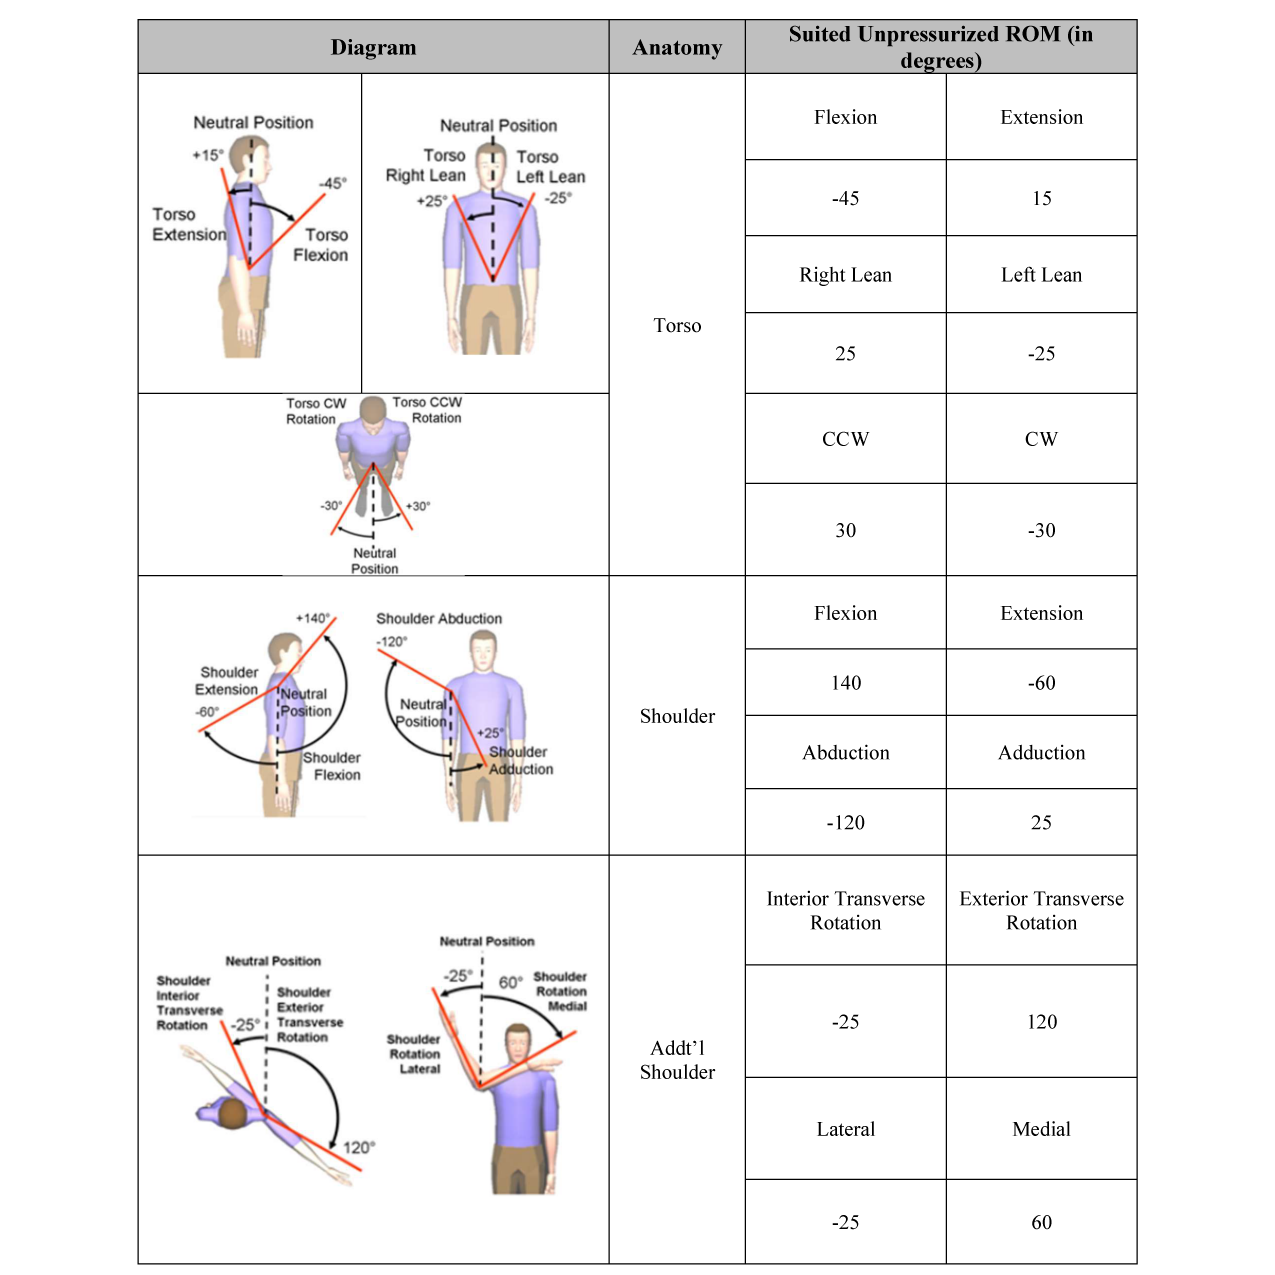
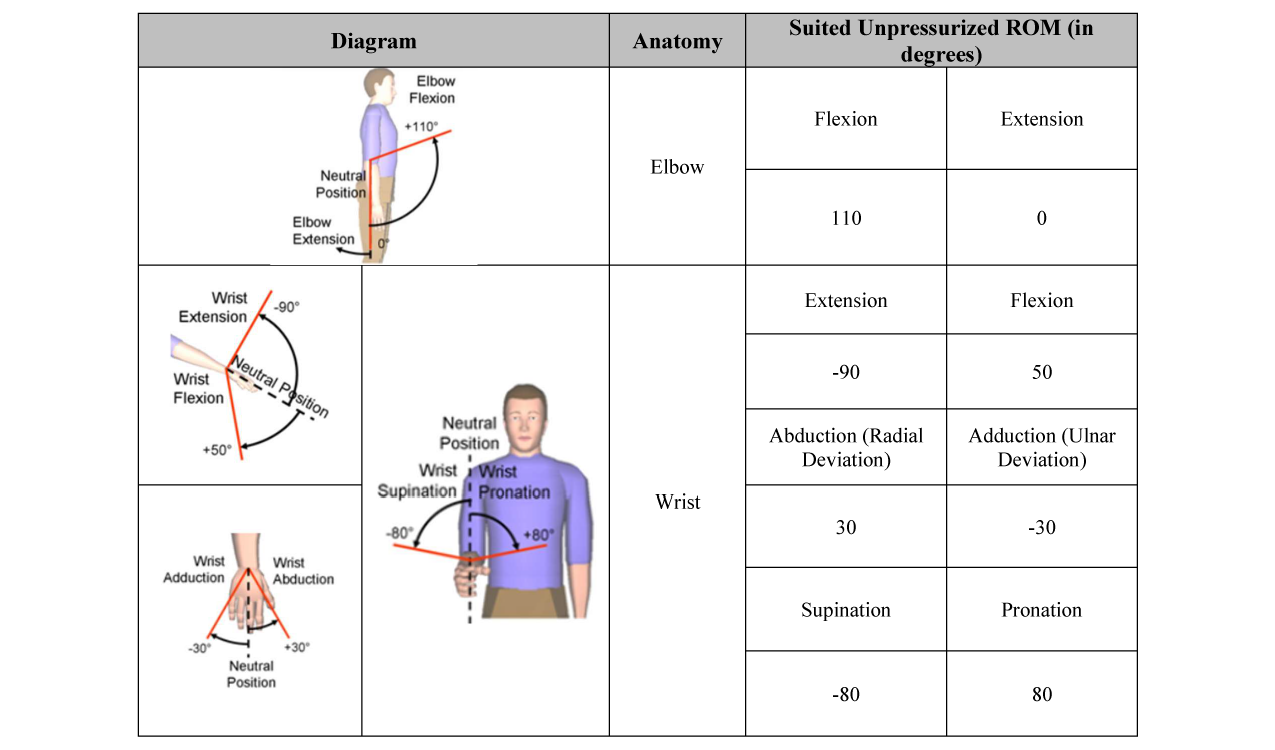
Table E.3-3—Suited/Unpressurized Range of Motion
E.4 BODY SURFACE AREA
Whole body surface areas were computed by using a simple linear regression equation developed by Gehan and George (1970), as applied to the NASA dataset. Anthropometric data within the
NASA dataset is for an age truncated subset of participants from the 1988 Anthropometric Survey of the U.S. Army (ANSUR) projected forward to the year 2015. This database is considered the most representative dataset for the American astronaut population.
Data for all members of the NASA dataset (both male and female) was entered into the equations to calculate whole-body surface areas. From the resulting values, mean and standard deviation for each gender were used to calculate the 1st percentile female and 99th percentile male wholebody surface area values. The 1st percentile value represents the minimum and the 99th percentile value represents the maximum in Table E.4-1—Body Surface Area of a Crewmember.
E.4.1 References
Gehan, E.A., & George, S.L. (1970). Estimation of human body surface area from height and weight. Cancer Chemotherapy Reports, 54, 225-235.
Table E.4-1—Body Surface Area of a Crewmember

E.5 BODY MASS
Crewmember whole-body mass, body-segment mass, center of mass location, and moment of inertia data are provided in Appendix E.5.
The anatomical axis system is based on skeletal landmarks and provides a consistent reference for the principal axes system and the center of volume/mass independent of body-segment orientation as described in McConville et al. (1980) and Young et al. (1983). The principal axis of inertia originates at the center of volume/mass.
Regression equations from McConville et al. (1980) and Young et al. (1983) were used to compute the Body-Segment Properties (BSP); however, because the sample sizes in these two studies were relatively small (31 and 46 subjects, respectively), this document uses data from the ANSUR database for input into the regression equations.
The regression equations from the McConville et al. (1980) and Young et al. (1983) studies were used in their most simple form, which uses only the stature and weight of the subject to calculate the volume and moments of inertia. A Matlab code was written to identify all females with a small stature (based on the female data only) and all males with a large stature (based on the male data only) in the ANSUR database; from this extracted data, the lightest female and heaviest male were identified. These values were then used in the regression equations to compute the BSP. McConville and Young did not generate regression equations to predict all BSP presented in this report; however, presented below is a description and reasoning (based on the available data) of how each BSP presented here was generated.
For tables Whole-Body Mass of Crewmember, Body-Segment Mass Properties for the Male and
Female Crewmember, and Whole-Body Center of Mass Location of the Male and Female Crewmember, minimum values correspond to a small female in mass, and maximum values correspond to a large male in mass, respectively. These values are considered to be representative of those for a small female and a large male crewmember, respectively.
E.5.1 Whole-Body Mass
Regressions equations from the McConville et al. (1980) and Young et al. (1983) studies were used to compute the whole-body volume. Whole-body mass was calculated by assuming the density of the human flesh was homogeneous; a density value of 1 g/cm3 was used. With a value of unity for the density, the mass values are numerically equal to their corresponding volume values.
E.5.2 Whole Body and Segments Center of Mass
Assuming that the human flesh was homogeneous, it can also be assumed that the center of volume is at the center of mass location. McConville et al. (1980) and Young et al. (1983) provided ranges for the location of the center of volume for the male and female, respectively, in each study. Because regression equations were not given for the center of volume, the range values from the McConville et al. (1980) and Young et al. (1983) studies were used here. Specific values for the locations of the center of mass with respect to the anatomical axes were taken from each study to form the range; specifically, the upper range was set by the male upper range, and the lower range was set by the female lower range.
E.5.3 Whole Body Moments of Inertia
Moments of inertia regression equations from the McConville et al. (1980) and Young et al.
(1983) studies were used.
E.5.4 Segment Mass
Regressions equations from the McConville et al. (1980) and Young et al. (1983) studies were used to compute the segment volume. Segment mass was calculated by assuming the density of the human flesh was homogeneous; a density value of 1 g/cm3 was used. With a value of unity for the density, the mass values are numerically equal to their corresponding volume values.
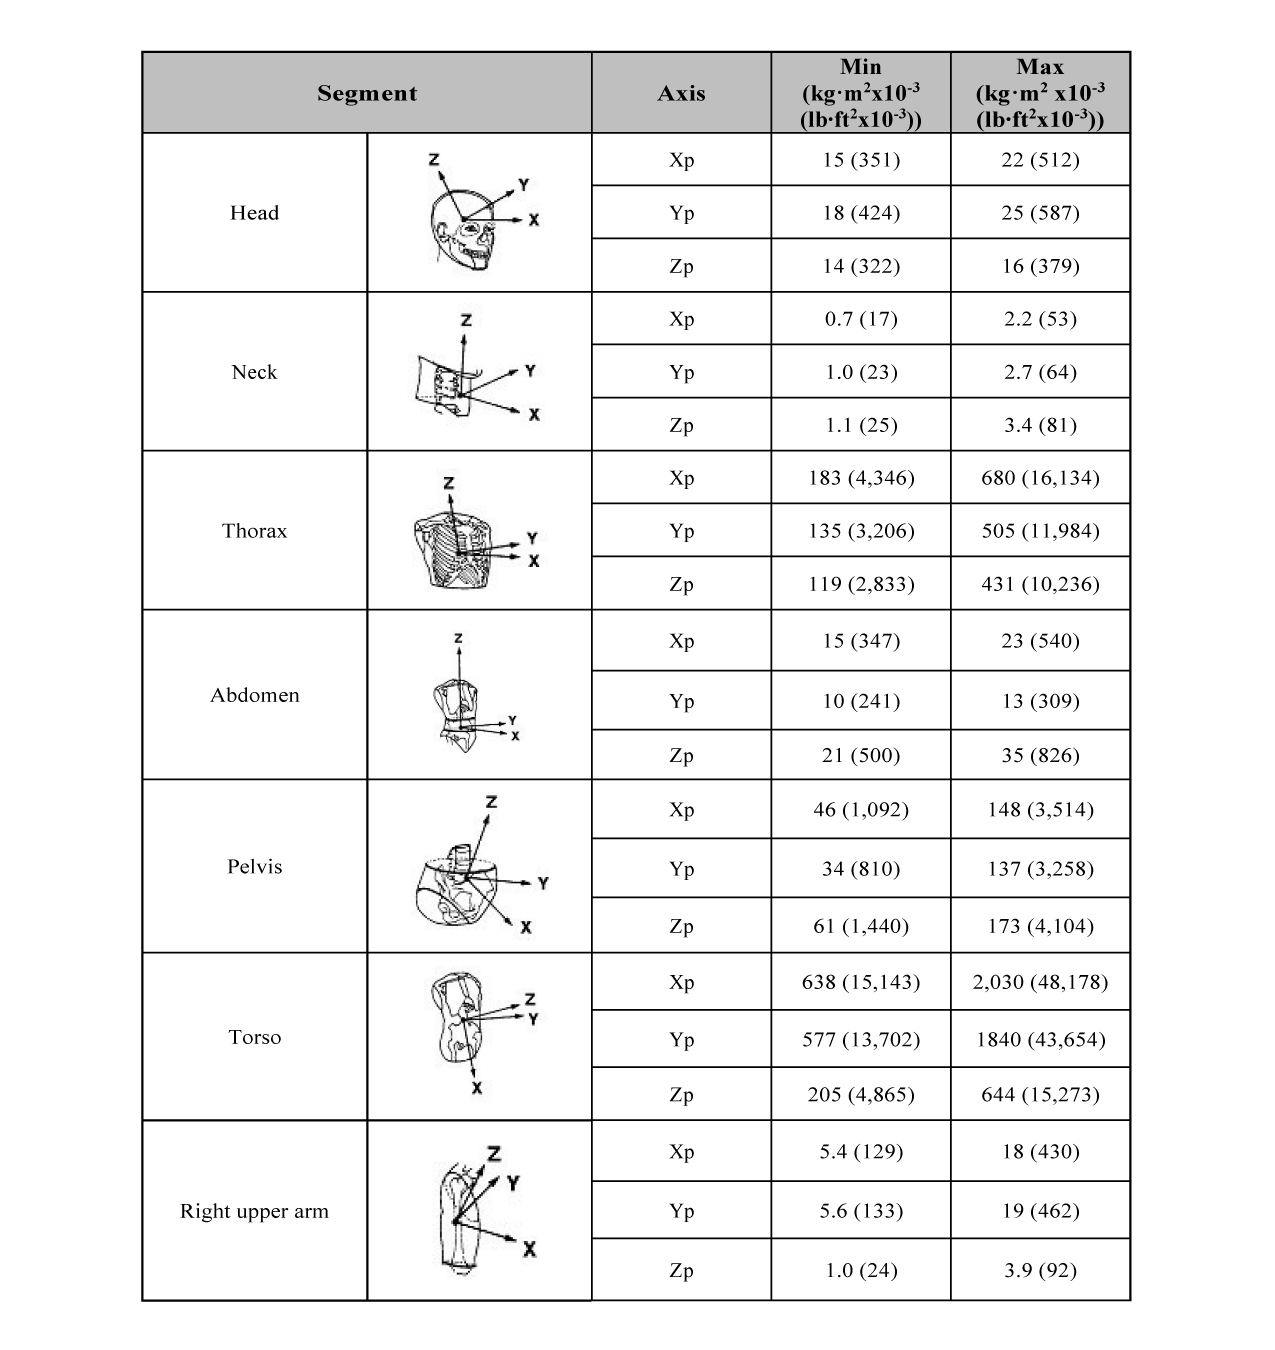
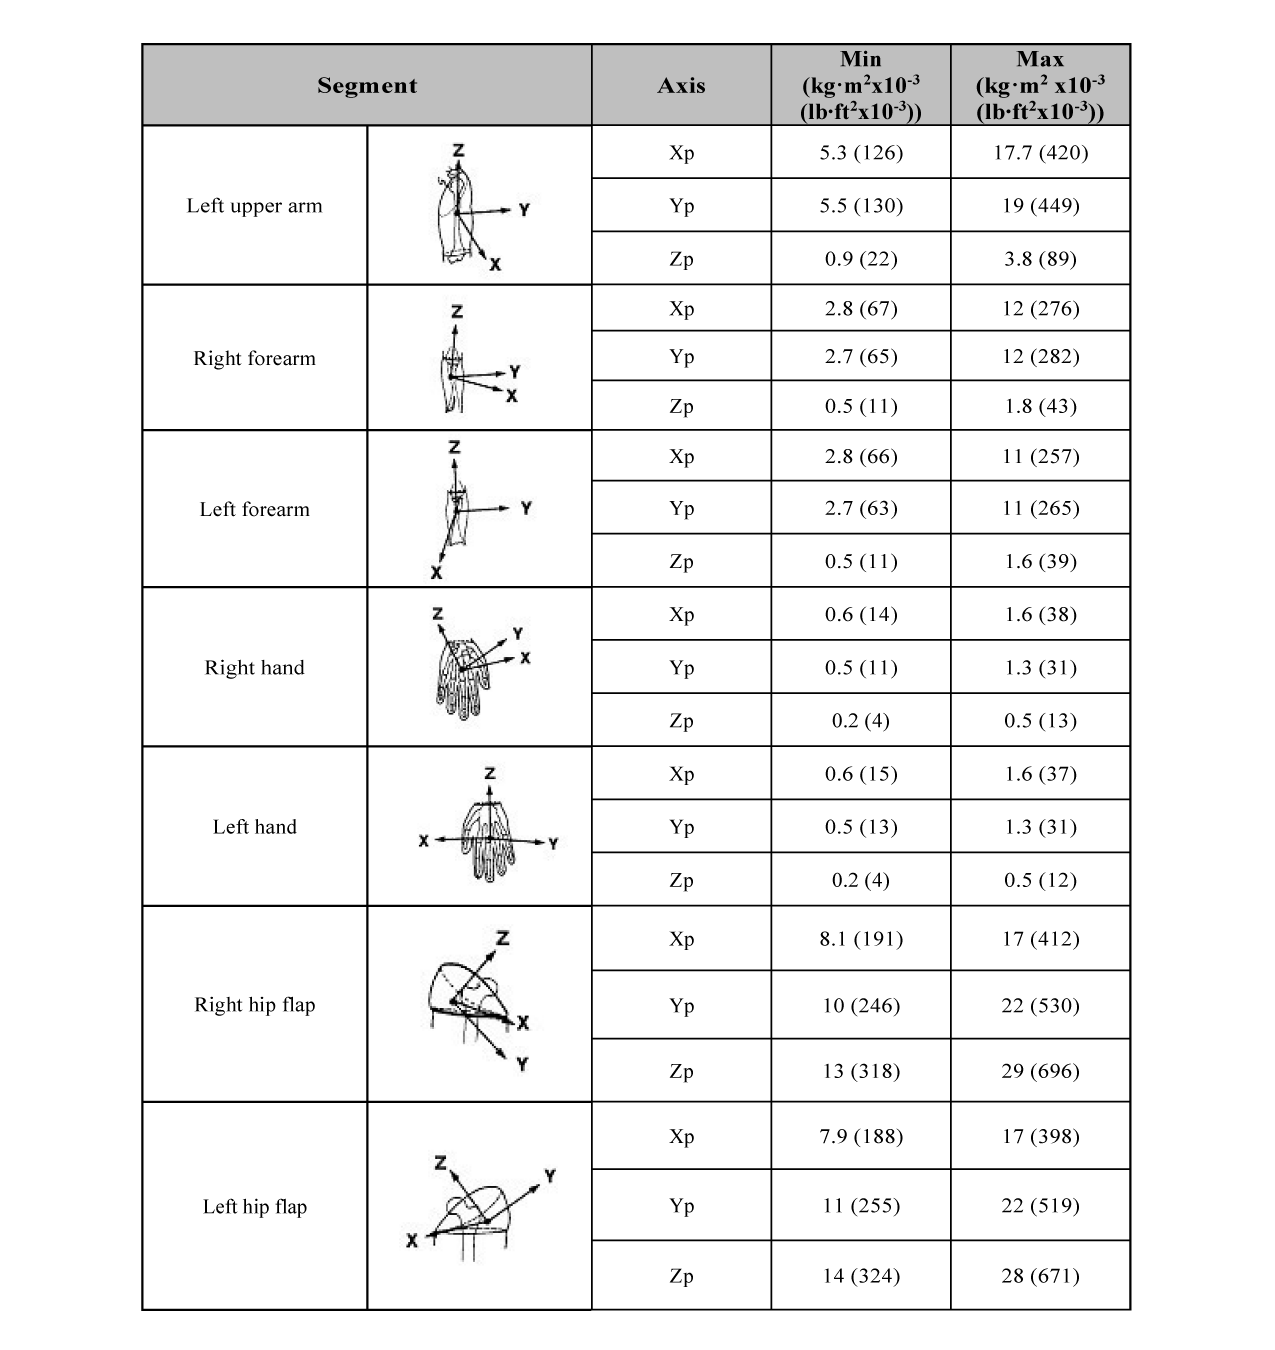
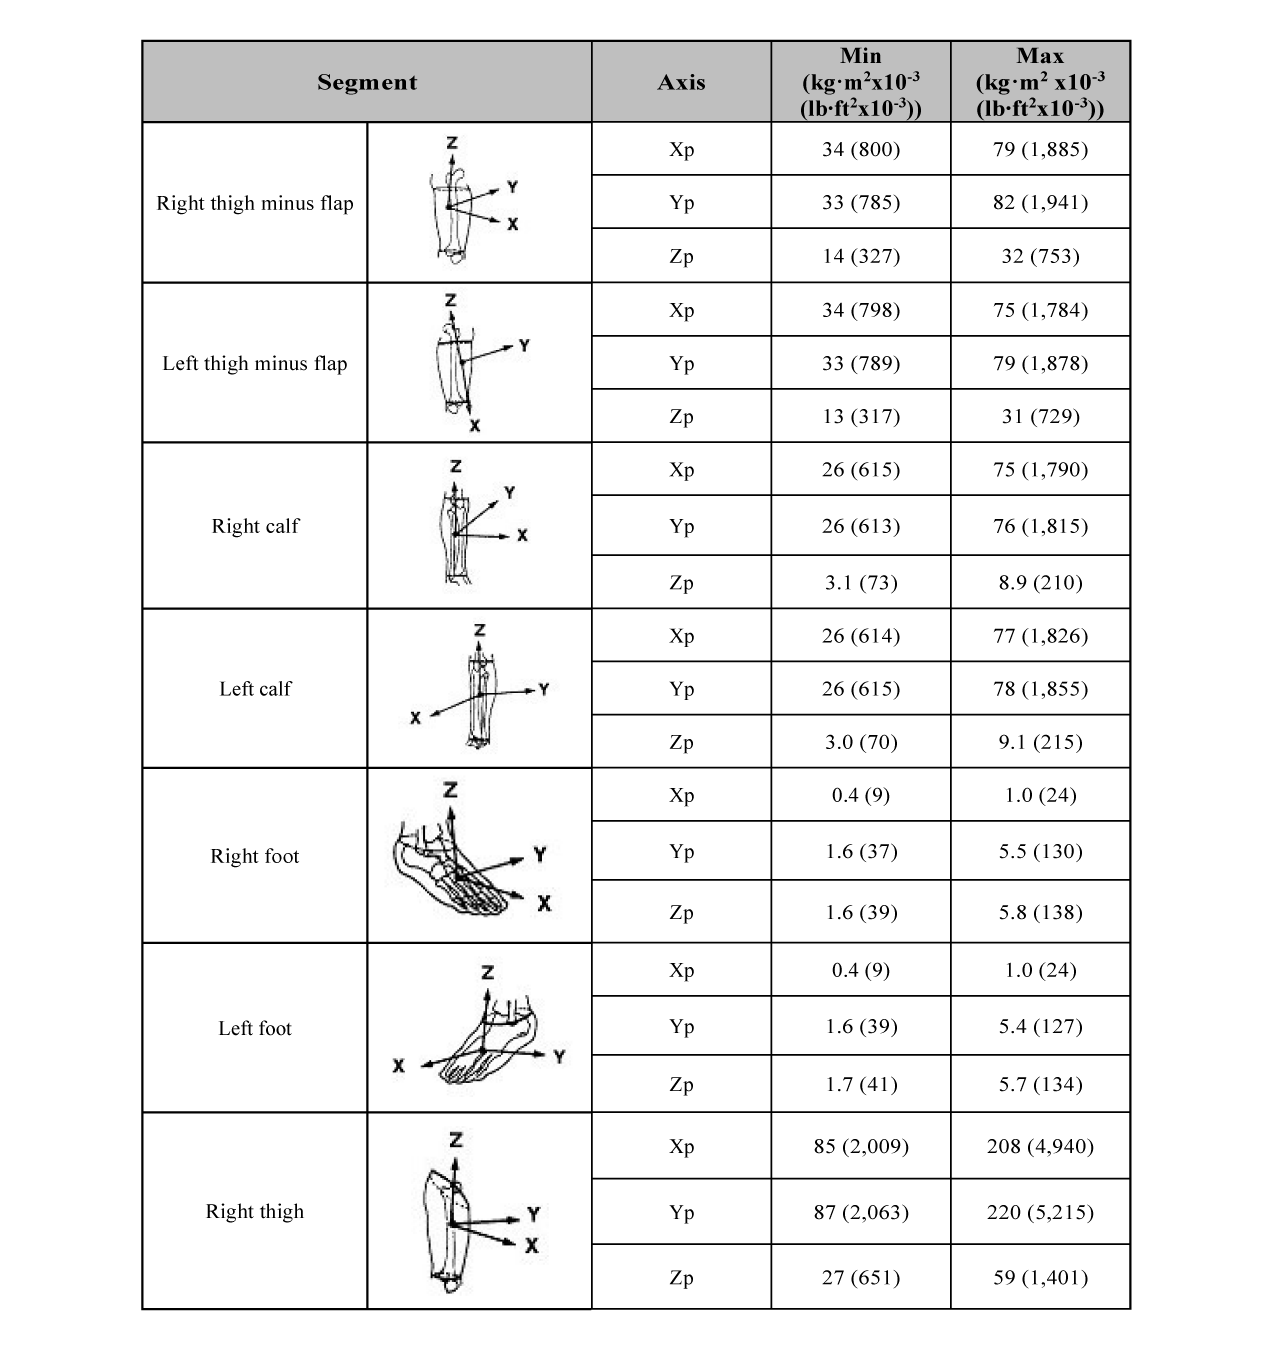
E.5.5 Segment Moments of Inertia
Regression equations from the McConville et al. (1980) and Young et al. (1983) studies were used to compute the moments of inertia. The moments of inertia presented are those about the principal axes Xp, Yp, and Zp.
E.5.6 References
McConville, J.T., Churchill, T.D., Kaleps, I., Cuzzi, J., (1980). Anthropometric relationships of body and body segment moments of inertia. AFAMRL-TR-80-119, Wright-Patterson Air Force Base, Ohio.
Young, J.W., Chandler, R.F., Snow, C.C., Robinette, K.M., Zenner, G.F., Lofberg, M.S. (1983). Anthropometrics and mass distribution characteristics of the adult female. FAA-AM-83-16, Revised Edition, FAA Civil Aeromedical Institute, Oklahoma City, Oklahoma.
Table E.5-1—Whole Body Mass, Unsuited

Table E.5-2—Body Segment Mass of a Crewmember, Unsuited
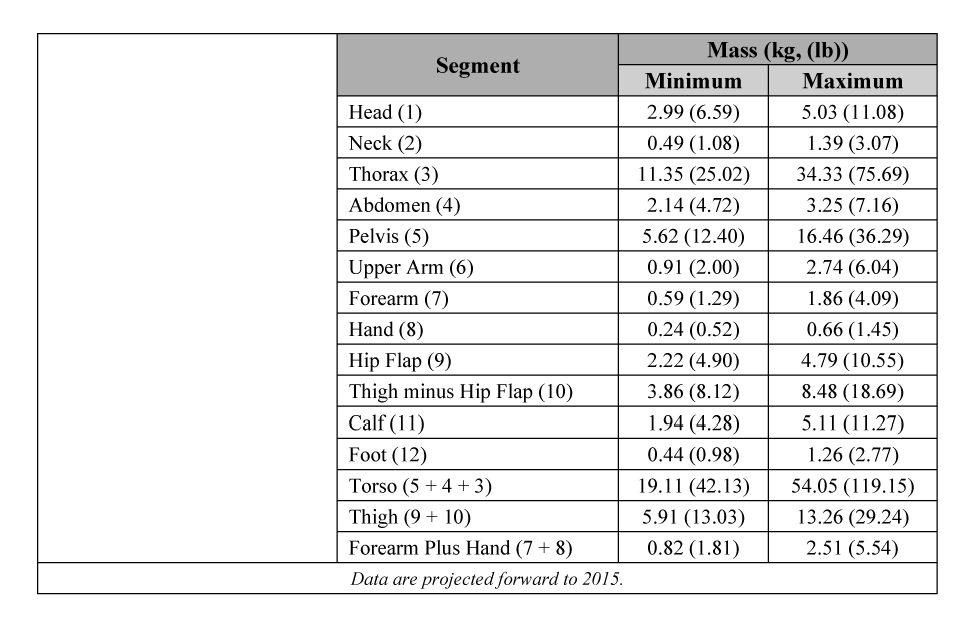
Table E.5-3—Whole Body Center of Mass Location

Table E.5-4—Body-Segment Center of Mass Location of the Crewmember, Unsuited
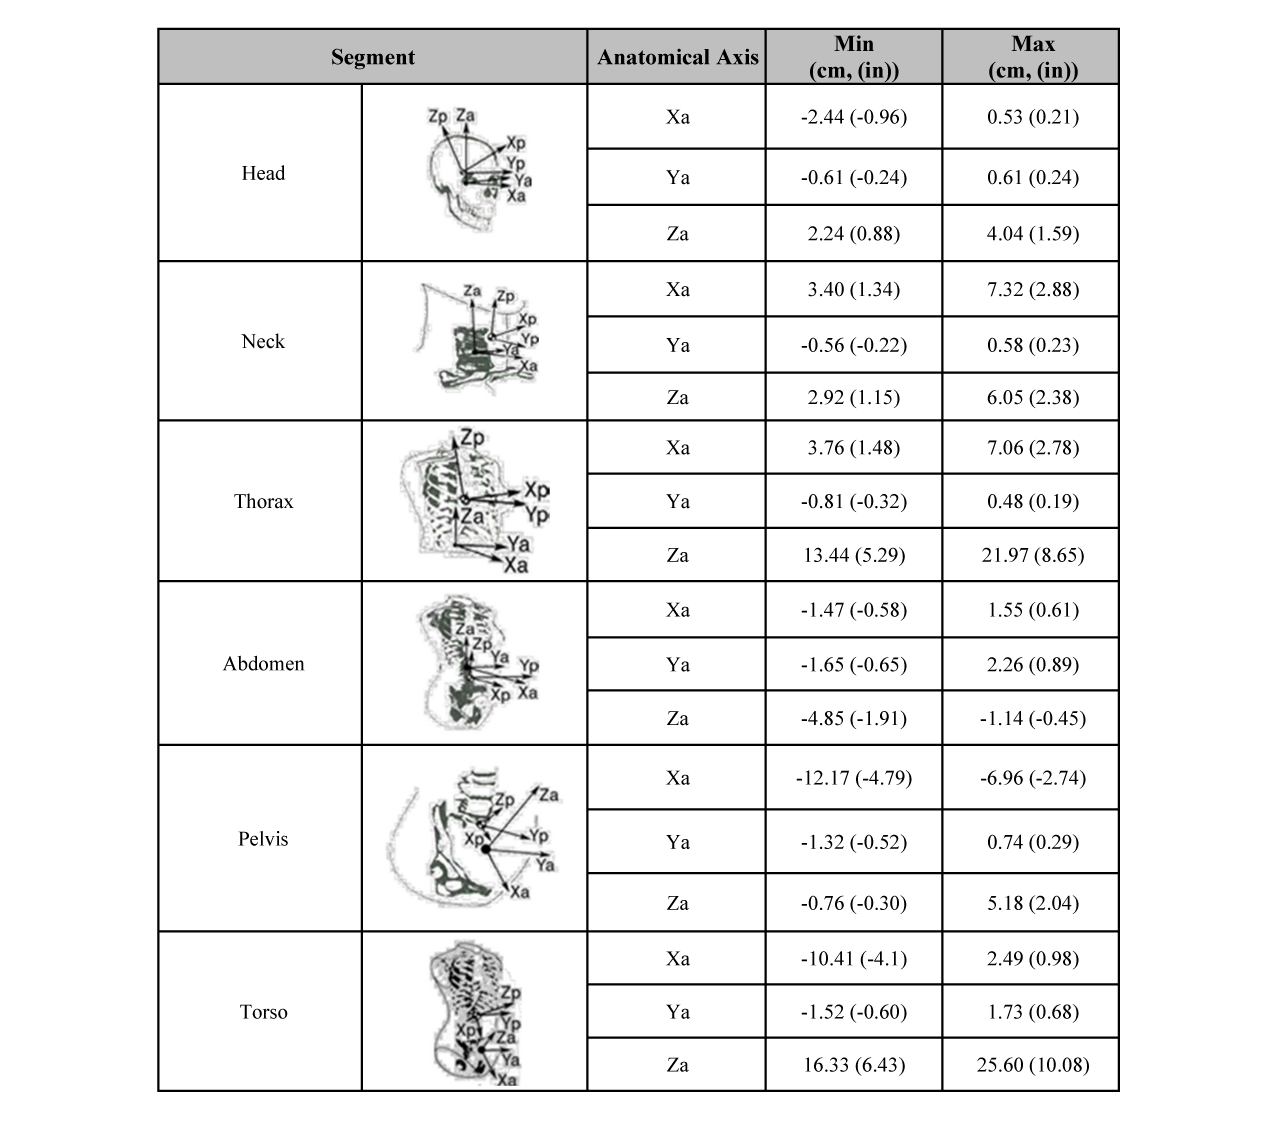

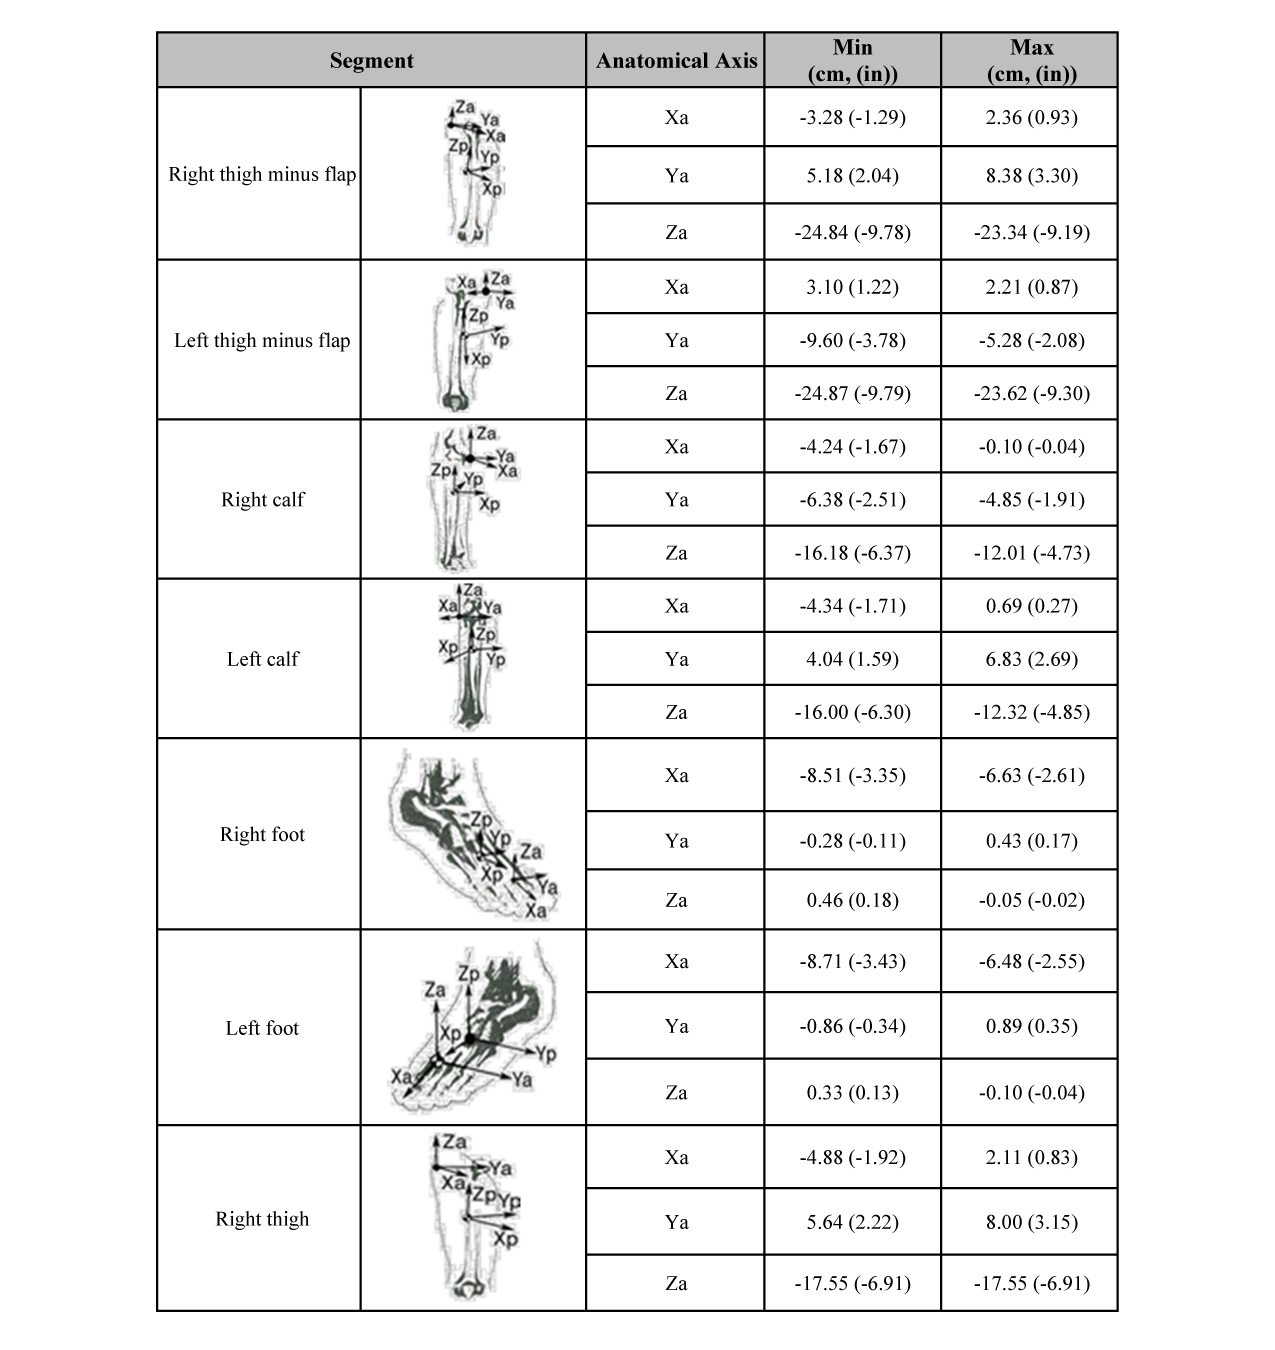
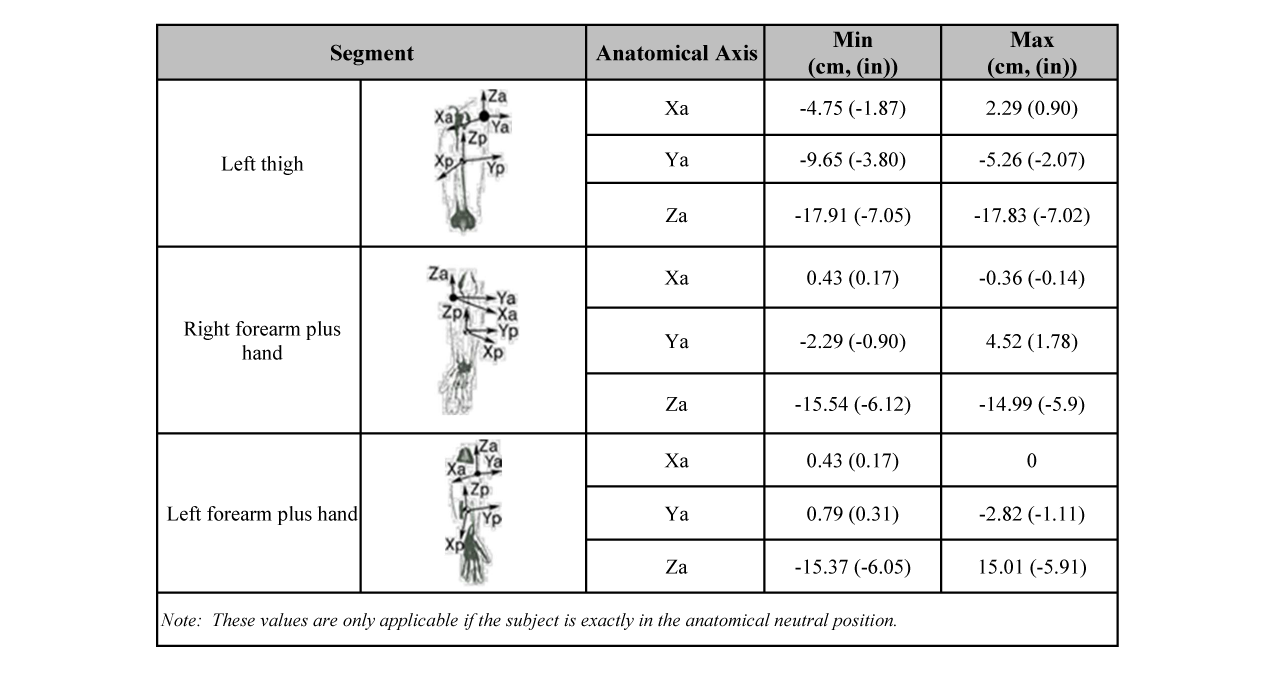
Table E.5-5—Whole Body Moment of Inertia of the Crewmember, Unsuited
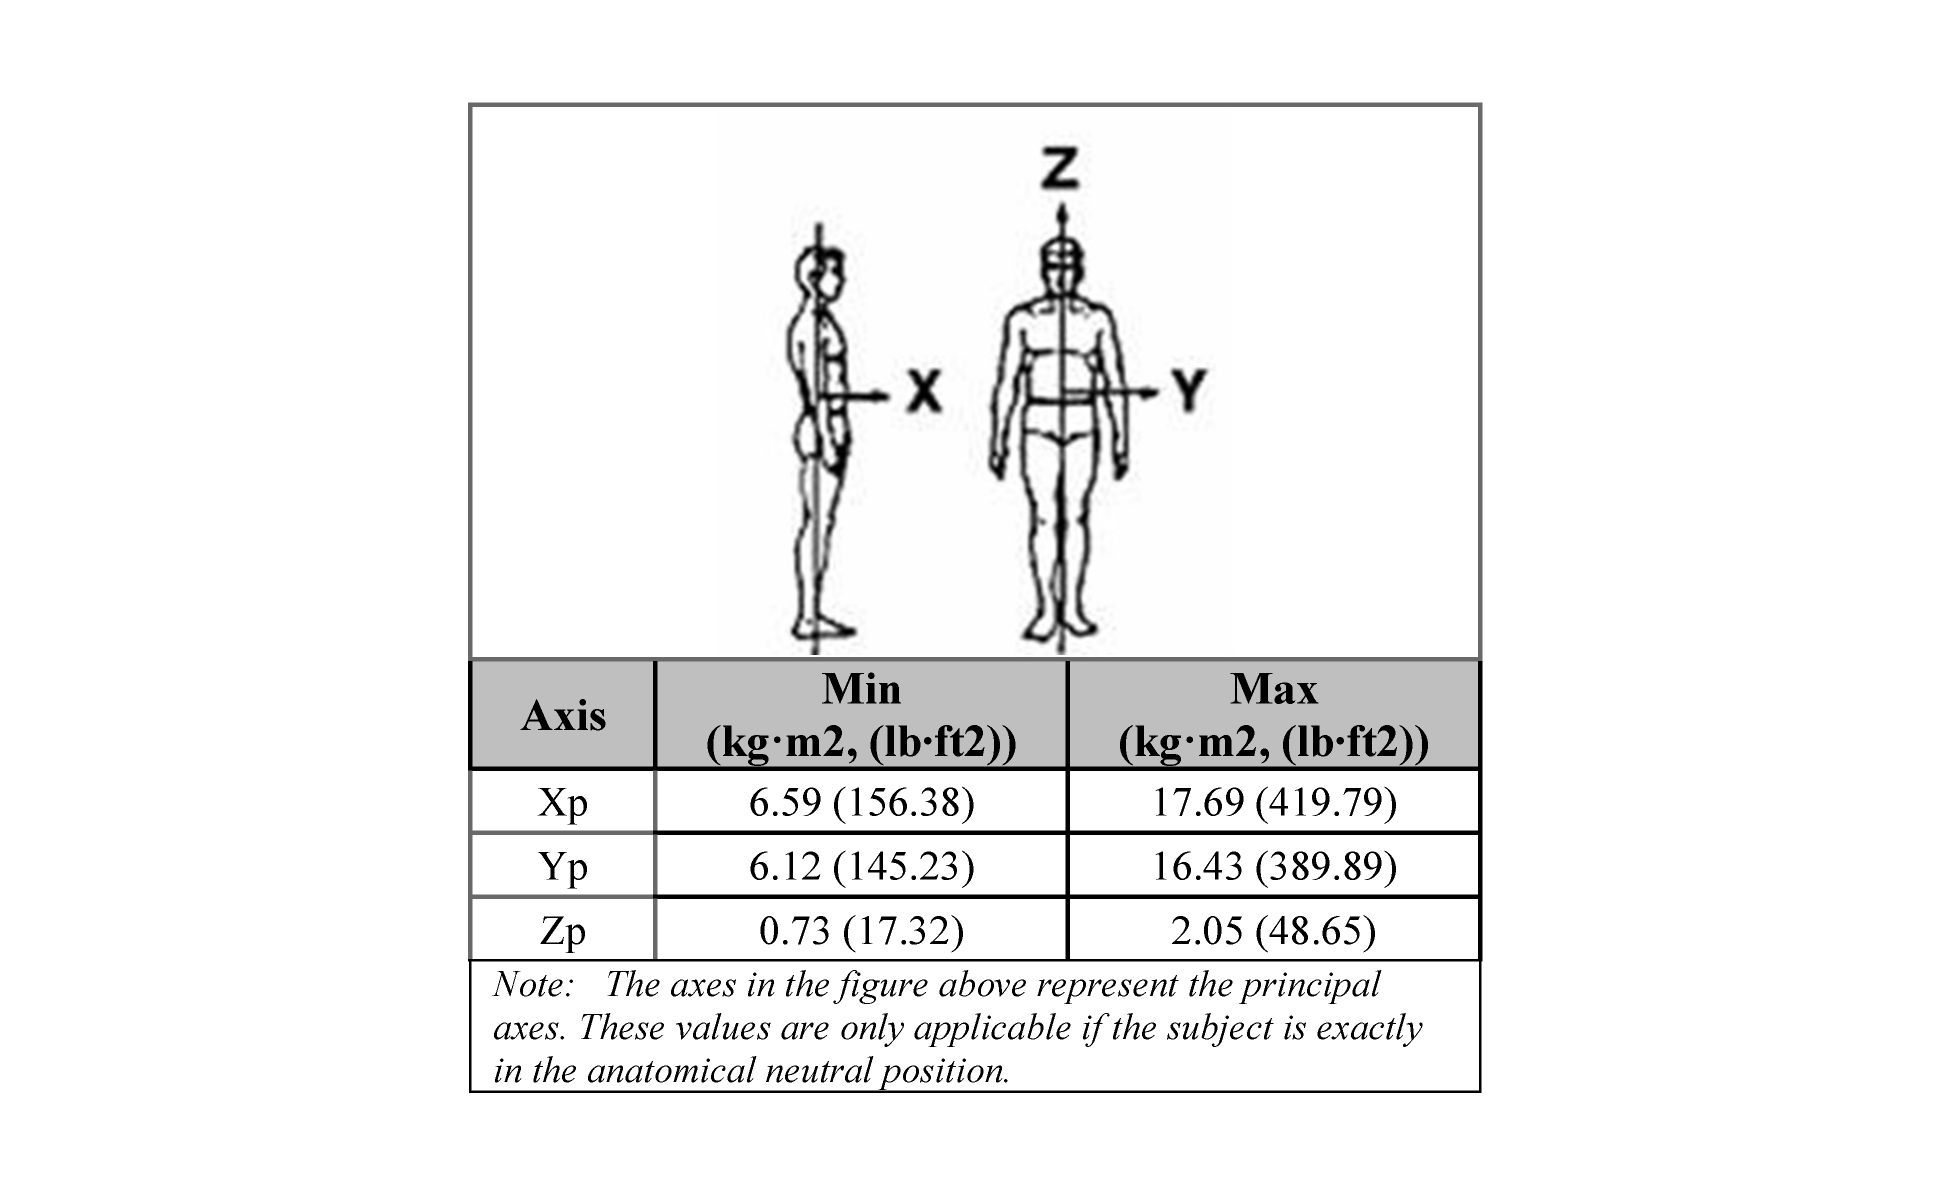
Table E.5-6—Body-Segment Moment of Inertia of the Crewmember, Unsuited

E.6 BODY VOLUME
Table E.6-1—Whole-Body Volume of Crewmember

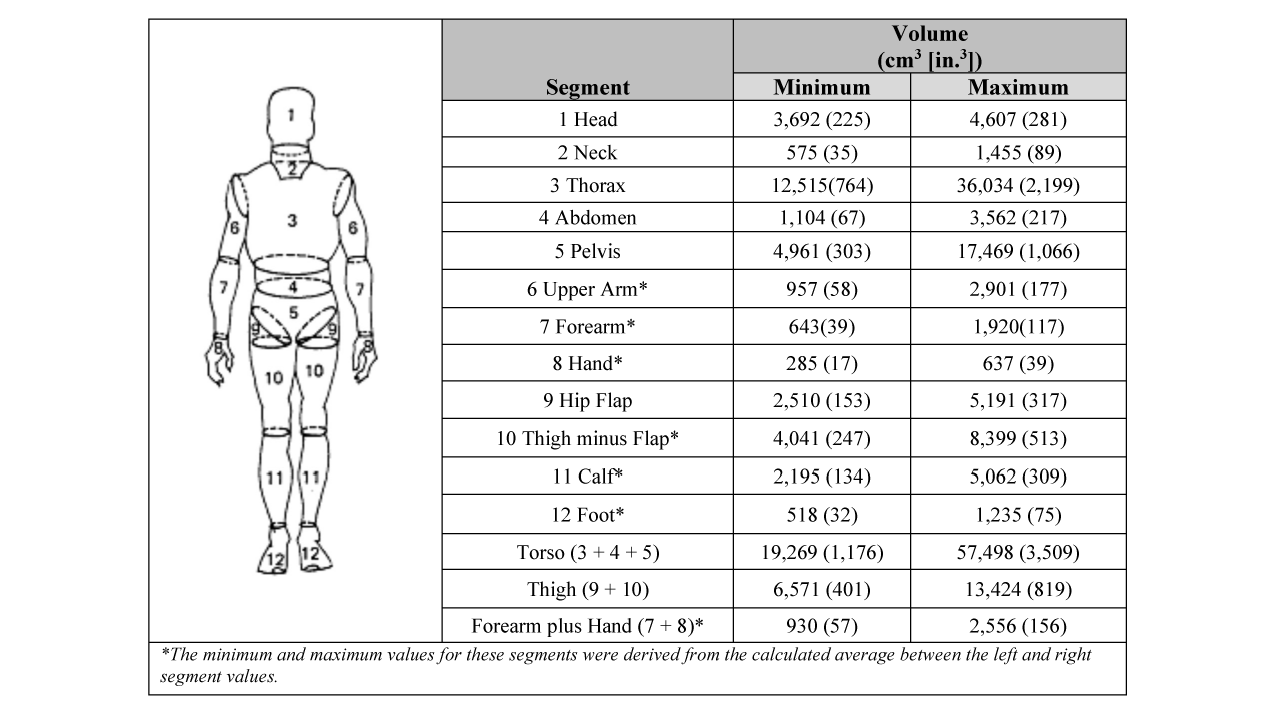
Table E.6-2—Body-Segment Volume of Crewmember
E.7 CREWMEMBER STRENGTH
Strength refers to a person’s ability to generate force. Applying the following strength requirements will result in a minimum and maximum applied crew load to be used for operational and hardware design. The minimum load pertains to operational strength that accommodates the weakest person while the maximum load represents the force the hardware must be able to withstand without failure. It is important to note that these requirements apply to intentional forces applied by the crewmember. Durability is applicable to structural integrity of hardware due to non-intentional crew forces which is handled through the structural design process.
Tables E.7-(1-6) provide both minimum (operational) and maximum (withstand) strength capabilities for unsuited, suited unpressurized, and suited pressurized conditions.
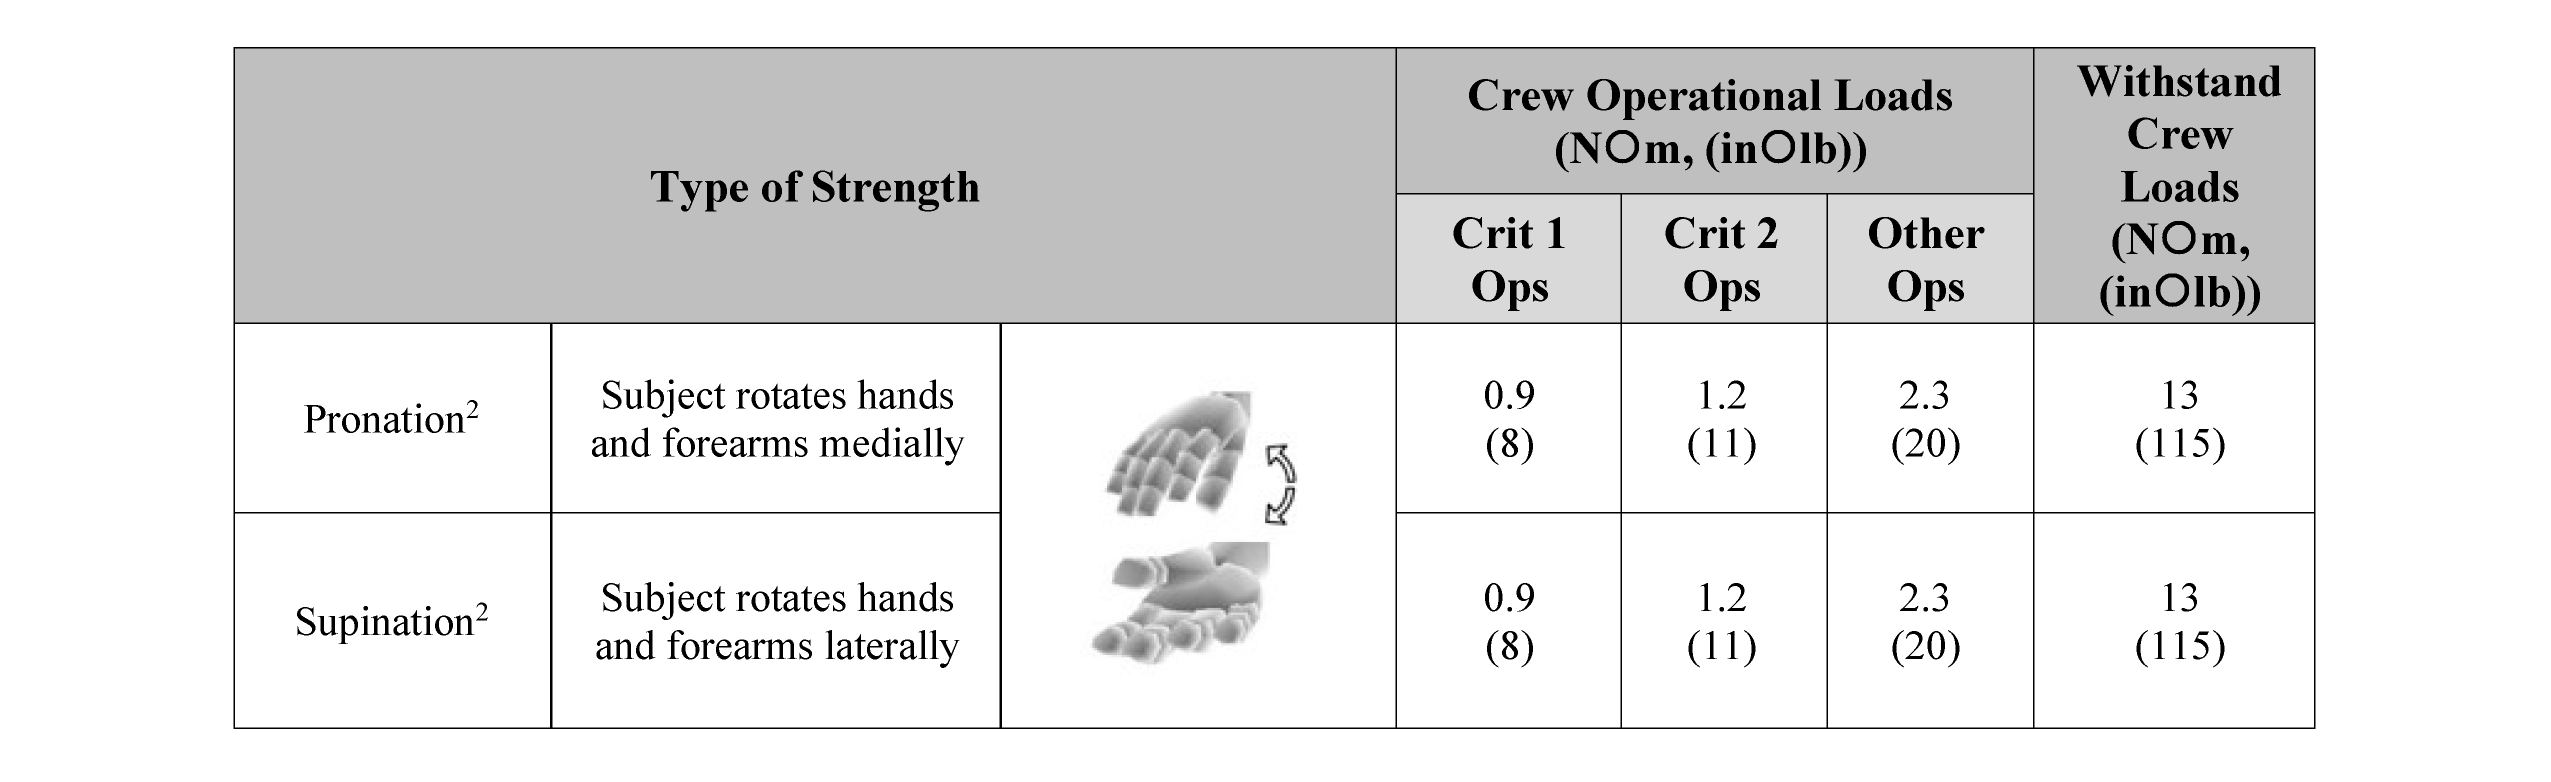
E.7.1 Withstand (Maximum Strength) Crew Loads
Vehicle components and equipment are to be designed to withstand large forces exerted by a strong crewmember during nominal hardware operation, without breaking or sustaining damage that would deem the hardware inoperable. Humans may also exert high forces when operating controls in emergency situations, such as attempting to open a hatch for emergency egress. The resulting possible damage to equipment could make it impossible to respond safely to the emergency. To avoid overdesign, a task analysis is performed to identify which interfaces must tolerate maximum crew loads. This includes identifying critical hardware that may be inadvertently used as a mobility aid or restraint. Identified crew interfaces must withstand the value provided in the corresponding “withstand crew loads” column, which provides the maximum loads that crew can be expected to exert. The data provided in the tables are for unsuited, suited-unpressurized, and suited-pressurized conditions. Data was derived from a collection of journal articles associated with human strength data.
E.7.2 Crew Operational Loads (for Minimum Strength)
The design must allow for all crewmembers to perform any of the requested tasks efficiently and effectively, thus ensuring task and/or mission success. A human-centered design process is to be used when implementing operational strength limits. Analysis of expected crew operations, activities, and tasks is to drive the design of human-machine interfaces. The analysis should evaluate and define activities/tasks in terms of criticality and required postures. Identified crew interfaces must be actuated and operable at the value provided in the corresponding “Crew Operational Loads” columns, which provide the maximum load that the weakest crewmember could be expected to exert. The data provided in the tables are for unsuited, suited-unpressurized, and suited-pressurized conditions. Data was derived from a collection of journal articles associated with human strength data.
For this purpose, tasks that involve the possibility of a single failure causing loss of life or vehicle have a definition of Criticality 1 Operations in the following tables. Tasks involving Loss of Mission (LOM) alone have a definition of Criticality 2 Operations. The values in the criticality 1 and 2 columns also include decrement factor(s) to reflect the deconditioning effects on crewmembers after an extended duration of mission. All other tasks fall into the “Other Operations” category, and do not have deconditioning or a factor of safety applied over minimal anticipated crew strength. It is important to note that the designer should be careful not to implement multiple safety factors. For example, NASA-STD-5017 torque/force margin requirements (4.10.0) levy an extra safety factor on the applied torque/force to a given mechanism. Implementing this requirement along with the already built-in safety factor (i.e., criticality) in the strength tables results in an overly conservative design.
Data was derived from a collection of journal articles associated with human strength data. In addition, other references were used, such as the MIL-STD-1472F and the Occupational and Biomechanics textbook (Chaffin, D. B., Occupation Biomechanics, Second Edition, John Wiley & Sons, Inc., 1991), to set a standard for very specific strength data such as lifting strength.
Table E.7-1—Crew Operational Loads, Unsuited
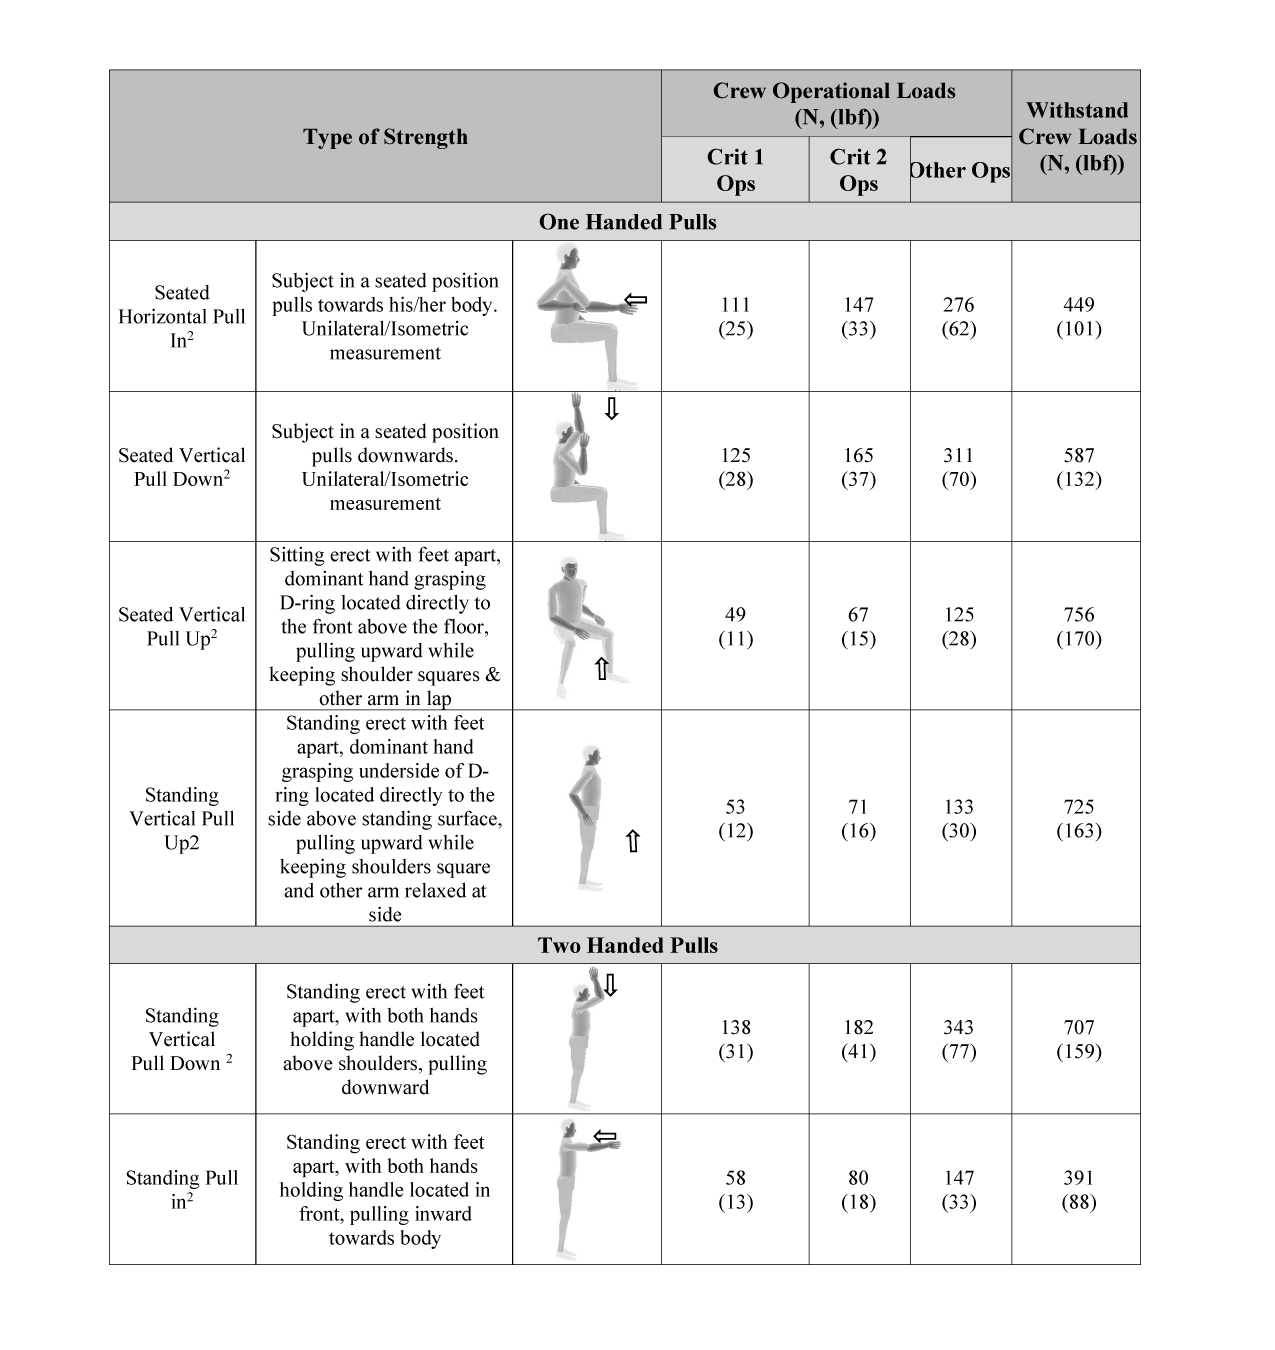
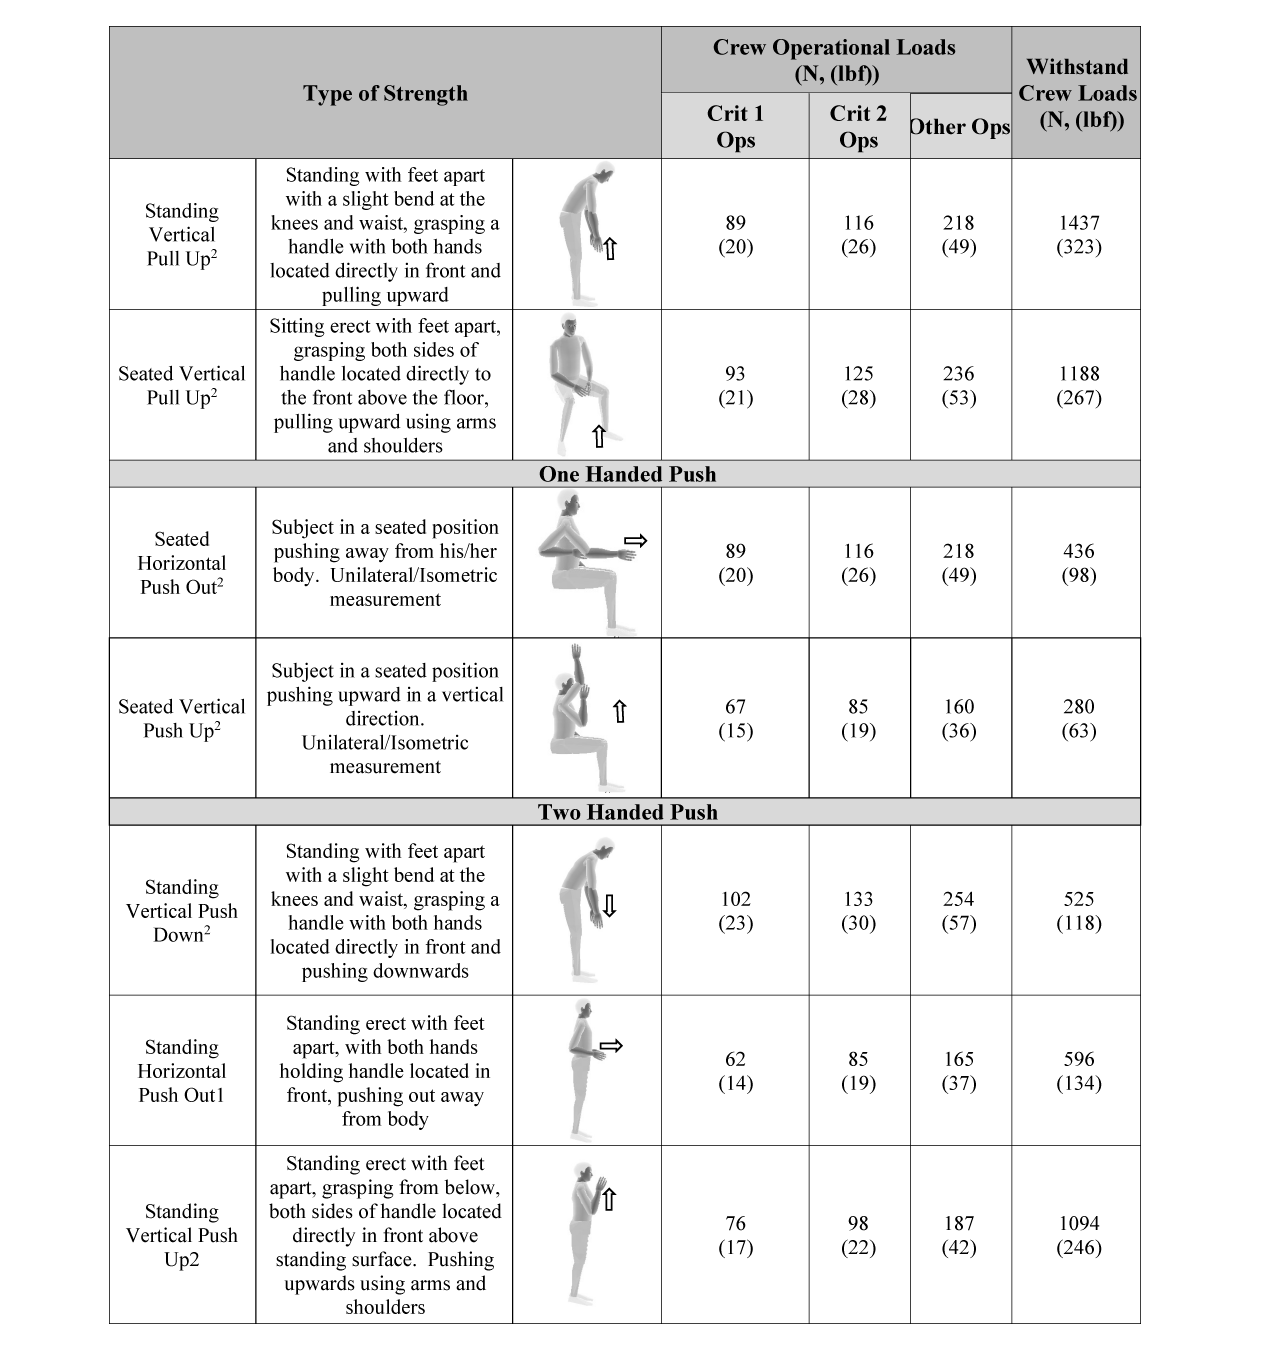
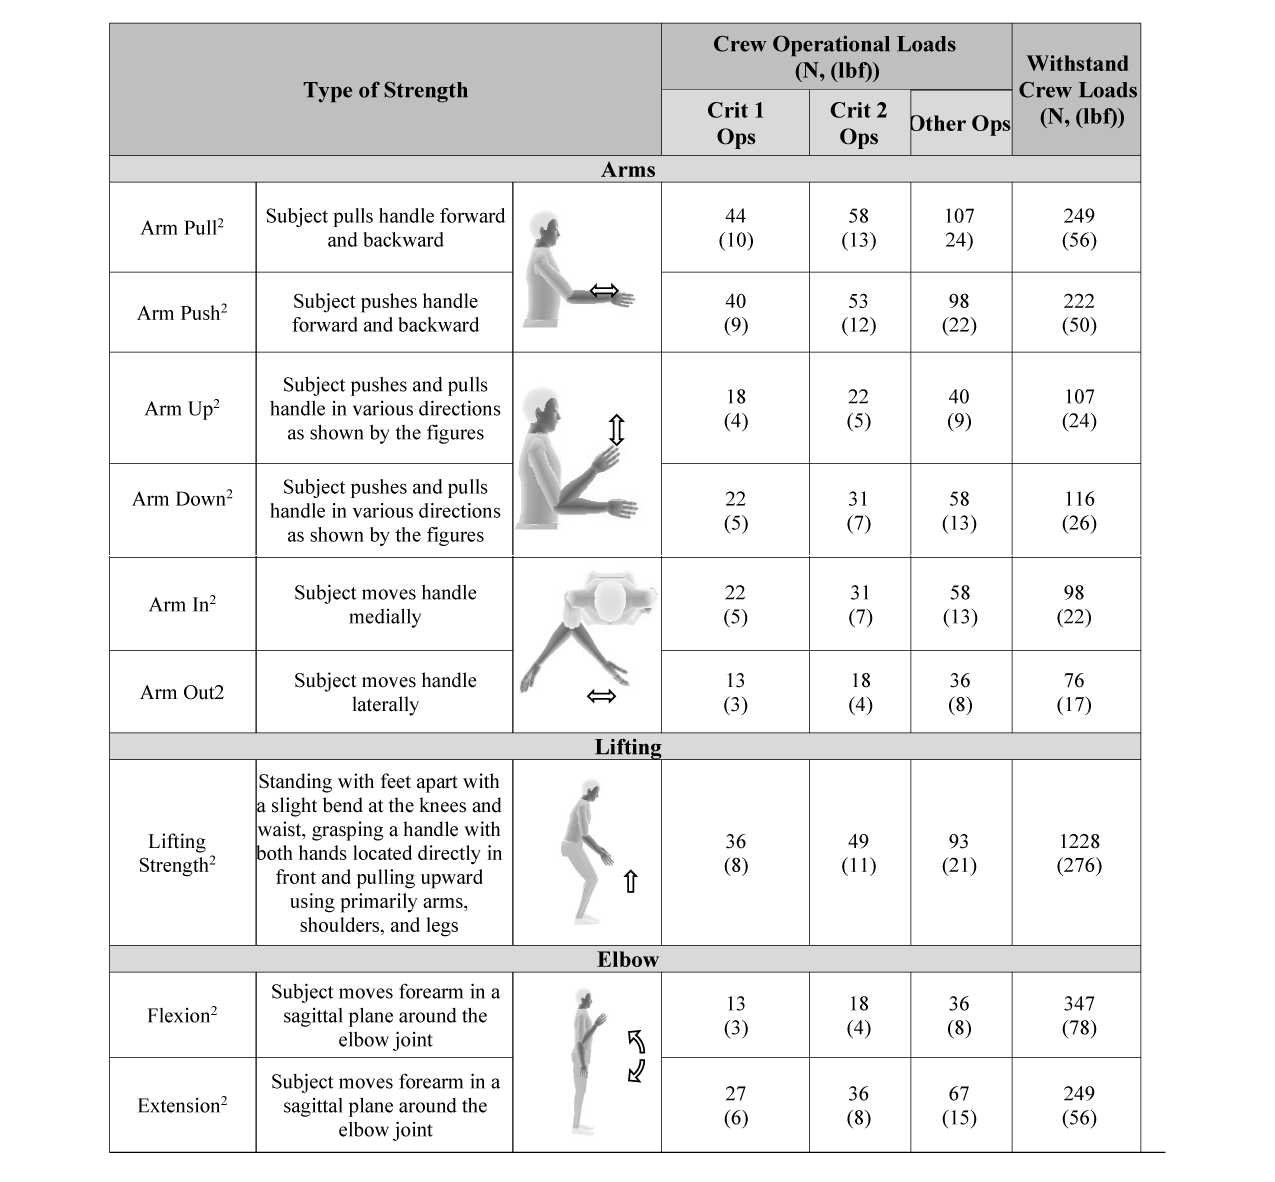
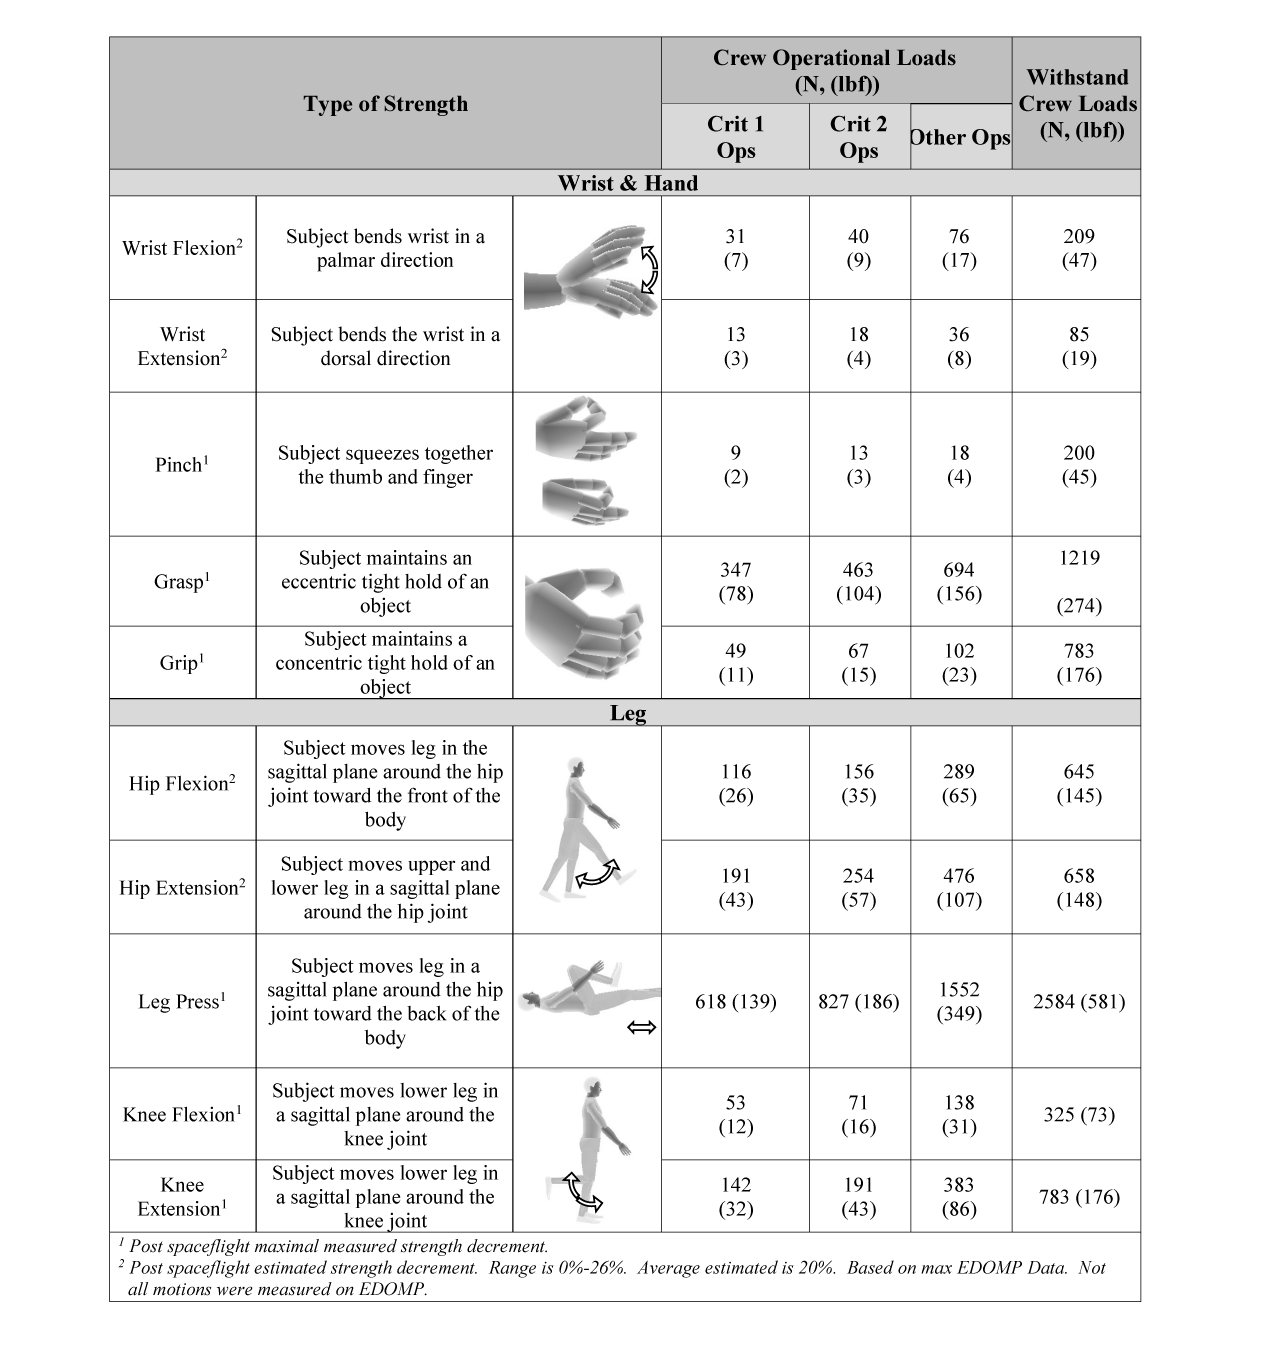
Table E.7-2—Torque Values for Pronation and Supination, Unsuited
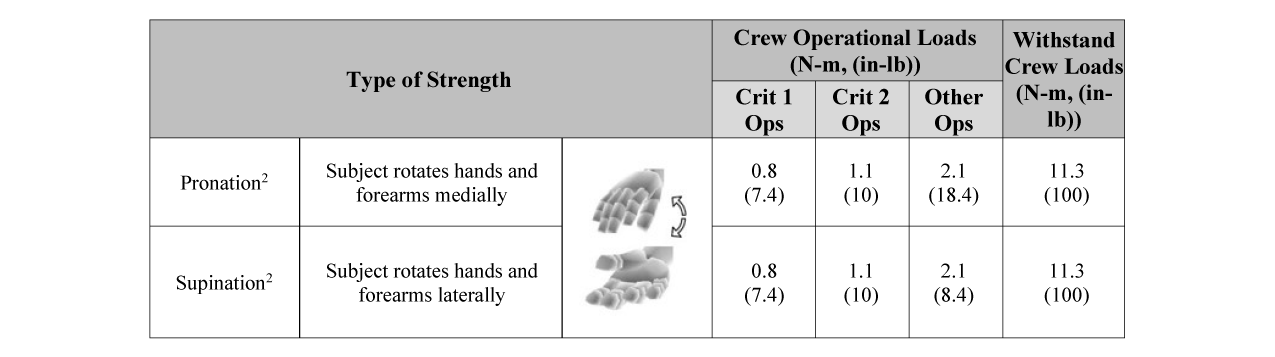
Table E.7-3—Crew Loads, Unpressurized Suited
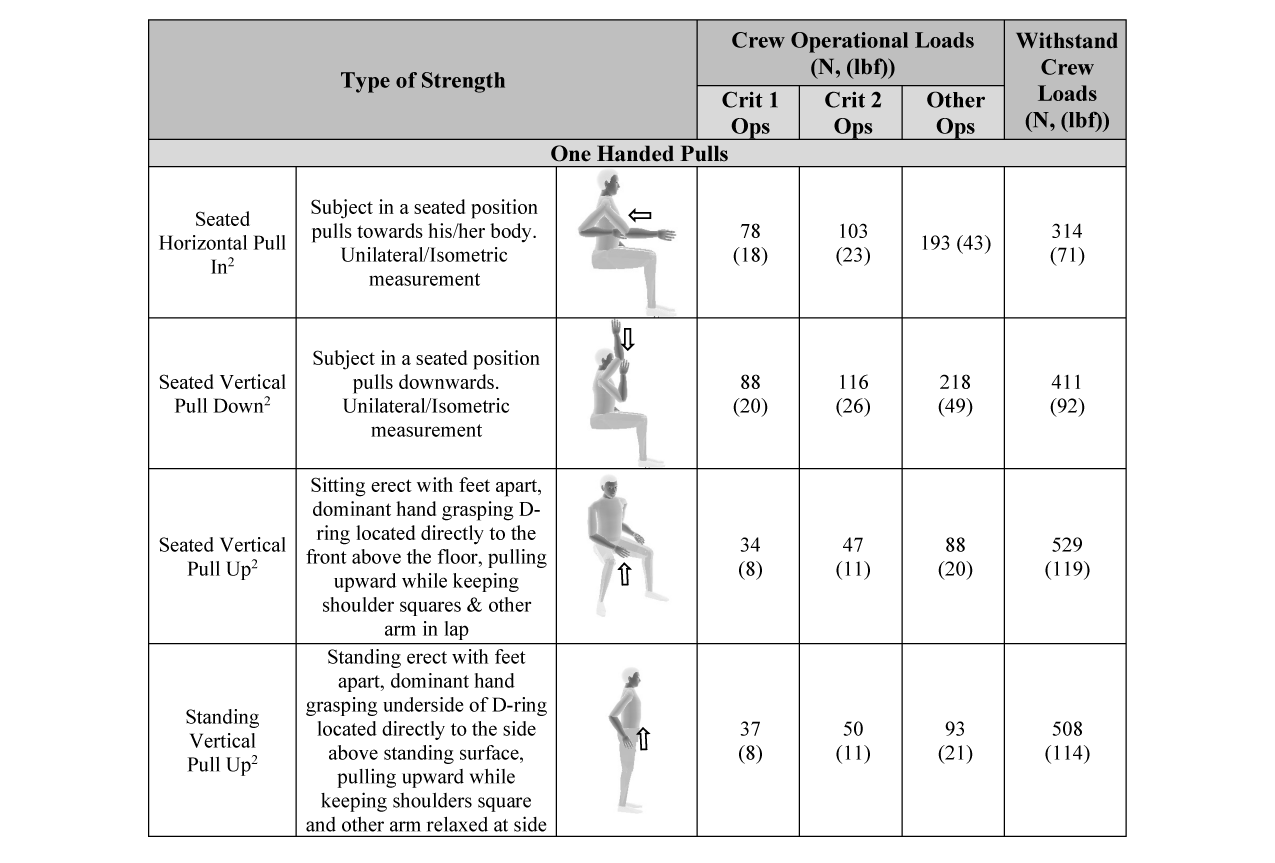
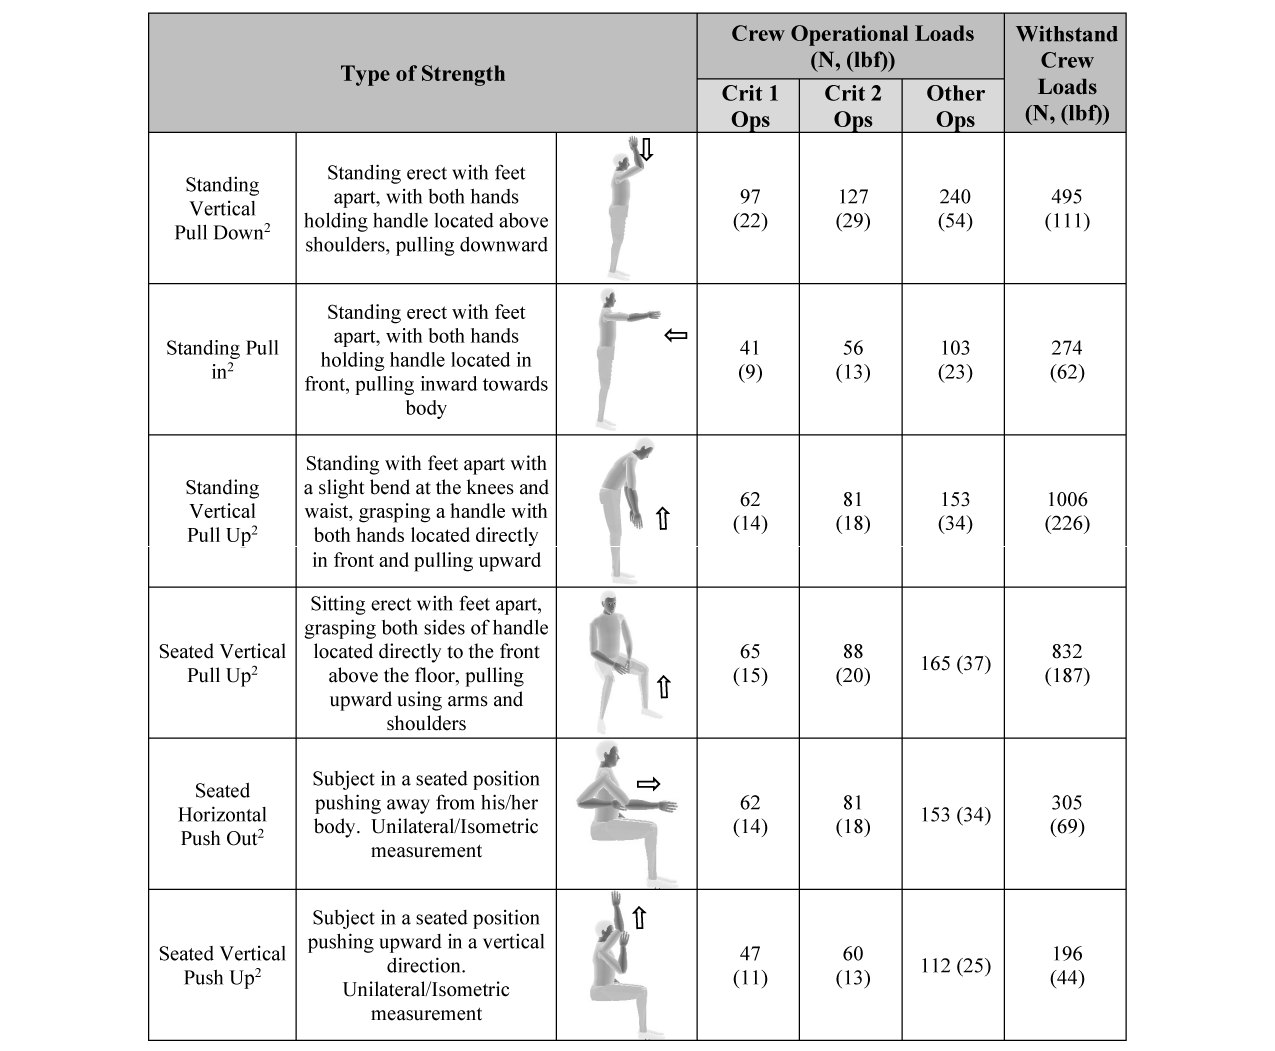
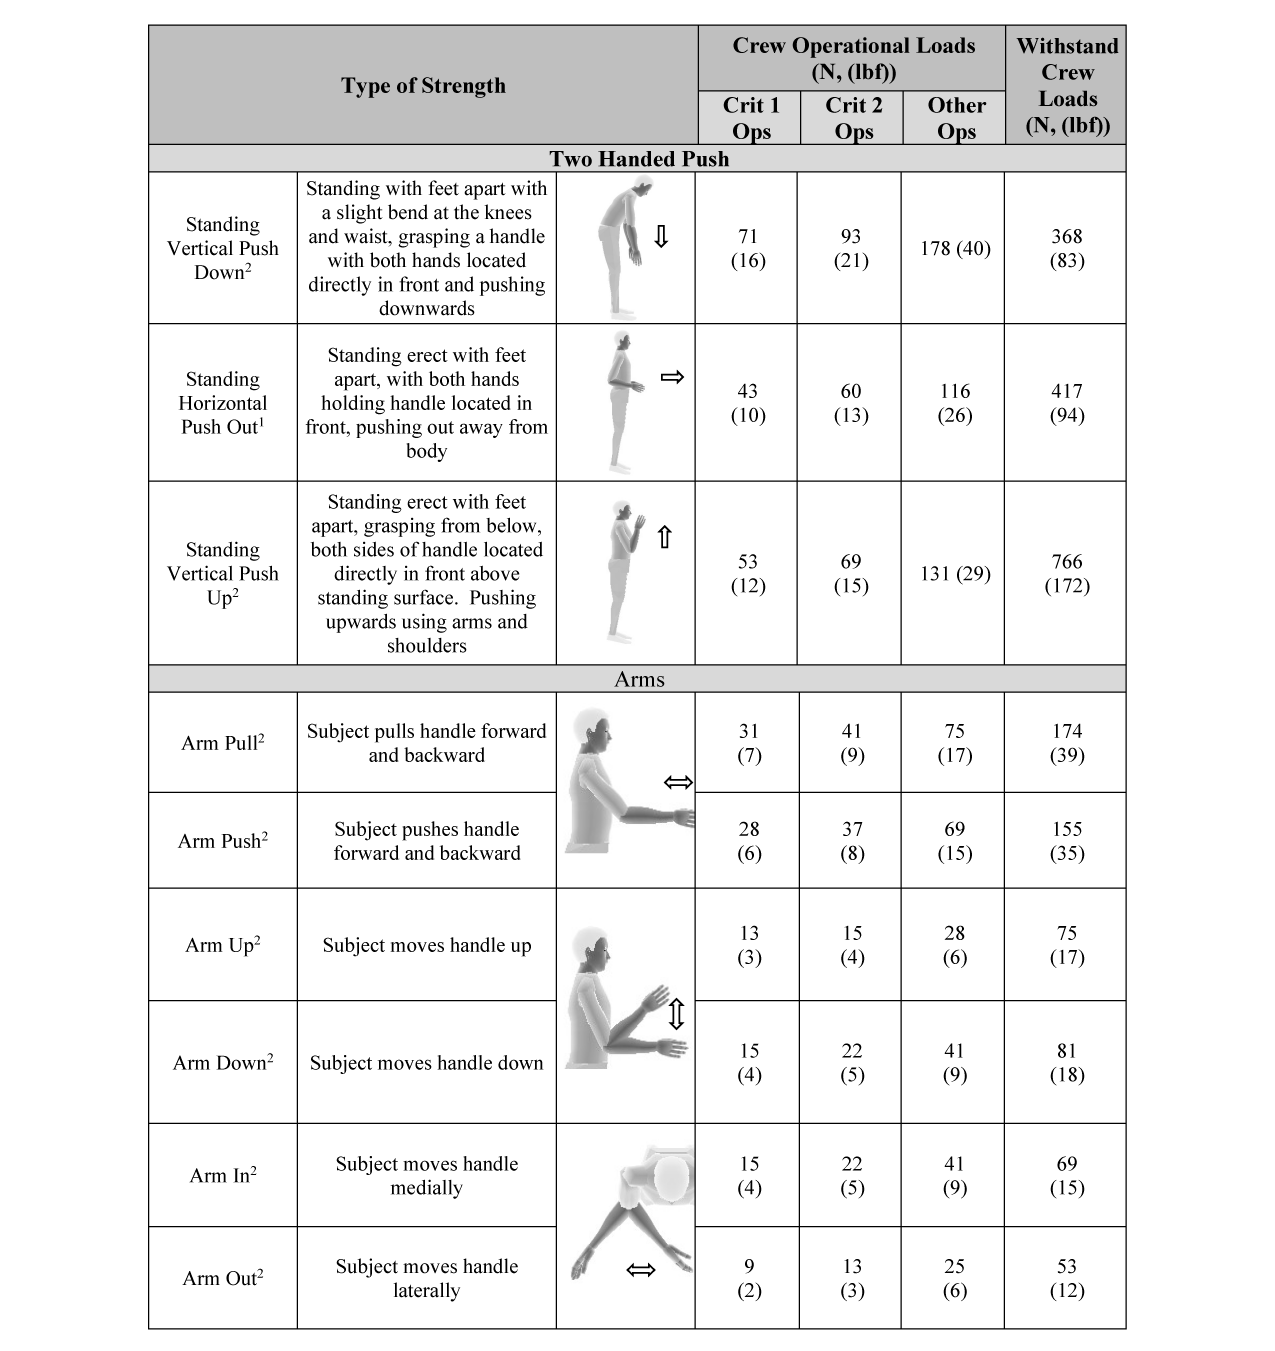
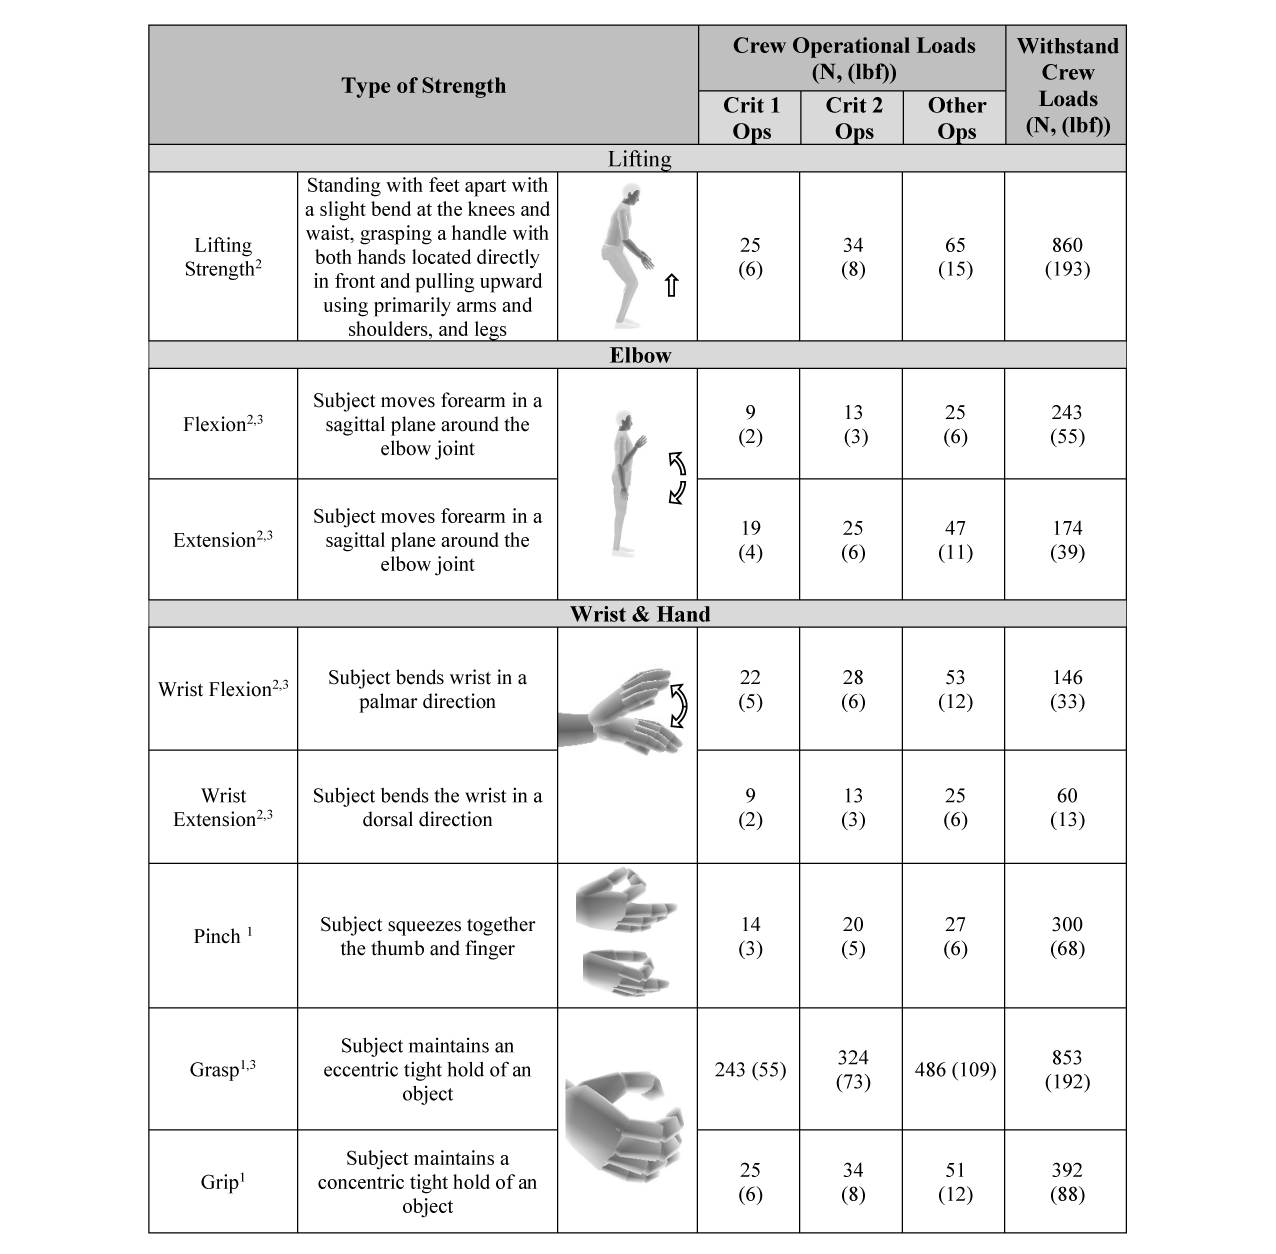
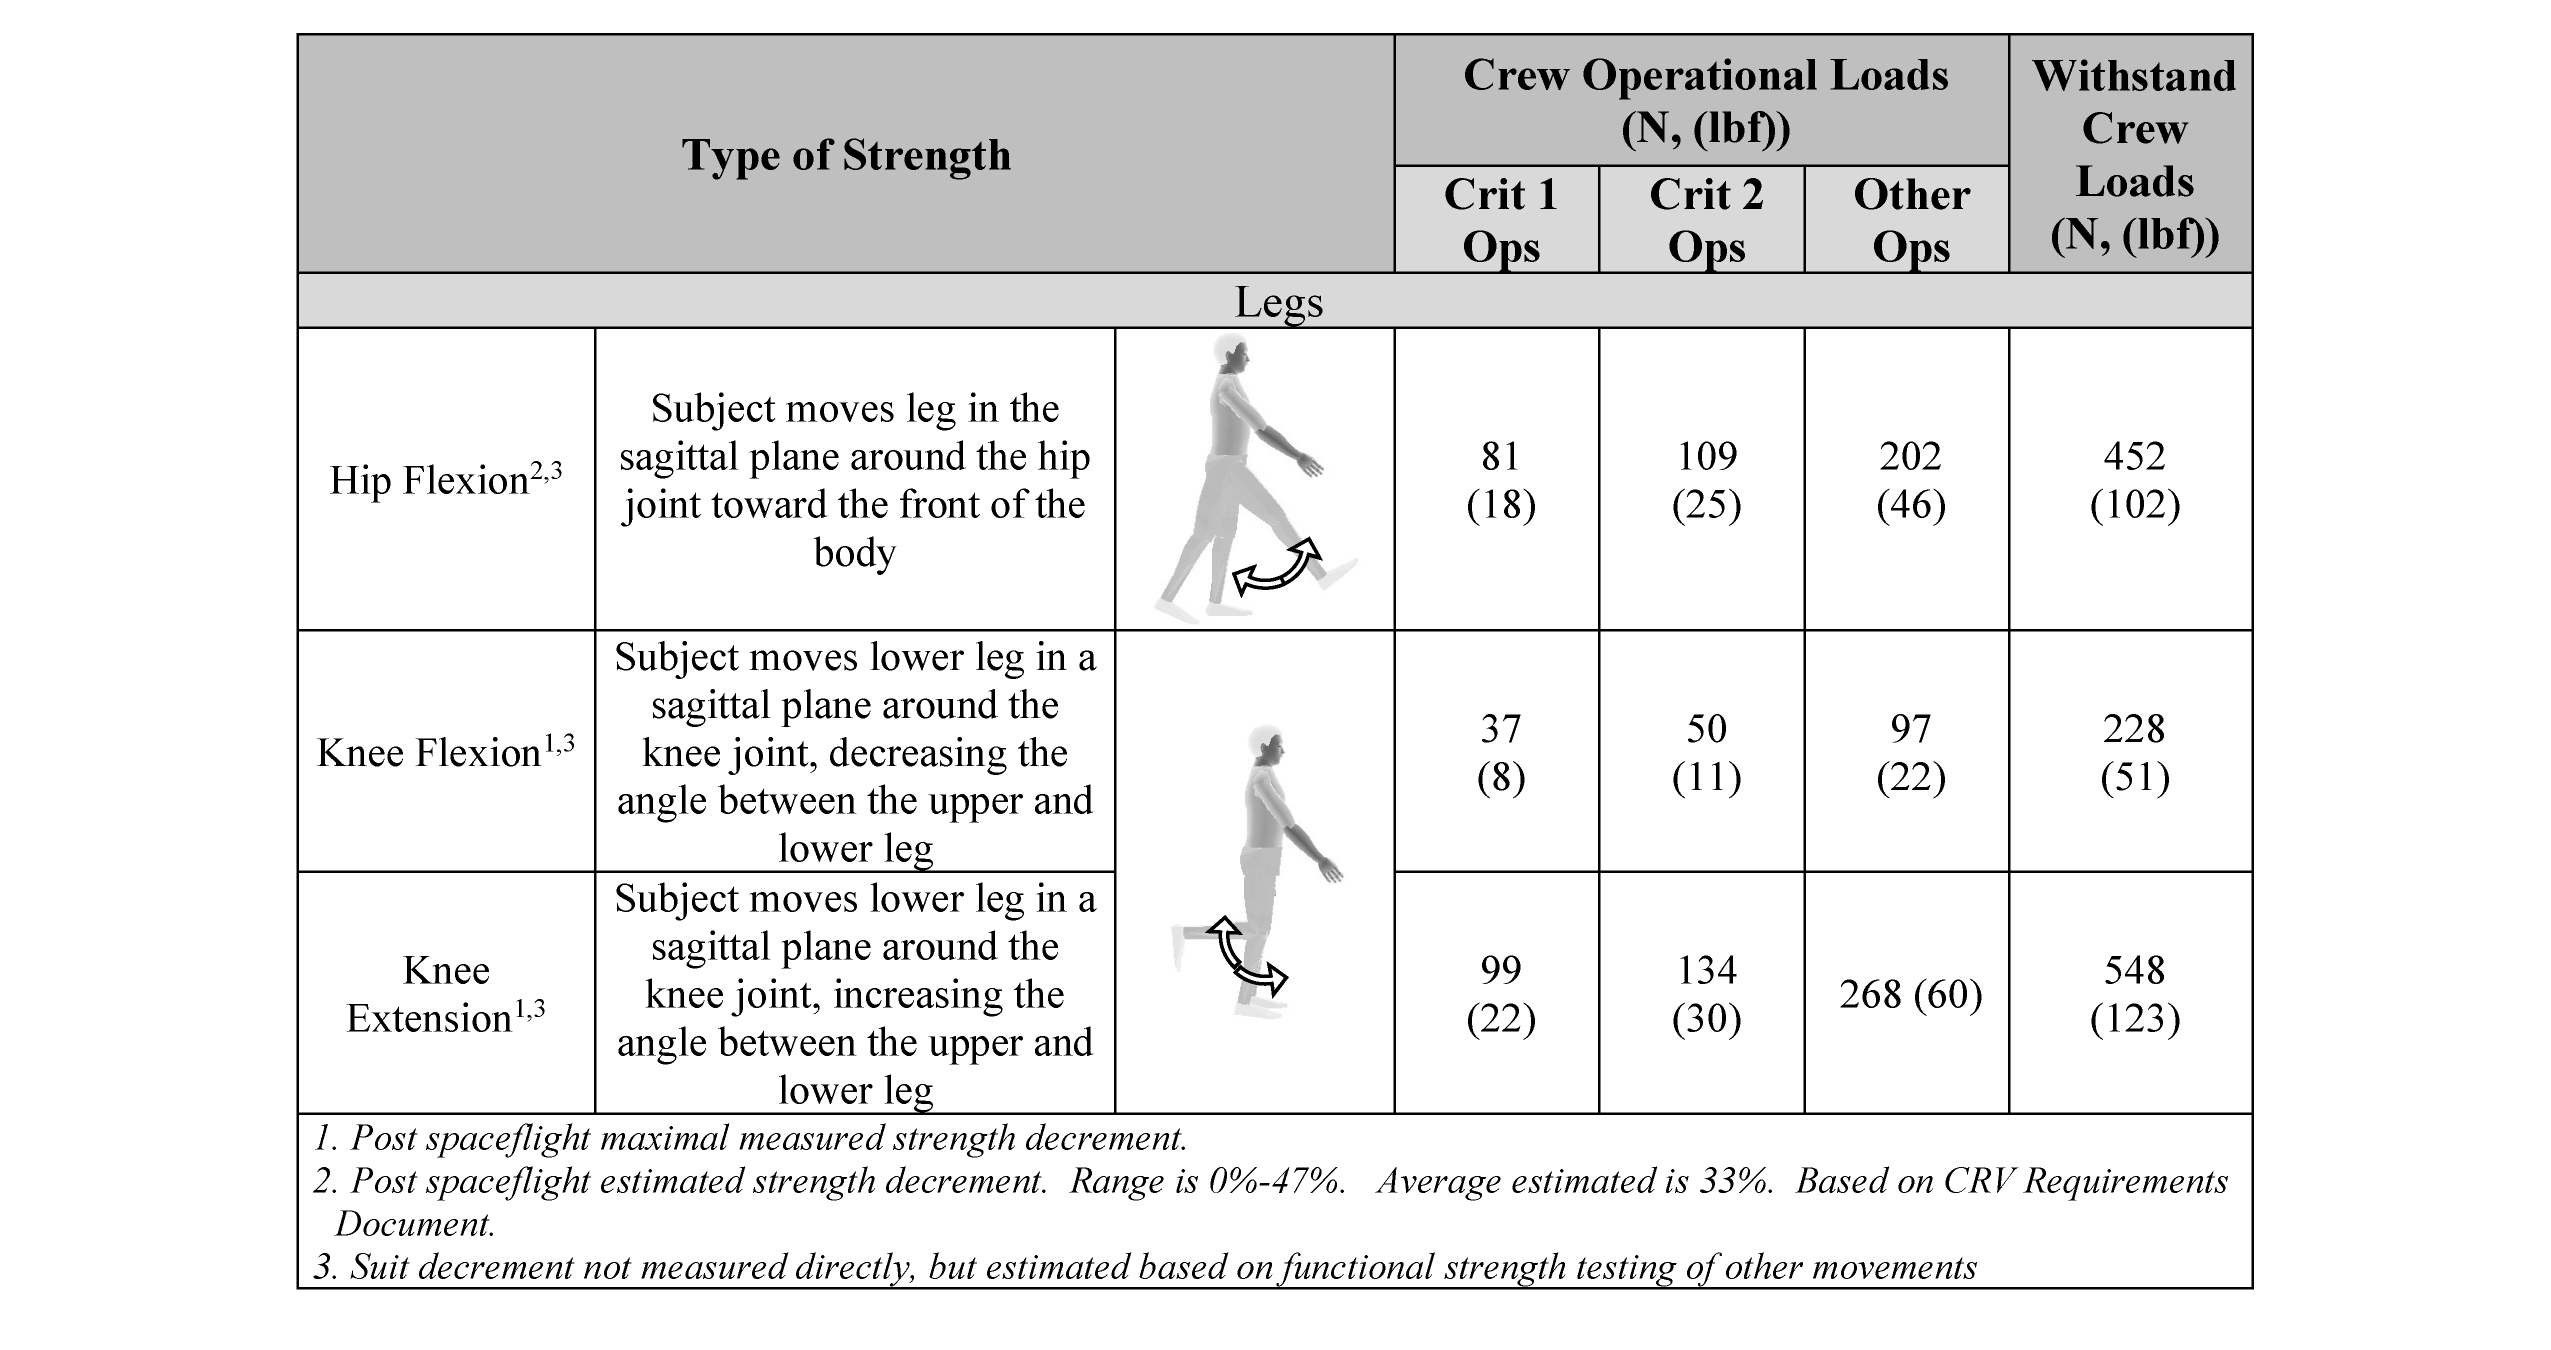
Table E.7-4—Torque Values Pronation and Supination, Unpressurized Suited
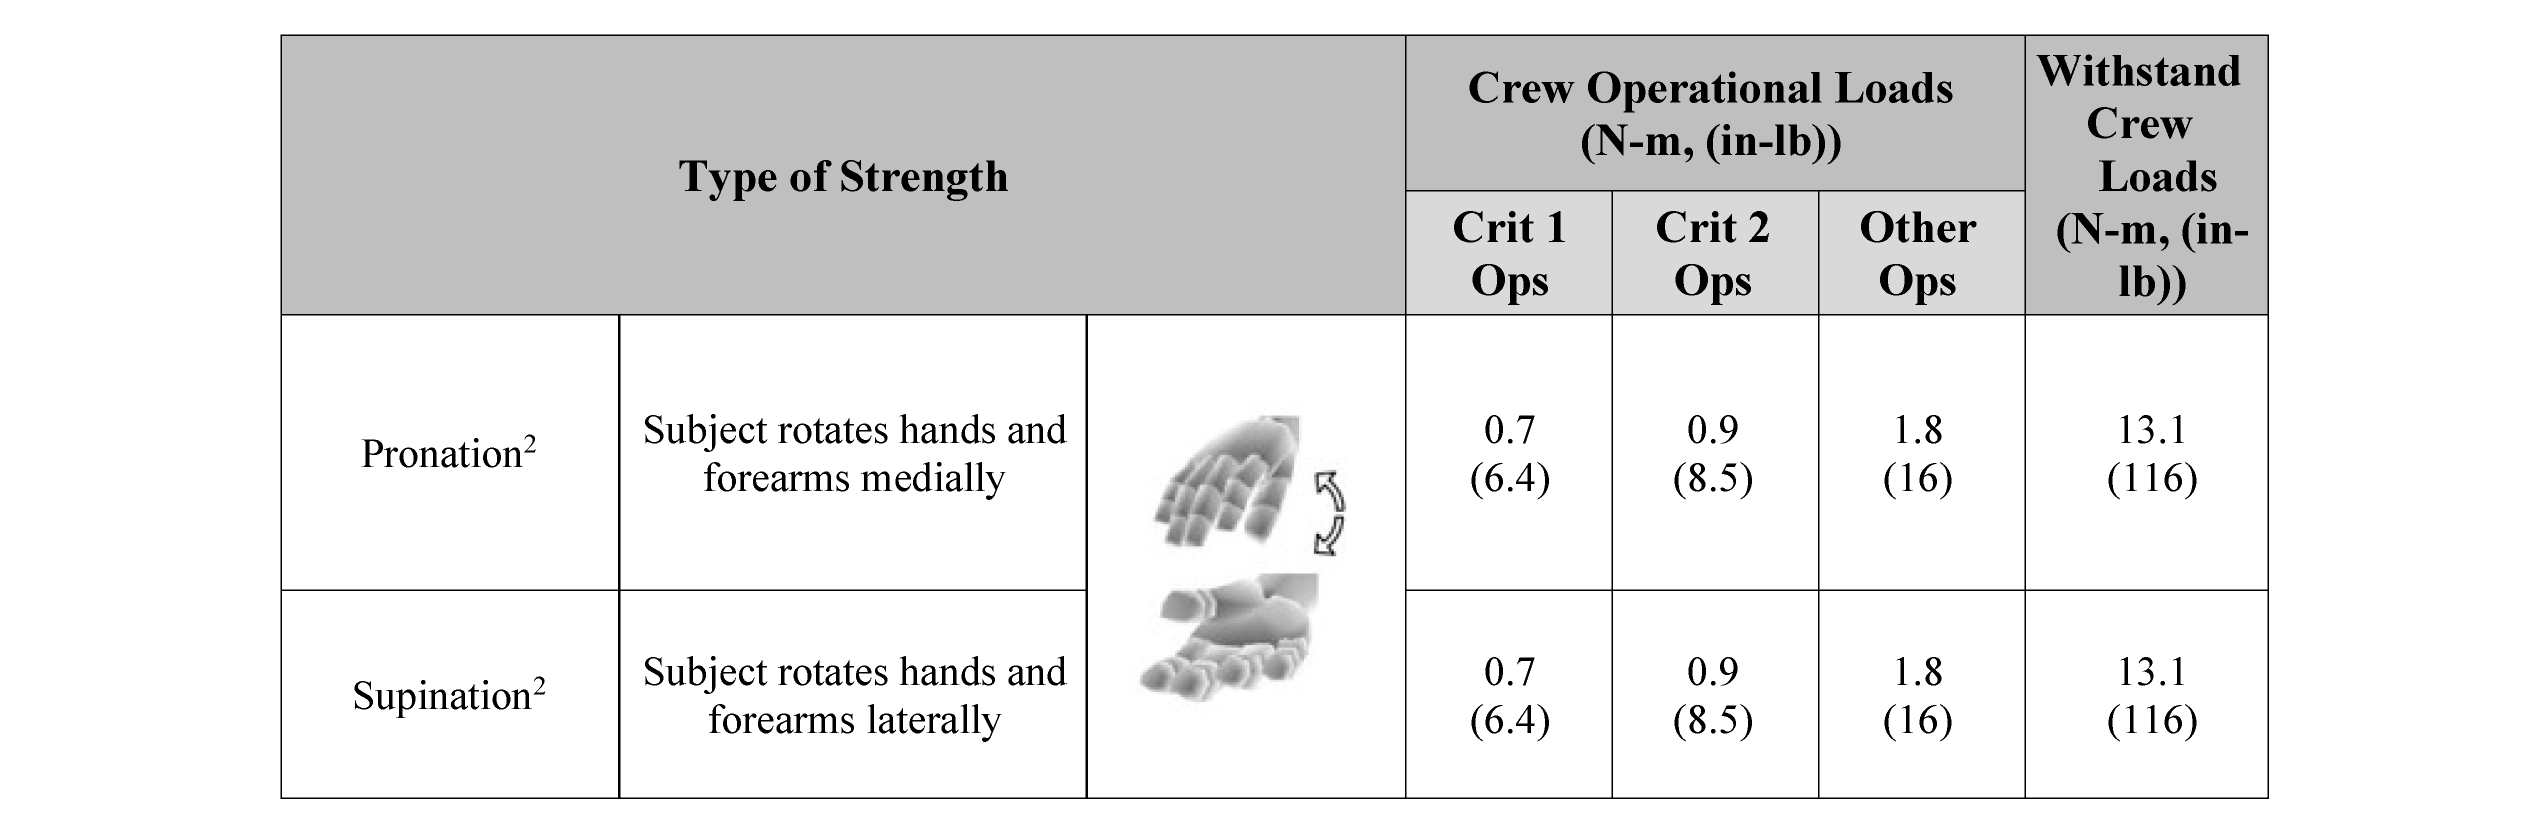
Table E.7-5—Crew Loads, Pressurized Suited
(Only for an EVA type suit and not for a launch and entry type suit, due to extreme difficulty of the LEA suit to operate under pressurized condition)
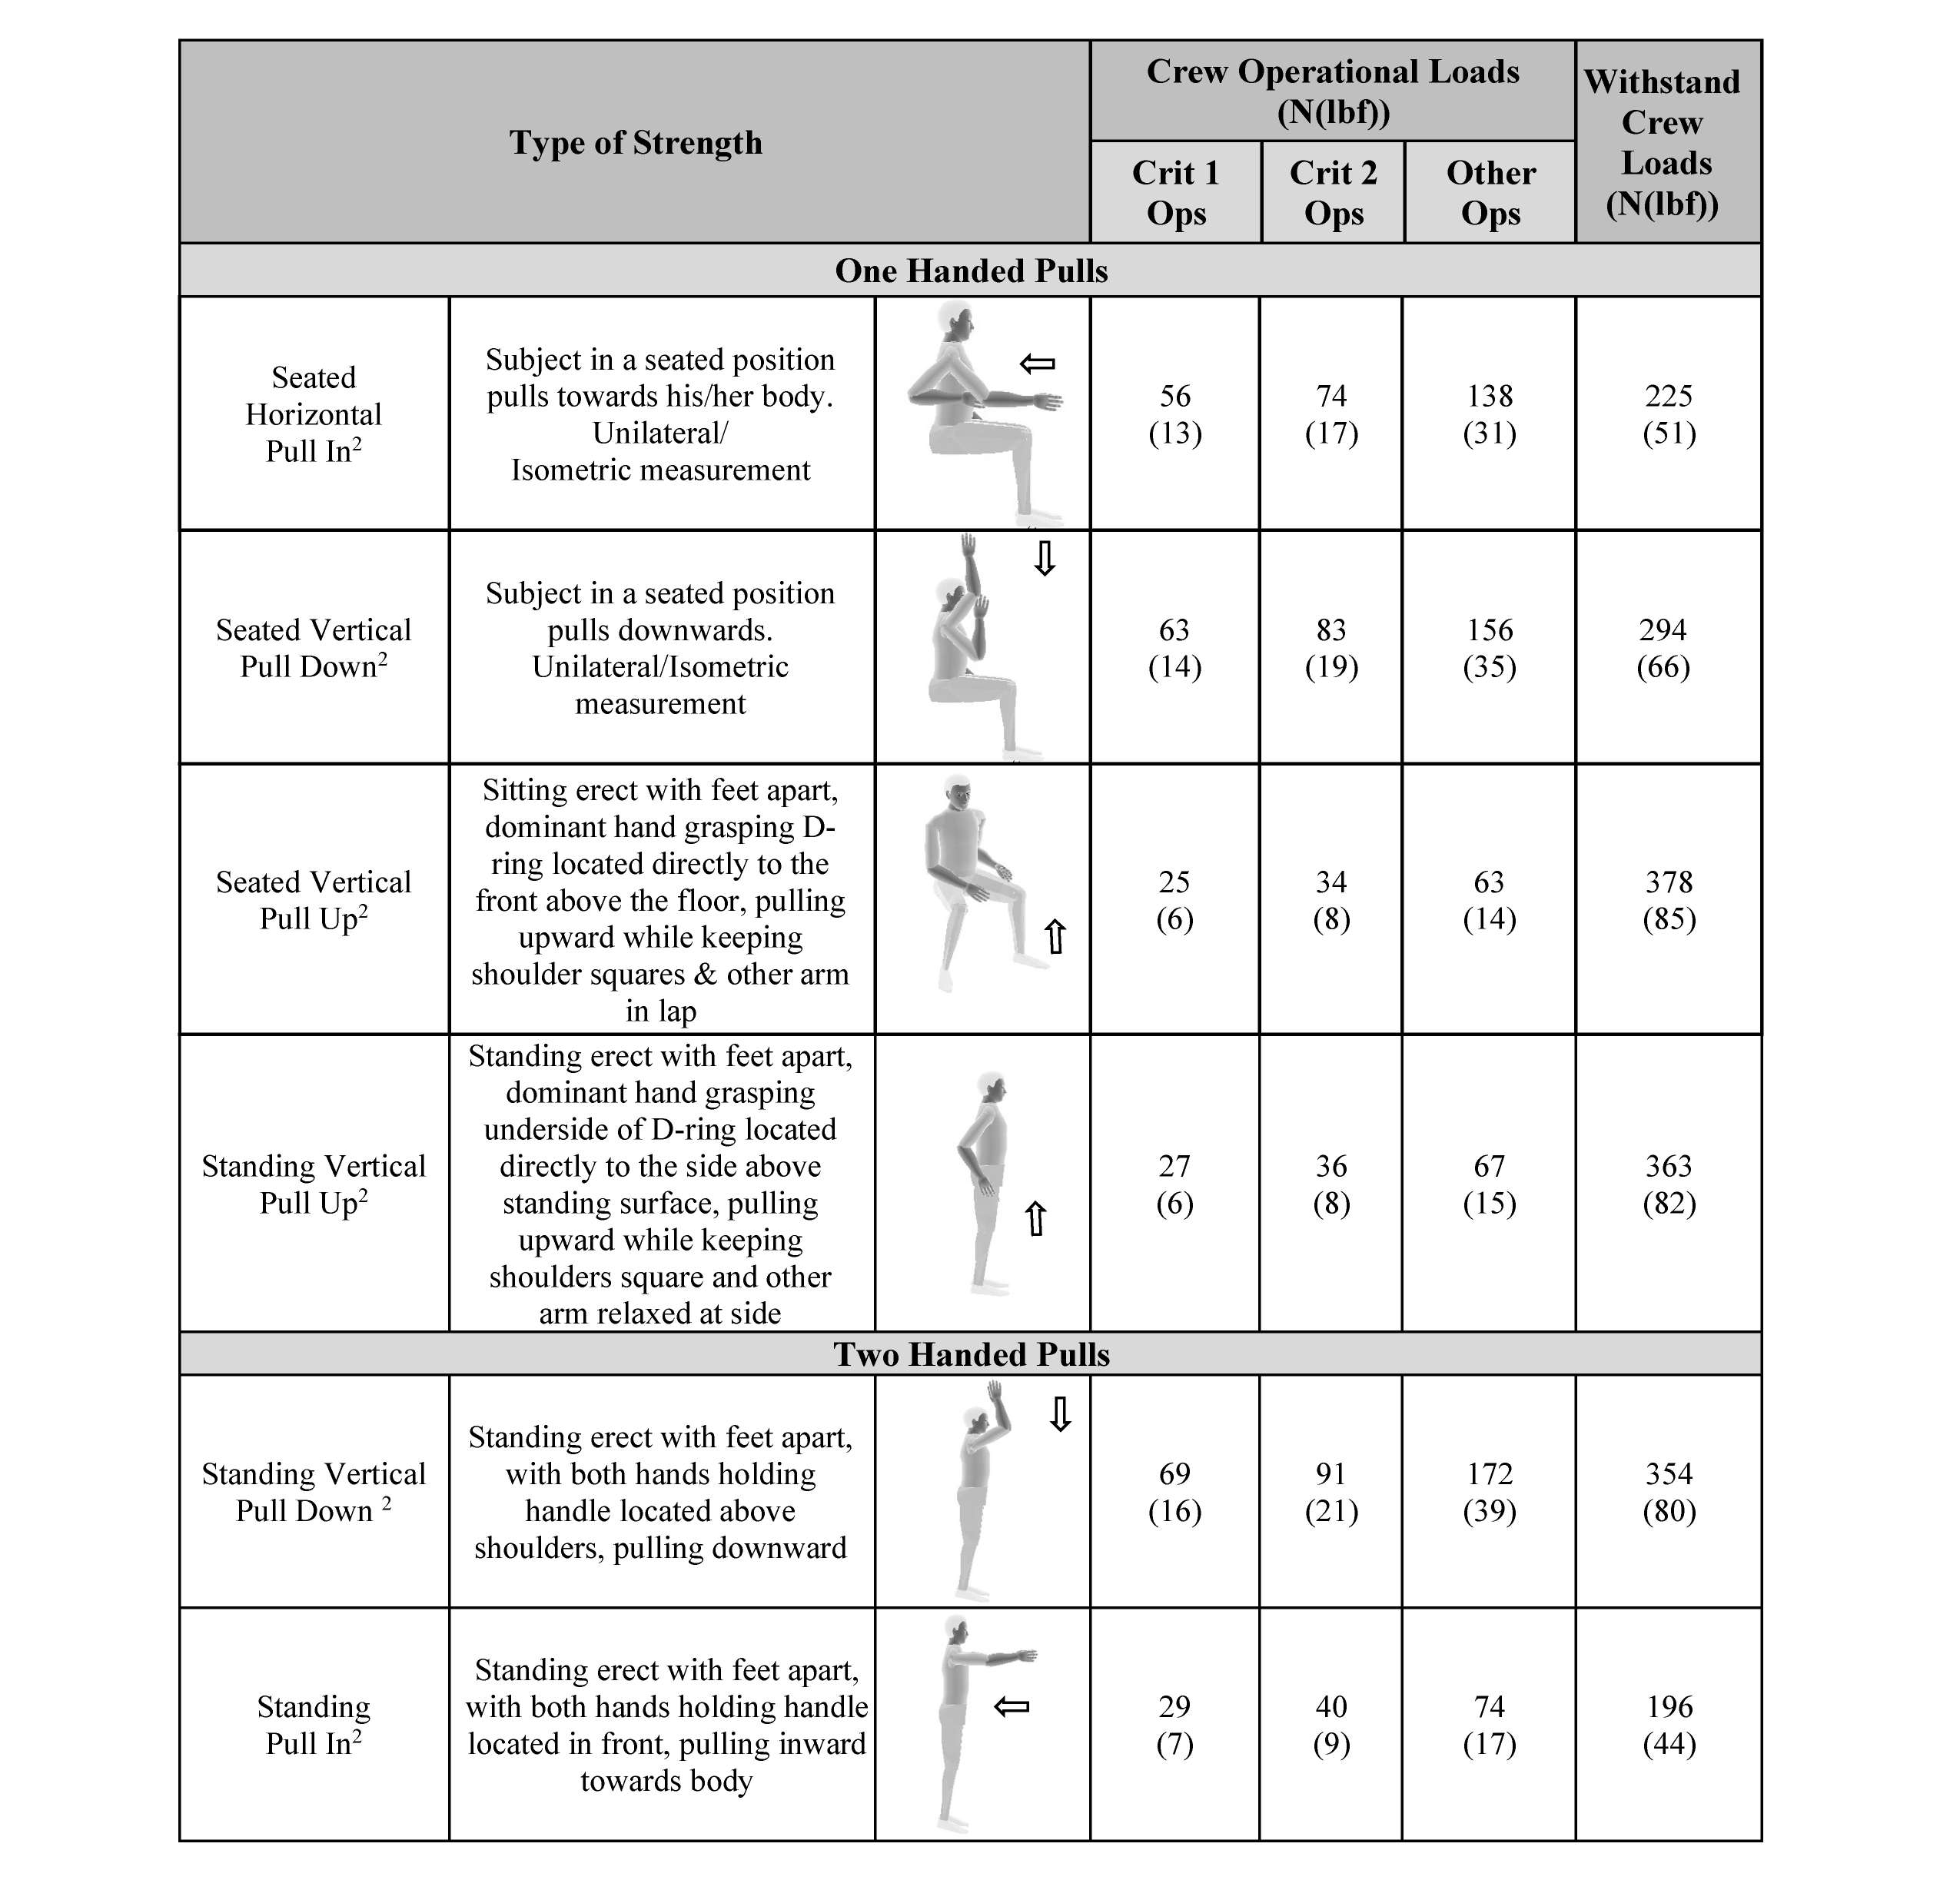
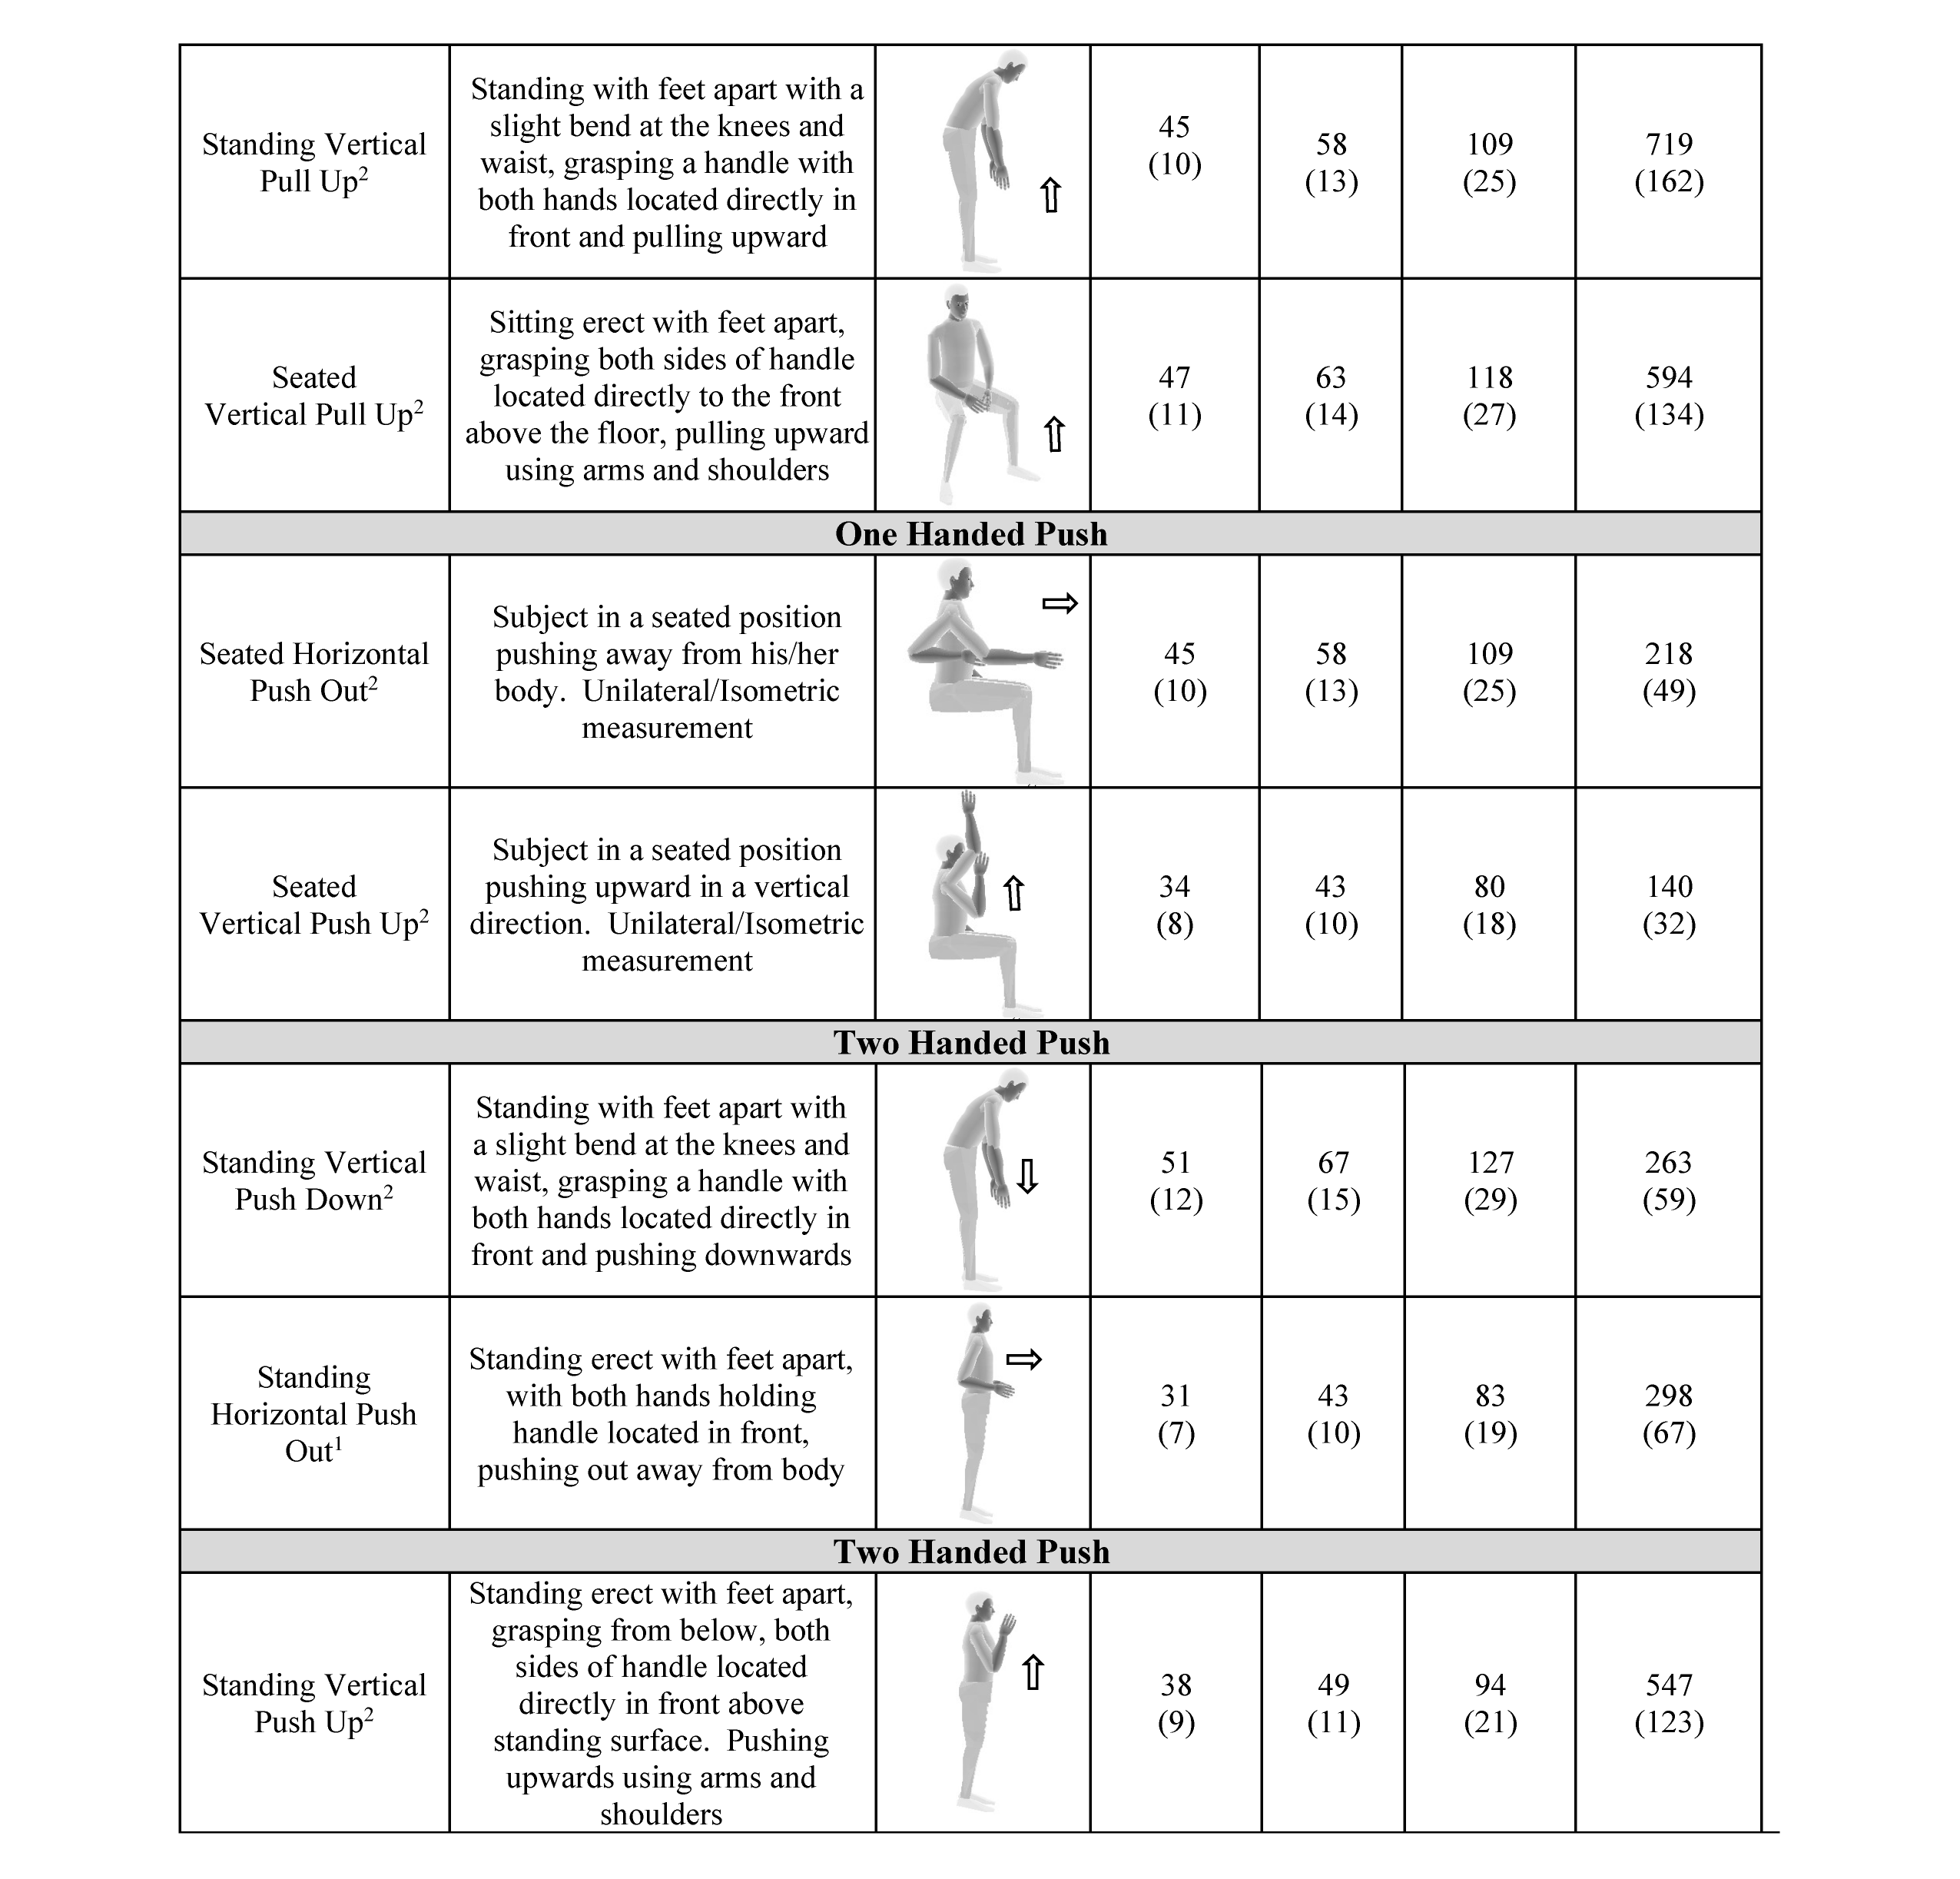
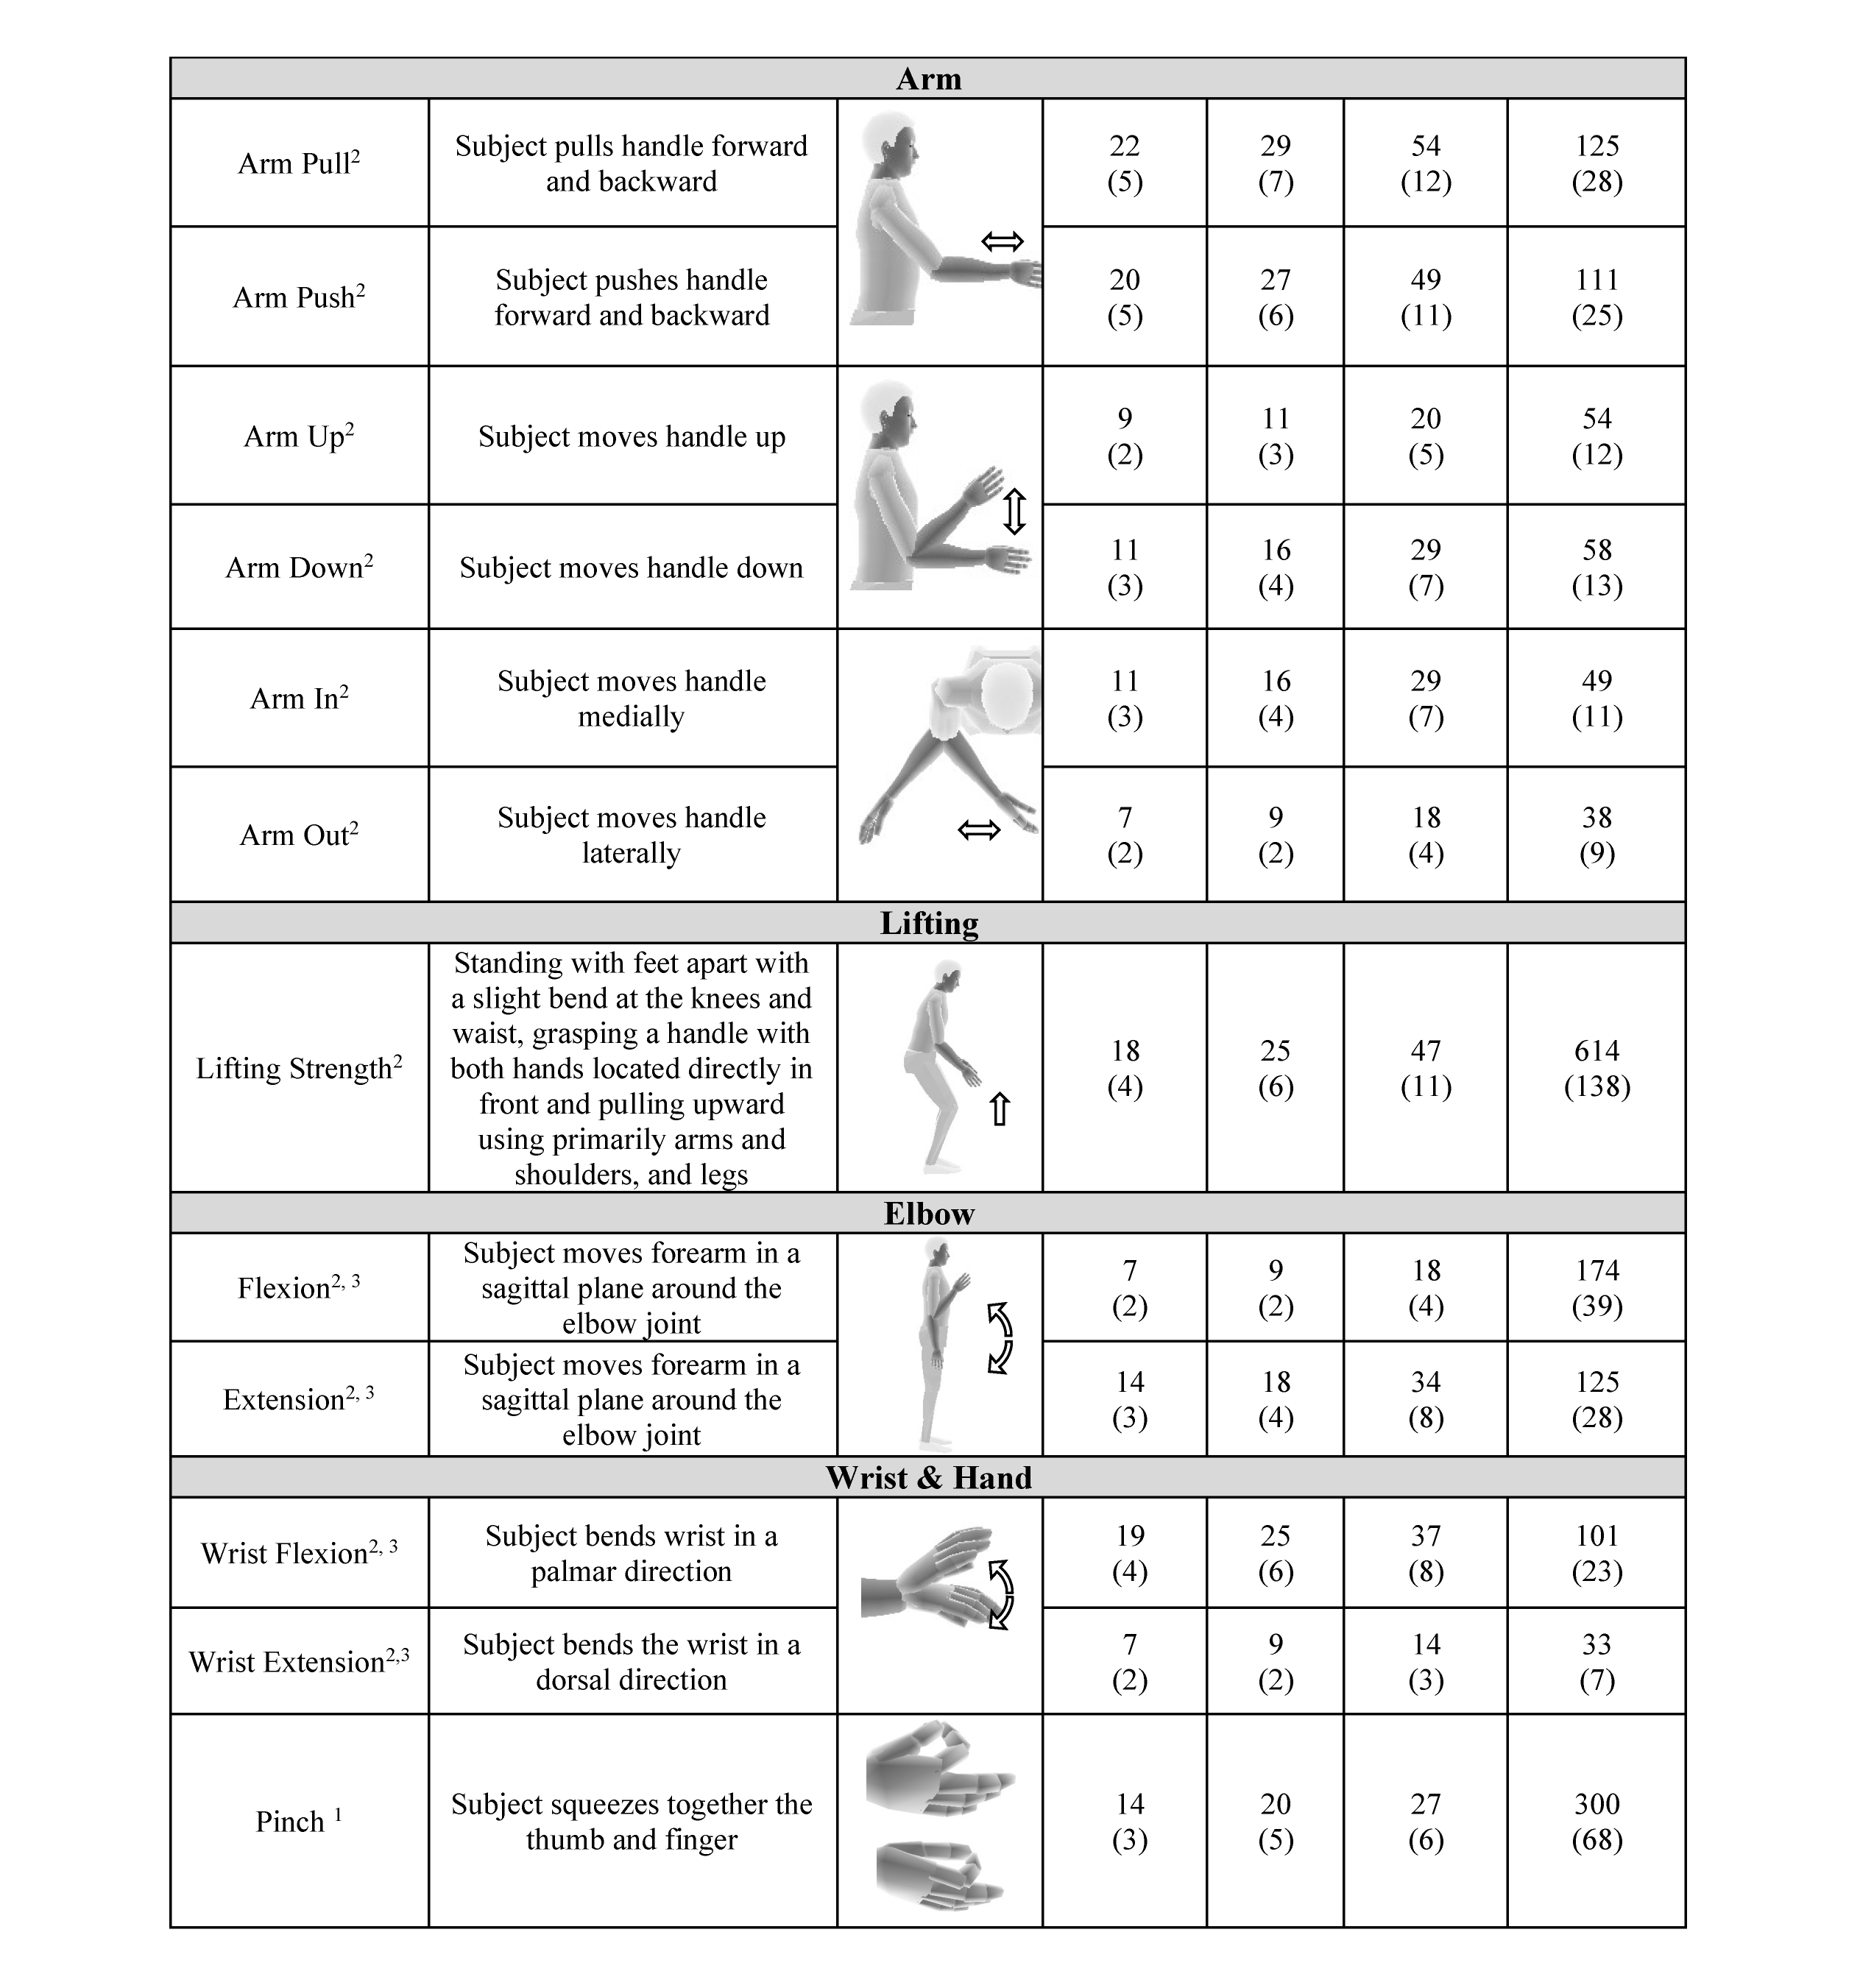
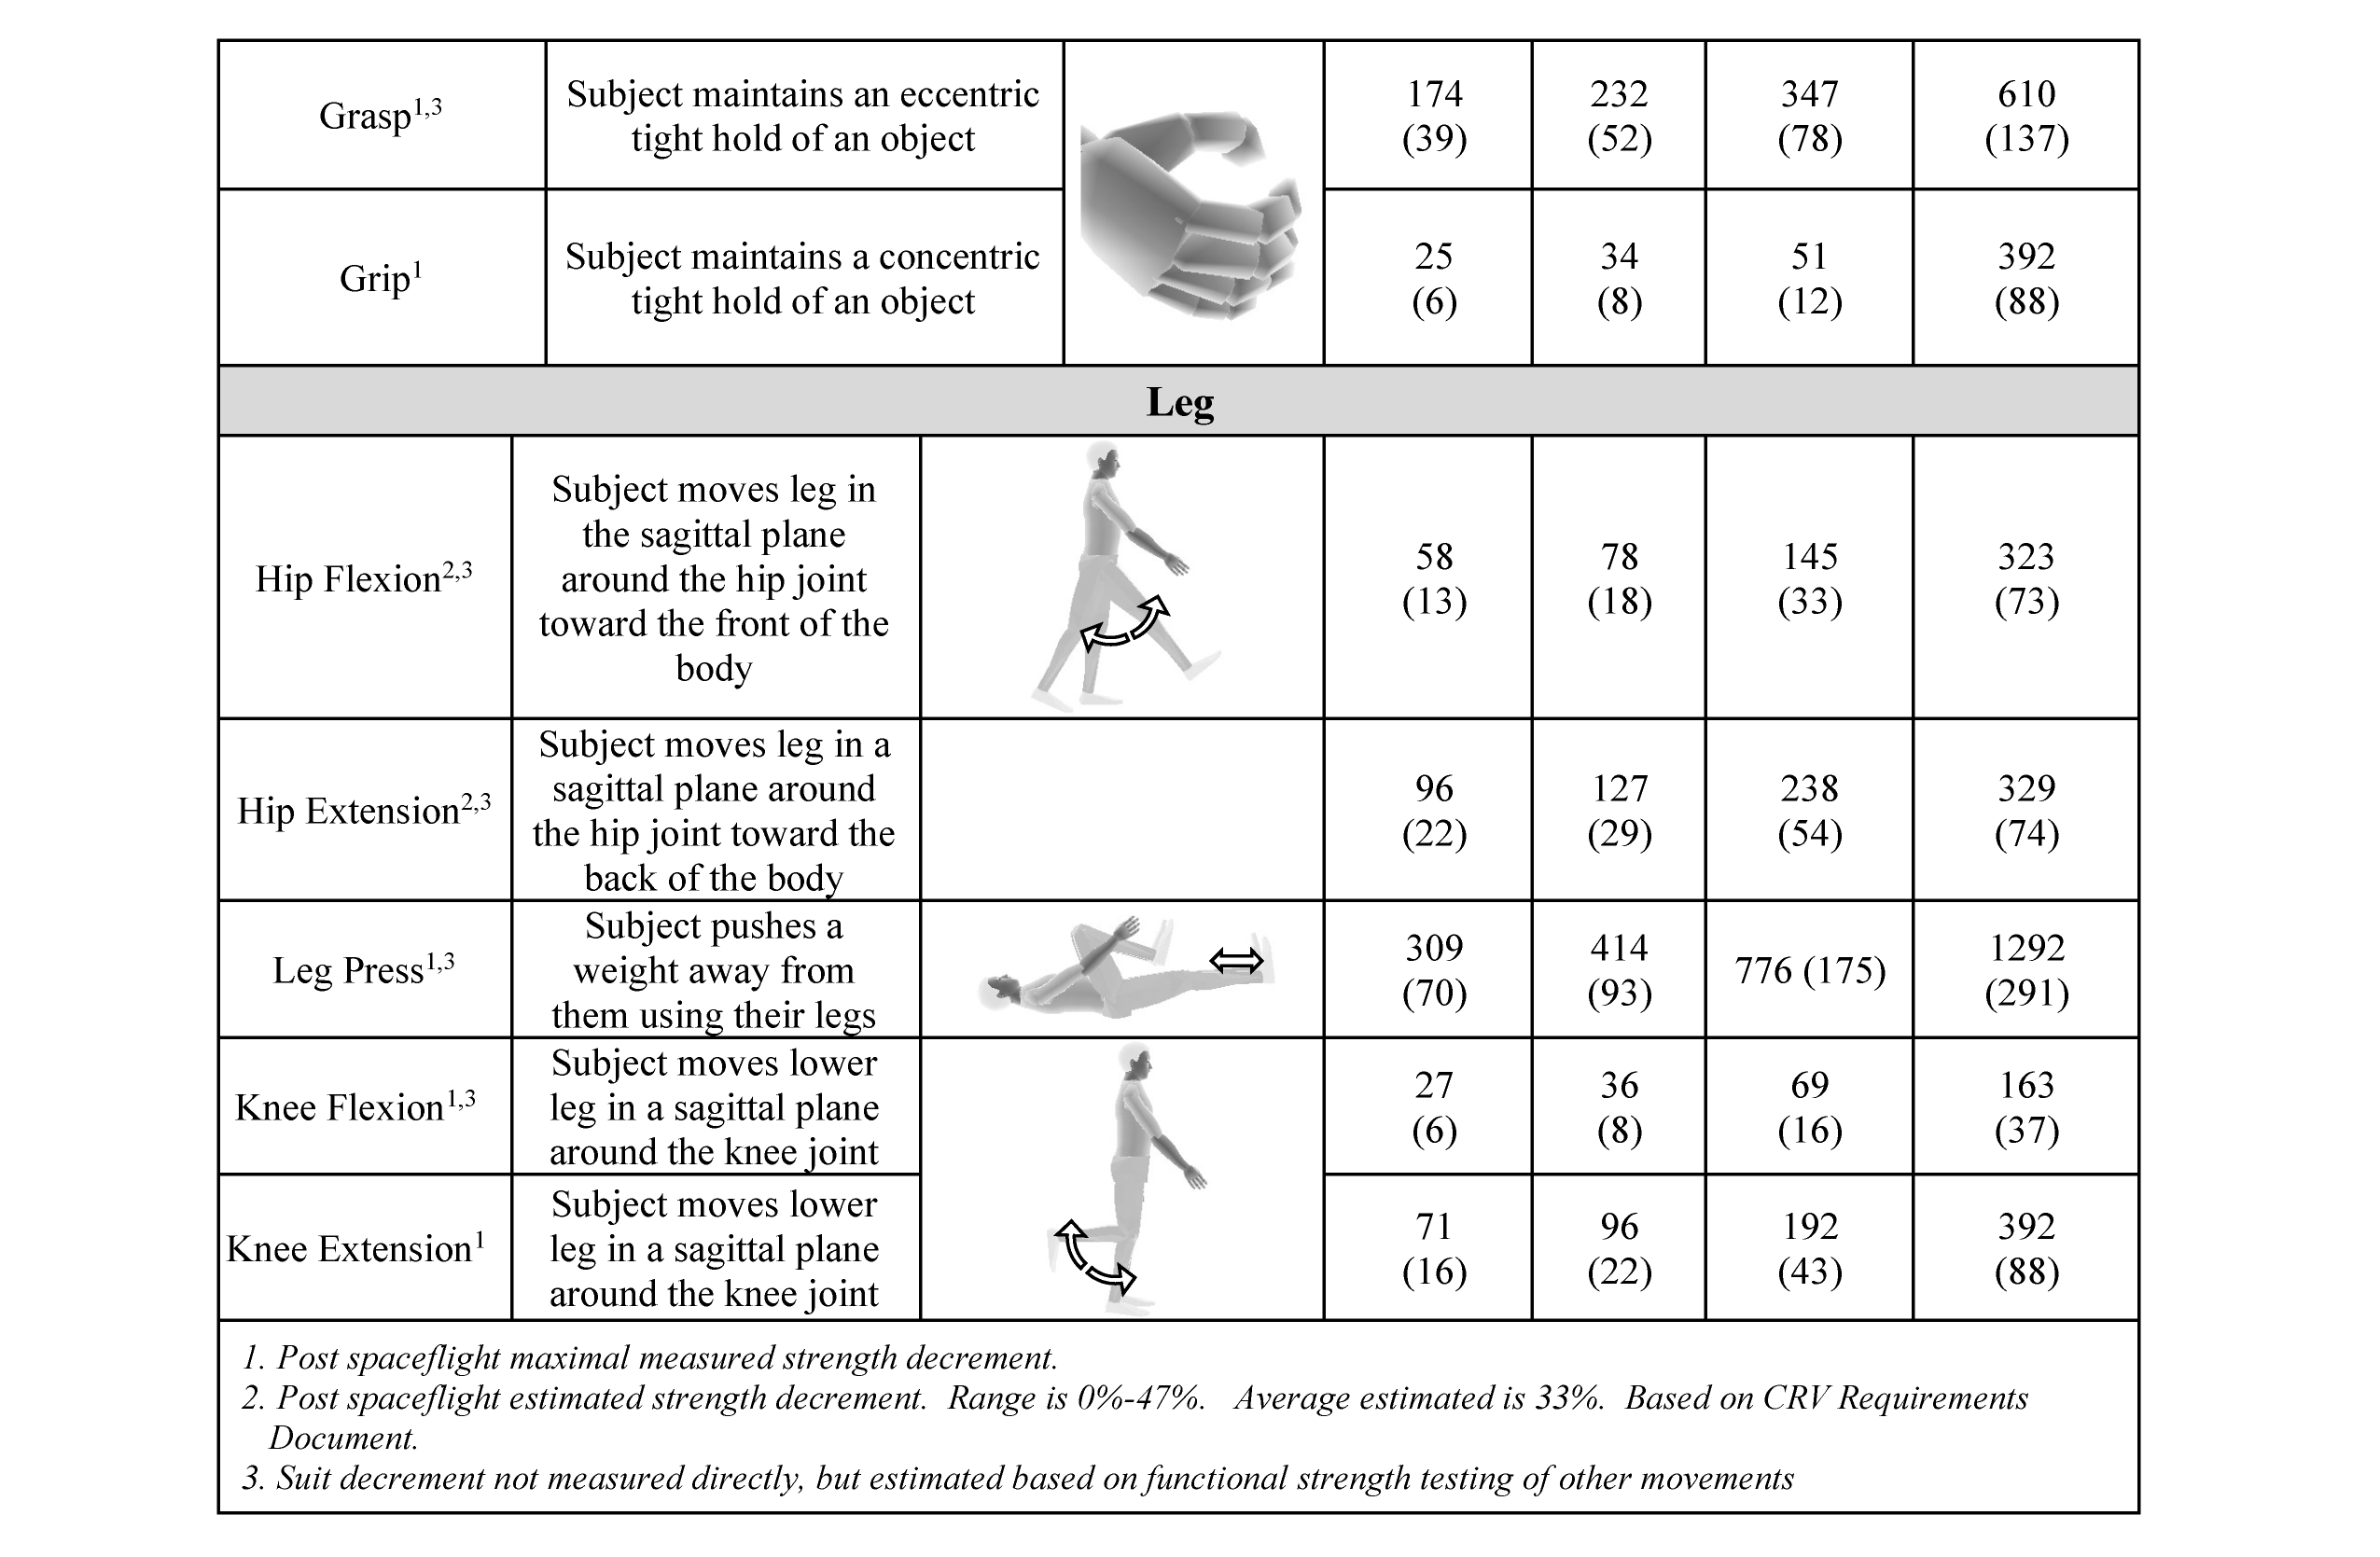
Table E.7-6—Torque Values Pronation and Supination, Pressurized Suited