


Lee esta nota de prensa en español aquí.
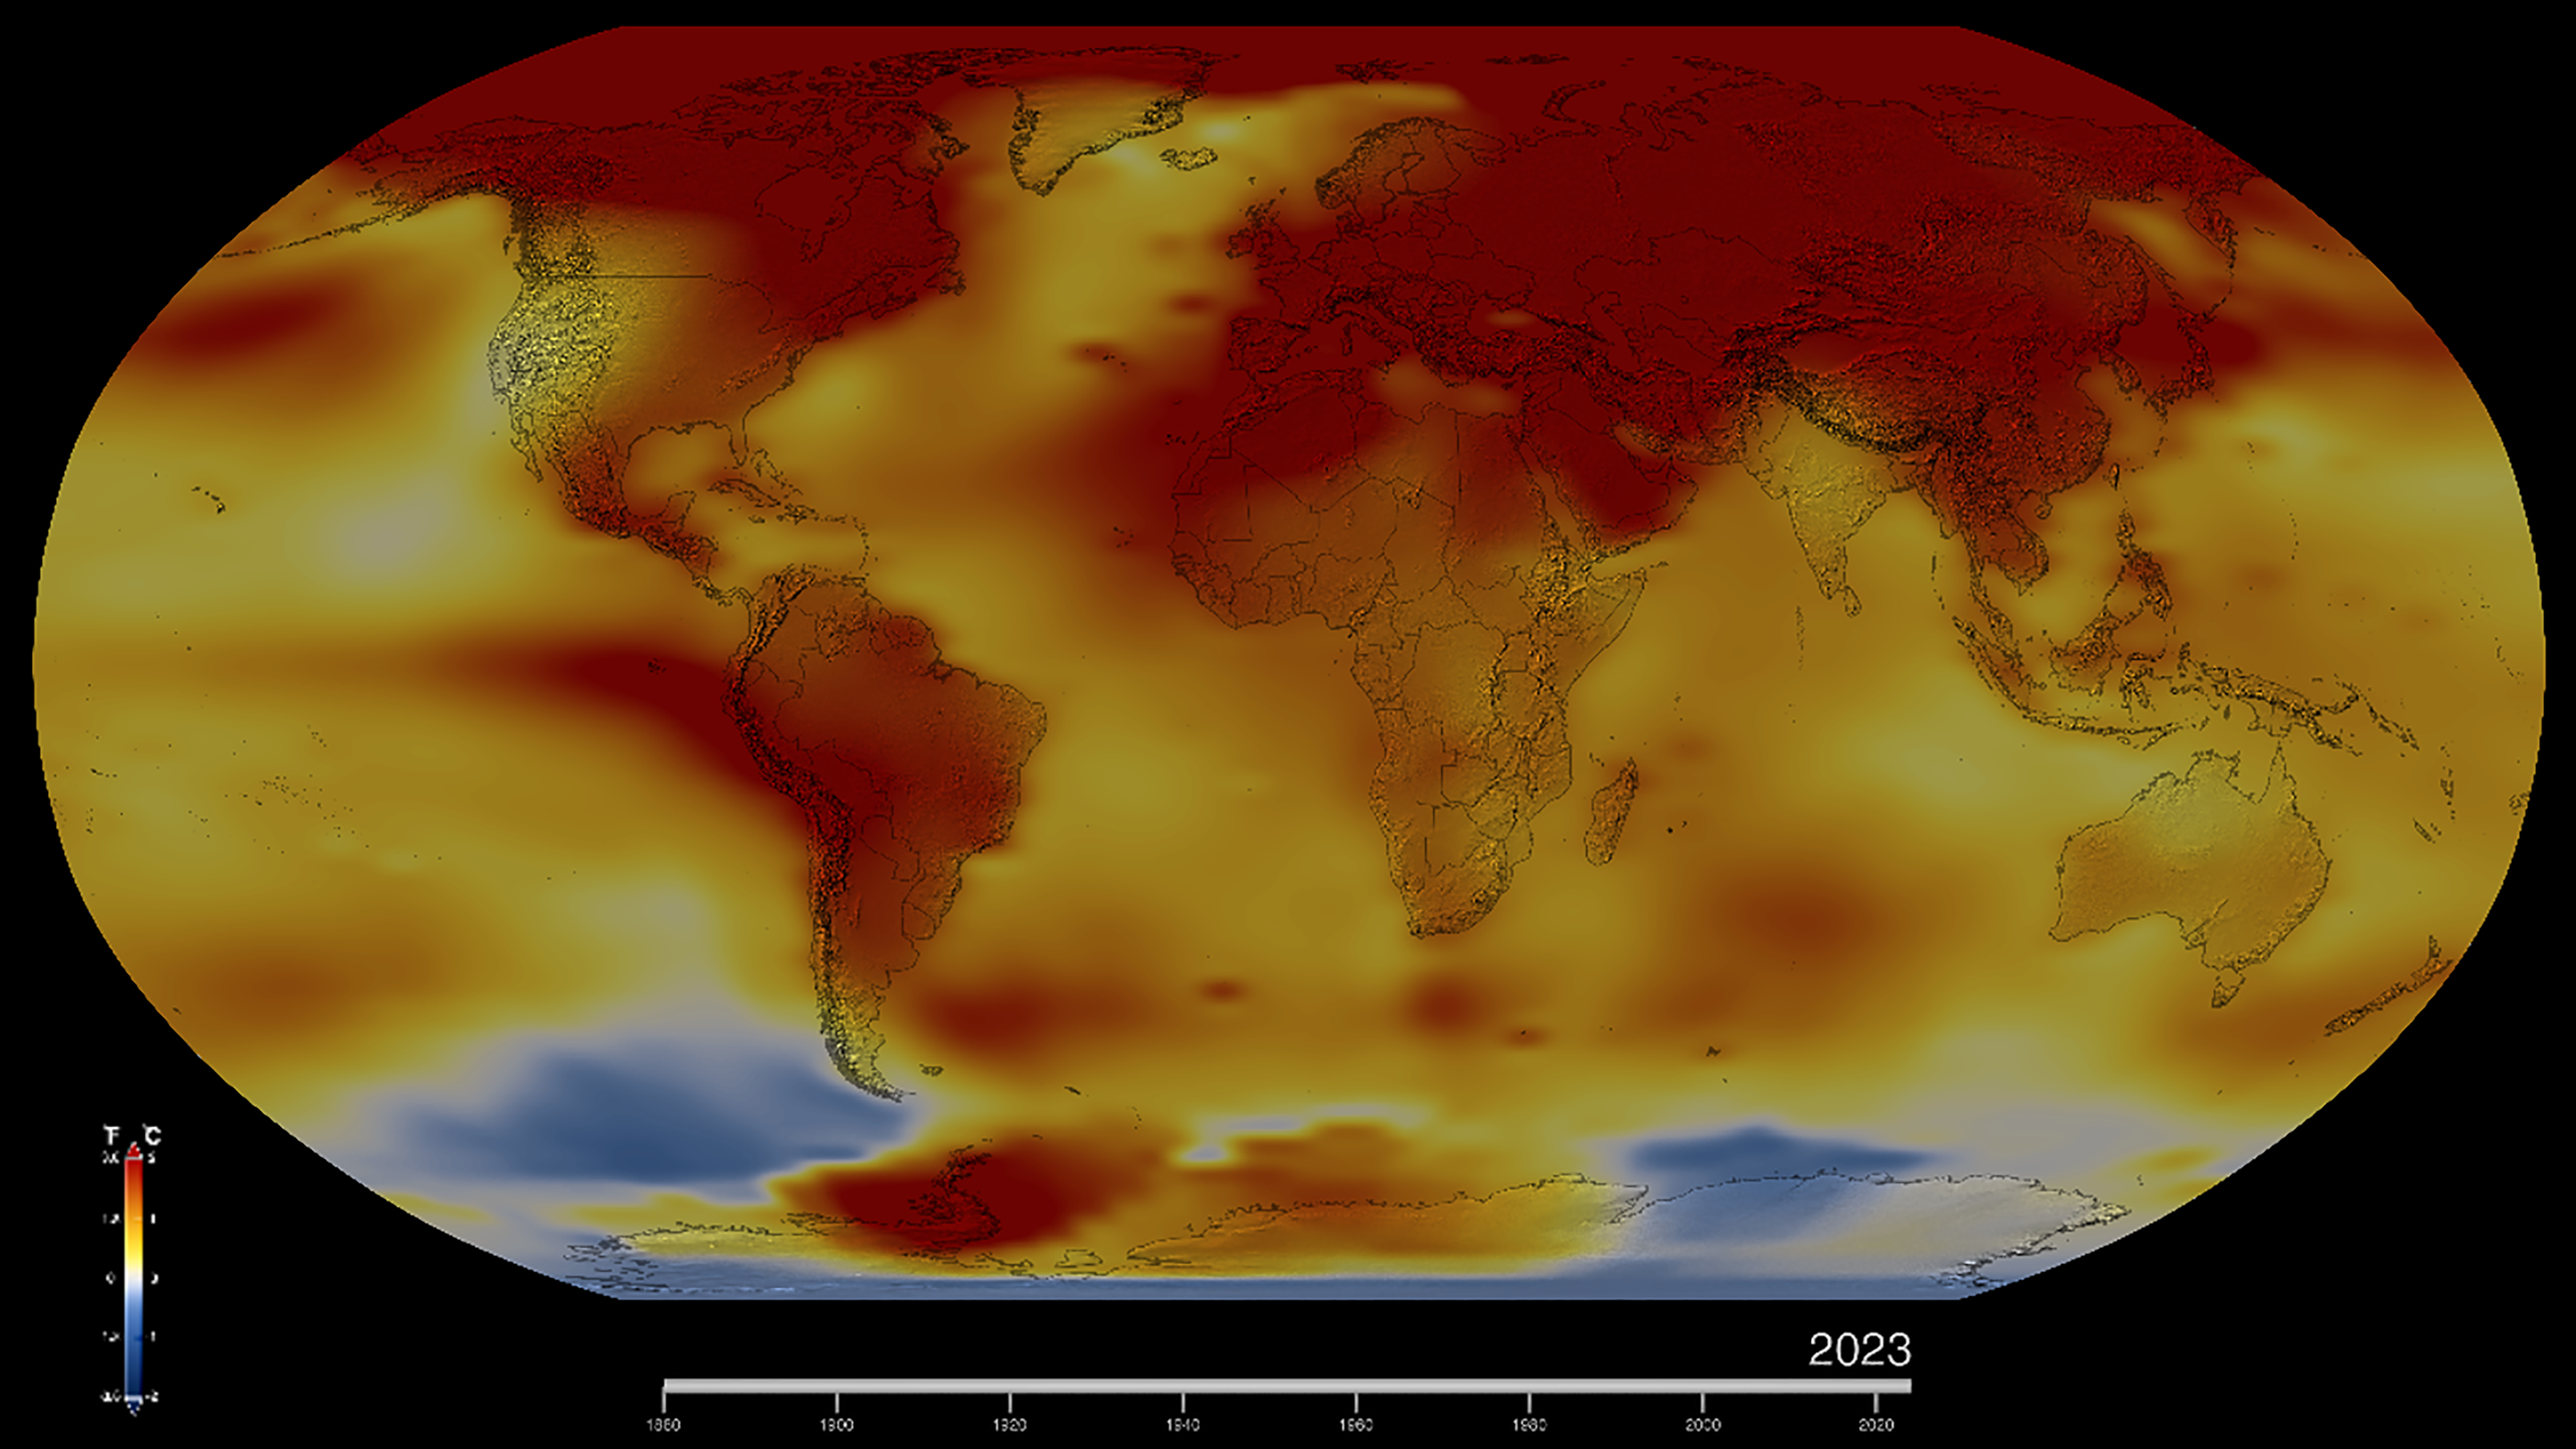
Earth’s average surface temperature in 2023 was the warmest on record, according to an analysis by NASA. Global temperatures last year were around 2.1 degrees Fahrenheit (1.2 degrees Celsius) above the average for NASA’s baseline period (1951-1980), scientists from NASA’s Goddard Institute for Space Studies (GISS) in New York reported.
“NASA and NOAA’s global temperature report confirms what billions of people around the world experienced last year; we are facing a climate crisis,” said NASA Administrator Bill Nelson. “From extreme heat, to wildfires, to rising sea levels, we can see our Earth is changing. There’s still more work to be done, but President Biden and communities across America are taking more action than ever to reduce climate risks and help communities become more resilient – and NASA will continue to use our vantage point of space to bring critical climate data back down to Earth that is understandable and accessible for all people. NASA and the Biden-Harris Administration are working to protect our home planet and its people, for this generation – and the next.”
In 2023, hundreds of millions of people around the world experienced extreme heat, and each month from June through December set a global record for the respective month. July was the hottest month ever recorded. Overall, Earth was about 2.5 degrees Fahrenheit (or about 1.4 degrees Celsius) warmer in 2023 than the late 19th-century average, when modern record-keeping began.
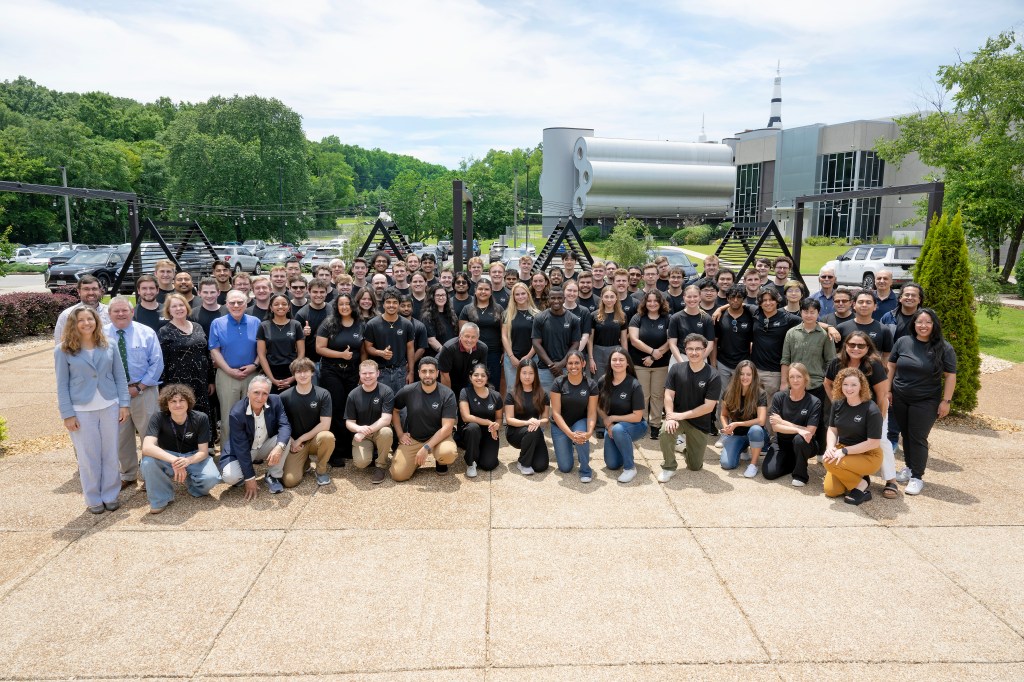
Credit: NASA/Kathleen Gaeta
“The exceptional warming that we’re experiencing is not something we’ve seen before in human history,” said Gavin Schmidt, director of GISS. “It’s driven primarily by our fossil fuel emissions, and we’re seeing the impacts in heat waves, intense rainfall, and coastal flooding.”
Though scientists have conclusive evidence that the planet’s long-term warming trend is driven by human activity, they still examine other phenomena that can affect yearly or multi-year changes in climate such as El Niño, aerosols and pollution, and volcanic eruptions.
Typically, the largest source of year-to-year variability is the El Niño – Southern Oscillation ocean climate pattern in the Pacific Ocean. The pattern has two phases – El Niño and La Niña – when sea surface temperatures along the equator switch between warmer, average, and cooler temperatures. From 2020-2022, the Pacific Ocean saw three consecutive La Niña events, which tend to cool global temperatures. In May 2023, the ocean transitioned from La Niña to El Niño, which often coincides with the hottest years on record.
However, the record temperatures in the second half of 2023 occurred before the peak of the current El Niño event. Scientists expect to see the biggest impacts of El Niño in February, March, and April.

Scientists have also investigated possible impacts from the January 2022 eruption of the Hunga Tonga-Hunga Ha’apai undersea volcano, which blasted water vapor and fine particles, or aerosols, into the stratosphere. A recent study found that the volcanic aerosols – by reflecting sunlight away from Earth’s surface – led to an overall slight cooling of less than 0.2 degrees Fahrenheit (or about 0.1 degrees Celsius) in the Southern Hemisphere following the eruption.
“Even with occasional cooling factors like volcanoes or aerosols, we will continue to break records as long as greenhouse gas emissions keep going up,” Schmidt said. “And, unfortunately, we just set a new record for greenhouse gas emissions again this past year.”
“The record-setting year of 2023 underscores the significance of urgent and continued actions to address climate change,” said NASA Deputy Administrator Pam Melroy. “Recent legislation has delivered the U.S. government’s largest-ever climate investment, including billions to strengthen America’s resilience to the increasing impacts of the climate crisis. As an agency focused on studying our changing climate, NASA’s fleet of Earth observing satellites will continue to provide critical data of our home planet at scale to help all people make informed decisions.”
Open Science in Action
NASA assembles its temperature record using surface air temperature data collected from tens of thousands of meteorological stations, as well as sea surface temperature data acquired by ship- and buoy-based instruments. This data is analyzed using methods that account for the varied spacing of temperature stations around the globe and for urban heating effects that could skew the calculations.
Independent analyses by NOAA and the Hadley Centre (part of the United Kingdom Met Office) concluded the global surface temperatures for 2023 were the highest since modern record-keeping began. These scientists use much of the same temperature data in their analyses but use different methodologies. Although rankings can differ slightly between the records, they are in broad agreement and show the same ongoing long-term warming in recent decades.
Building on a half century of research, observations, and models, the Biden-Harris Administration including NASA and several federal partners recently launched the U.S. Greenhouse Gas Center to make critical climate data readily available to decisionmakers and citizens. The center supports collaboration across U.S. government agencies and the non-profit and private sectors to make air-, ground-, and space-borne data and resources available online.
NASA’s full dataset of global surface temperatures through 2023, as well as details with code of how NASA scientists conducted the analysis, are publicly available from GISS. GISS is a NASA laboratory managed by the Earth Sciences Division of the agency’s Goddard Space Flight Center in Greenbelt, Maryland. The laboratory is affiliated with Columbia University’s Earth Institute and School of Engineering and Applied Science in New York.
For more information on NASA, visit: https://www.nasa.gov.
-end-
Karen Fox / Katherine Rohloff
Headquarters, Washington
202-358-1600
karen.fox@nasa.gov / Katherine.a.rohloff@nasa.gov
Peter Jacobs
NASA Goddard Space Flight Center, Greenbelt, Md
301-286-0535
peter.jacobs@nasa.gov