


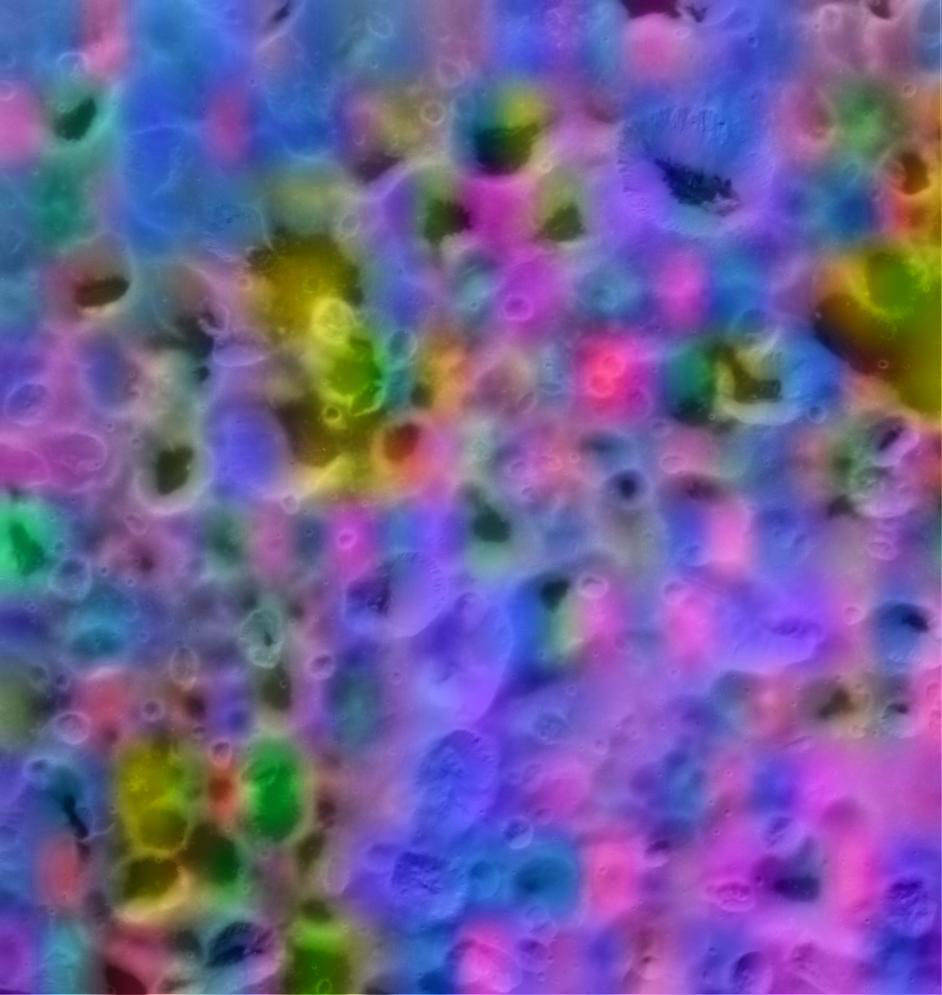
This Cassini image is a color map of the composition of a portion of Saturn's moon Hyperion. In this map, blue shows the maximum exposure of frozen water, red denotes carbon dioxide ice ("dry ice"), magenta indicates regions of water plus carbon dioxide, yellow is a mix of carbon dioxide and an unidentified material.
This Cassini image is a color map of the composition of a portion of Saturn’s moon Hyperion.
In this map, blue shows the maximum exposure of frozen water, red denotes carbon dioxide ice (“dry ice”), magenta indicates regions of water plus carbon dioxide, yellow is a mix of carbon dioxide and an unidentified material. The map was made with data from the Visual and Infrared Mapping Spectrometer aboard the Cassini spacecraft during its flyby of Hyperion in September 2005.Image credit: NASA/JPL/University of Arizona/Ames/Space Science Institute