Bill (was 02L/91L) – Gulf of Mexico
Credits: NASA/NOAA GOES Project
The remnants of Tropical Depression Bill soaked a large part of the U.S. from Texas to Washington, D.C. before moving into the Atlantic Ocean. NOAA’s GOES-East satellite captured the movement over several days.
An animation of images captured June 20 to 22 from NOAA’s GOES-East satellite was created by the NASA/NOAA GOES Project at NASA’s Goddard Space Flight Center, Greenbelt, Maryland. The animation shows Tropical Depression Bill’s remnants moving through the Ohio Valley and moving off the northeastern U.S. The animation includes visible and infrared imagery taken from the GOES-East satellite.
The National Weather Service Weather Prediction Center in College Park, Maryland provided the following list of total rainfall in selected cities as of 2 a.m. EDT on Sunday, June 21.
…ARKANSAS…
4.42 ROGERS 2.1 SE
4.27 BENTONVILLE
4.03 FAYETTEVILLE/SPRINGDALE
…WASHINGTON DC…
2.37 WASHINGTON/NATIONAL ARPT
…ILLINOIS…
5.14 COOKS MILL
5.01 SCOTT AFB/BELLEVILLE
4.89 SULLIVAN 3 S
4.83 CARBONDALE/MURPHYSBORO
…INDIANA…
6.72 GRISSOM AFB/PERU
5.27 EVANSVILLE RGNL ARPT
4.96 SANDBORN
4.87 BLOOMINGTON/MONROE CO. ARPT
2.57 INDIANAPOLIS INTL ARPT
…KANSAS…
3.64 COFFEYVILLE MUNI ARPT
1.79 OLATHE/JOHNSON
…KENTUCKY…
3.54 HENDERSON CITY
2.12 FRANKFORT/CAPITAL CITY ARPT
1.90 PADUCAH/BARKLEY
1.14 LEXINGTON/BLUE GRASS FIELD
…LOUISIANA…
4.79 SHREVEPORT RGNL ARPT
3.84 BOSSIER CITY 6.7 NNW
…MARYLAND…
2.50 CHELTENHAM 1 NNE
2.14 SALISBURY RGNL ARPT
1.92 BALTIMORE/WASH INTL ARPT
1.81 ANDREWS AFB/CAMP SPRINGS
…MISSOURI…
8.25 FORDLAND 4 WNW
7.93 BATTLEFIELD
7.54 OZARK 3 N
6.00 SPRINGFIELD 7 E
…OHIO…
5.11 LIMA/ALLEN CO. APRT
3.51 AKRON-CANTON REGIONAL ARPT
3.46 WILMINGTON/CINCINNATI WFO
3.21 DOWNTOWN COLUMBUS 2 WNW
3.01 DAYTON/JAMES M COX AIRPORT
2.90 CINCINNATI
…OKLAHOMA…
12.53 HEALDTON 3 E
11.52 NEWPORT
10.09 BURNEYVILLE
7.35 PAULS VALLEY MUNI APRT
3.61 NORMAN 3.4 SE
2.64 OKLAHOMA CITY 11.5 S
…PENNSYLVANIA…
1.93 HARRISBURG/CAPITAL CITY ARPT
1.68 JOHNSTOWN/CAMBRIA CO. ARPT
…TEXAS…
12.50 MONTAGUE
11.77 GANADO 1.5 W
9.51 KIRBYVILLE 1.5 SE
9.03 ALICE INTL ARPT
6.98 LUFKIN/ANGELINA CO ARPT
6.14 CORPUS CHRISTI
5.80 AUSTIN 4.2 ESE
2.91 SAN ANTONIO INTL ARPT
2.51 HOUSTON/INTERCONTINENTAL
…VIRGINIA…
3.85 FORT BELVOIR/DAVISON AFB
2.71 FAIRFAX 1 SE
1.11 WASHINGTON/DULLES INTL ARPT
1.08 RICHMOND
…WEST VIRGINIA…
1.68 PARKERSBURG/WILSON
1.32 MORGANTOWN/HART FIELD
Rob Gutro
NASA’s Goddard Space Flight Center
June 19, 2015 – NASA Sees Tropical Depression Bill Tracking Through U.S.
Credits: NASA/NOAA GOES Project
Tropical Depression Bill continues to be a soaker as it travels in an east-northeasterly direction from Arkansas toward the Ohio Valley. NASA’s Aqua satellite and NOAA’s GOES-East satellites provided a look at the extent and the movement of the storm.
The MODIS instrument aboard NASA’s Aqua satellite captured a visible image of Tropical Depression Bill’s remnants over the central United States on June 18 at 19:45 UTC (3:45 p.m. EDT). At the time Aqua passed overhead, Bill’s center was located in northeastern Oklahoma. The image showed that moisture from the Gulf of Mexico was still streaming into the center of circulation from the south and east of the center.
An animation of NOAA’s GOES-East satellite’s infrared and visible imagery taken from June 17 through June 19 showed Tropical Storm Bill’s movement after landfall in eastern Texas. As Bill progressed on an east-northeasterly track, the clouds associated with the depression stretched out along a cold front that extended from southern New England west to Oklahoma. The animation was created by NASA/NOAA GOES Project at the NASA Goddard Space Flight Center in Greenbelt, Maryland.
Bill Still a Tropical Depression
At 11 a.m. EDT on Friday, June 19, the National Weather Service Weather Prediction Center (WPC) in College Park, Maryland issued an update on the progression of Tropical Depression Bill is it continued moving through the eastern two-thirds of the U.S. At that time, the center of the depression was tracking through northern Arkansas. It was centered near 36.3 North latitude and 91.4 West longitude, about 117 miles (188 km) northeast of Little Rock, Arkansas. Bill had maximum sustained winds near 25 mph (40 kph) and was moving to the east-northeast at 20 mph (32 kph). Minimum central pressure is 1006 millibars.
Bill Triggers Many Watches and Warnings
Flash flooding is a main concern as Tropical Depression Bill continues to track to the east-northeast. Moderate to heavy rainfall continues with two separate axes of active convection.
The WPC noted “Flash flood warnings are currently in effect across sections of southern Missouri and eastern Illinois. Meanwhile, flood warnings extend across portions of eastern and central Texas, northeastern Oklahoma, and Louisiana and into parts of Arkansas, Missouri and Illinois. Farther north and east, flood warnings are in effect across sections of Illinois, Indiana, and Ohio. Flash Flood and Flood Watches are spread across much of the lower and middle Mississippi valleys and Ohio Valley.
For specific area forecasts, watches and warnings, visit the National Weather Service website: www.weather.gov.
WPC expects Bill to track east-northeastward toward the Ohio Valley over the next couple of days. As Bill moves, it is expected to gradually lose tropical characteristics as it begins to interact with slightly cooler and drier air to the north. Over the next couple of days, all areas in Bill’s path should expect a soggy greeting.
NWS STORM TOTAL RAINFALL IN INCHES THROUGH 8 AM EDT, JUNE 19, 2015
…ARKANSAS…
4.42…ROGERS 2.1 SE
3.72…DELIGHT 2.2 WNW
…ILLINOIS…
4.89…SULLIVAN 3 S
4.50…ALLENVILLE 1 S
…INDIANA…
3.70…MOROCCO
2.87…NEW ROSS 2 E
…KANSAS…
3.64…COFFEYVILLE MUNI ARPT
…LOUISIANA…
4.79…SHREVEPORT RGNL ARPT
3.84…BOSSIER CITY 6.7 NNW
…MISSOURI…
5.50…SPRINGFIELD 7 S
5.48…MARSHFIELD 3.6 S
…OKLAHOMA…
12.53…HEALDTON 3 E
11.52…NEWPORT
…TEXAS…
12.50…MONTAGUE
11.77…GANADO 1.5 W
Rob Gutro
NASA’s Goddard Space Flight Center
June 18, 2015 – NASA Provides Many Views of Tropical Depression Bill
Credits: NASA/NOAA GOES Project
NASA provided four different views of Tropical Depression Bill as it continued traveling through the south-central U.S. and into the Ohio Valley. NASA’s Aqua and Terra satellite provided infrared and visible imagery while NASA/NOAA’s GOES Project animated NOAA’s GOES-East satellite imagery to show the storm’s progression since landfall. The Global Precipitation Measurement or GPM core satellite also showed rainfall estimates and locations.
On June 18, the National Weather Service, Weather Prediction Center (NWS/WPC) noted that flood and flash flood watches and warnings are in effect for eastern Texas and Oklahoma and into the middle Mississippi River Valley and portions of the western Ohio Valley.
An animation of GOES-East satellite imagery from June 16 to 18 was created at NASA/NOAA’s GOES Project at the NASA Goddard Space Flight Center in Greenbelt, Maryland. The animation showed the Tropical Depression Bill moving over Texas, Oklahoma and moving into the Ohio Valley.
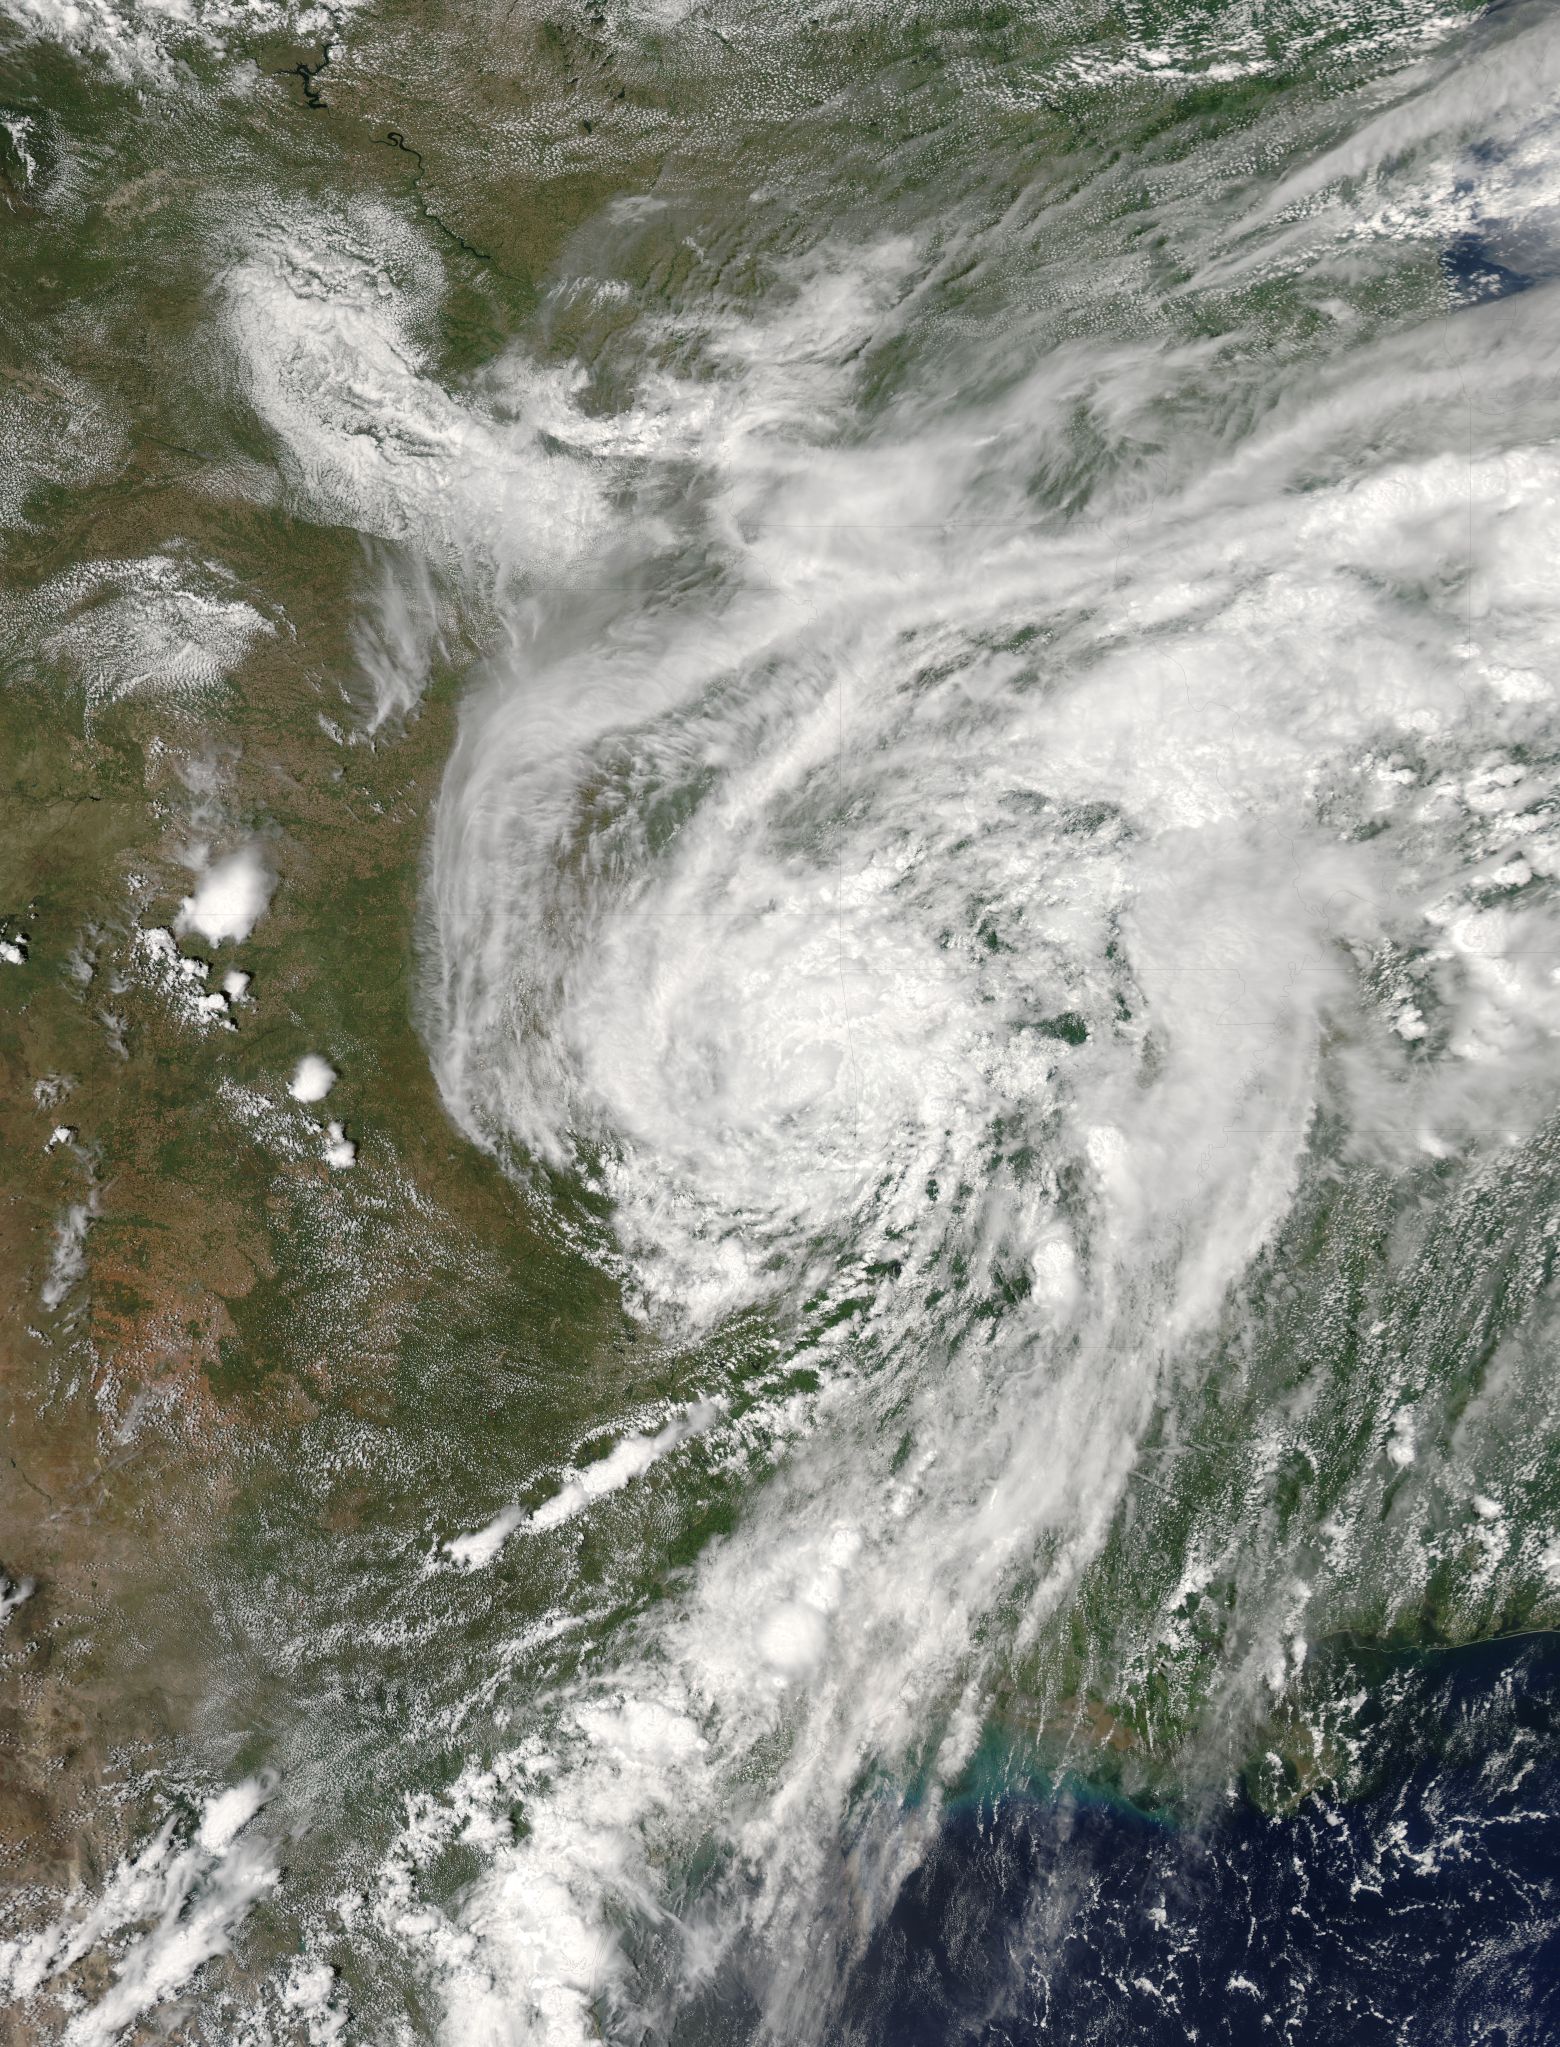
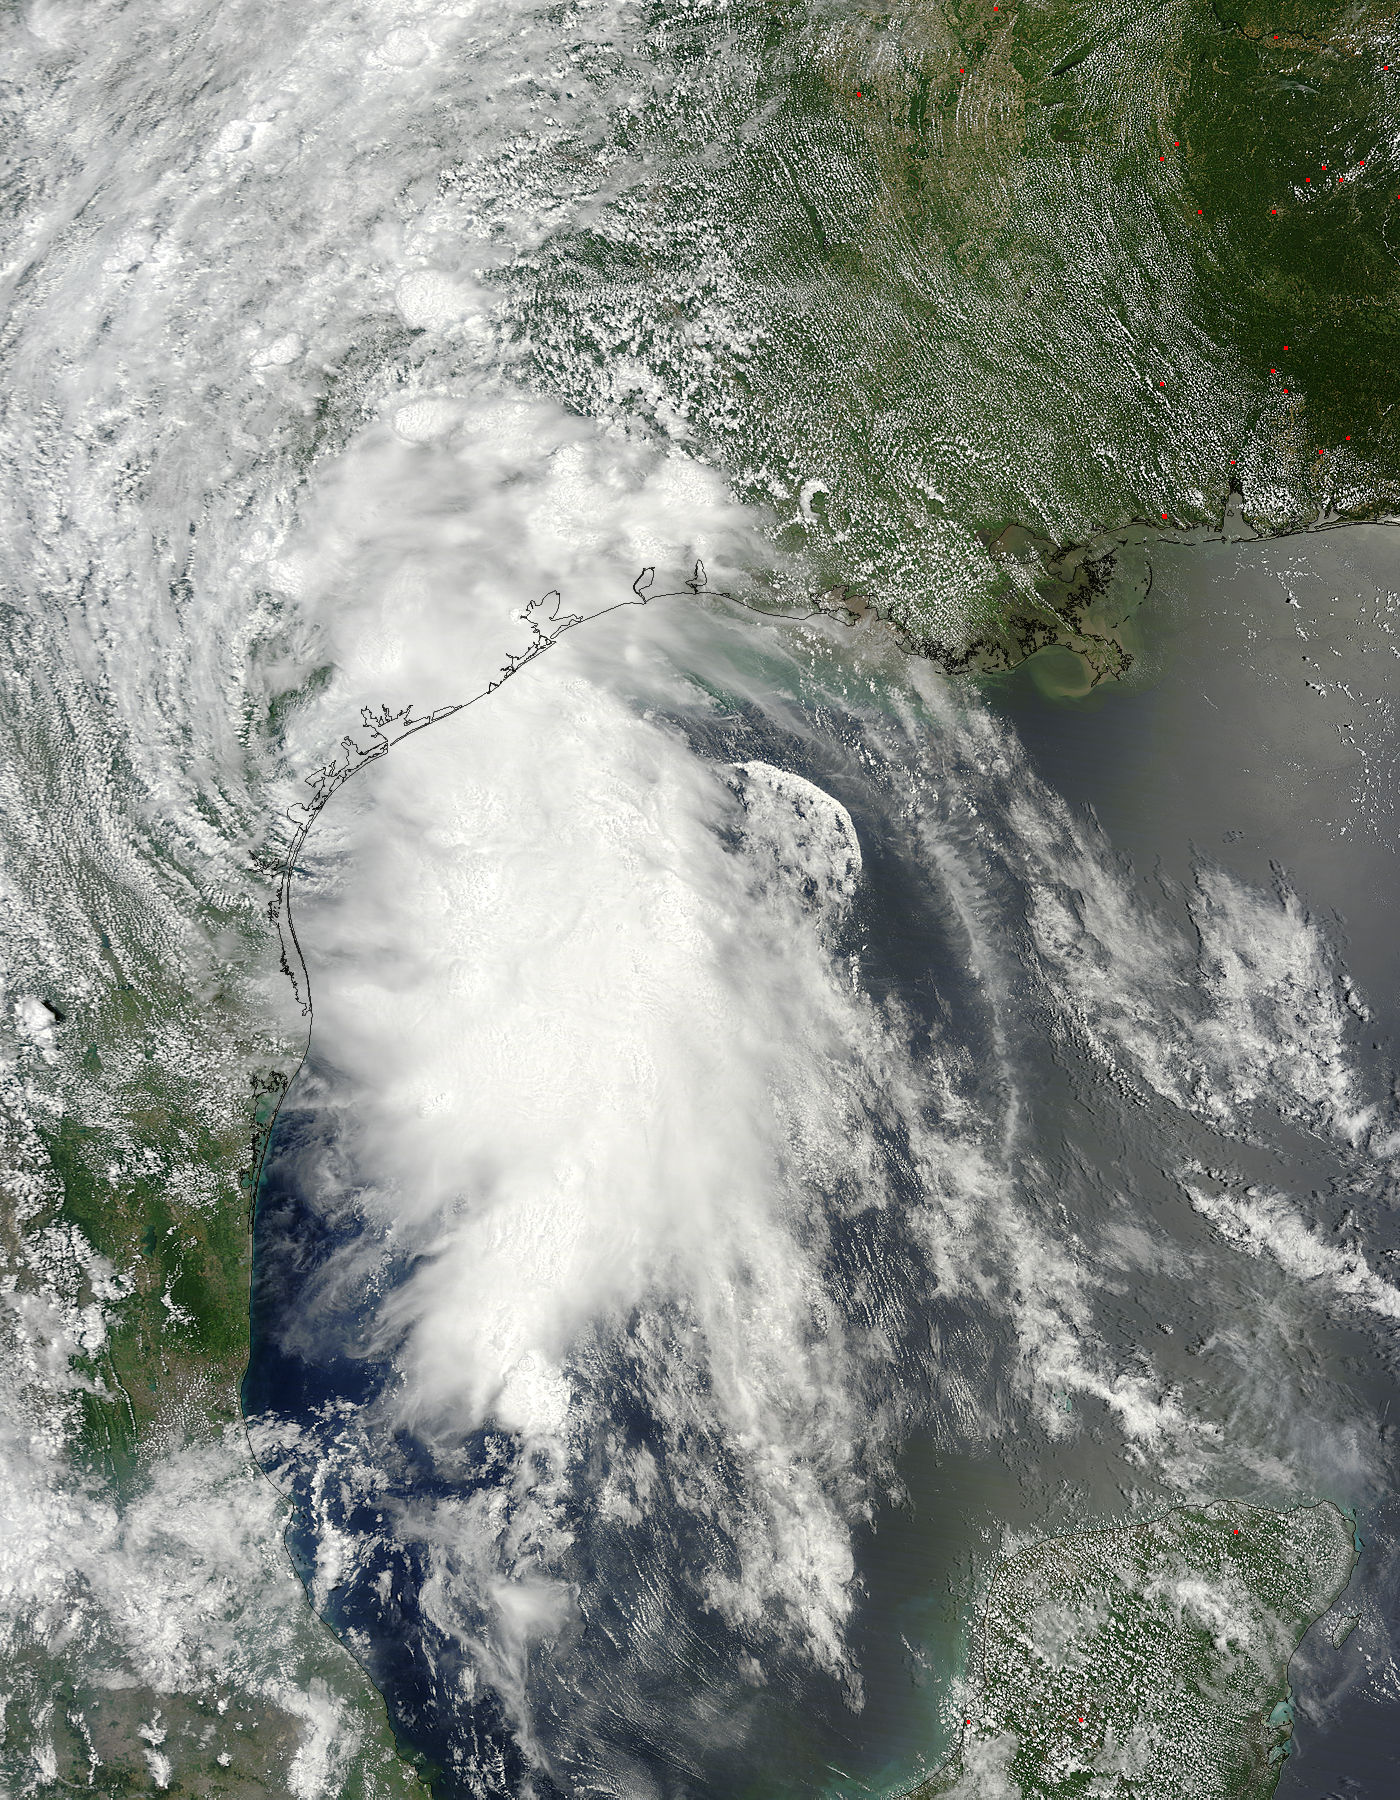
On June 17, the MODIS instrument aboard NASA’s Terra satellite captured an image of Tropical Depression Bill over northeastern Texas. In the image, a band of moisture from the Gulf of Mexico was being swept up into the eastern quadrant of the storm, while another band of thunderstorms stretched northeast of the center. The MODIS data was made into an image at NASA Goddard.
Credits: NASA/JAXA/SSAI, Hal Pierce
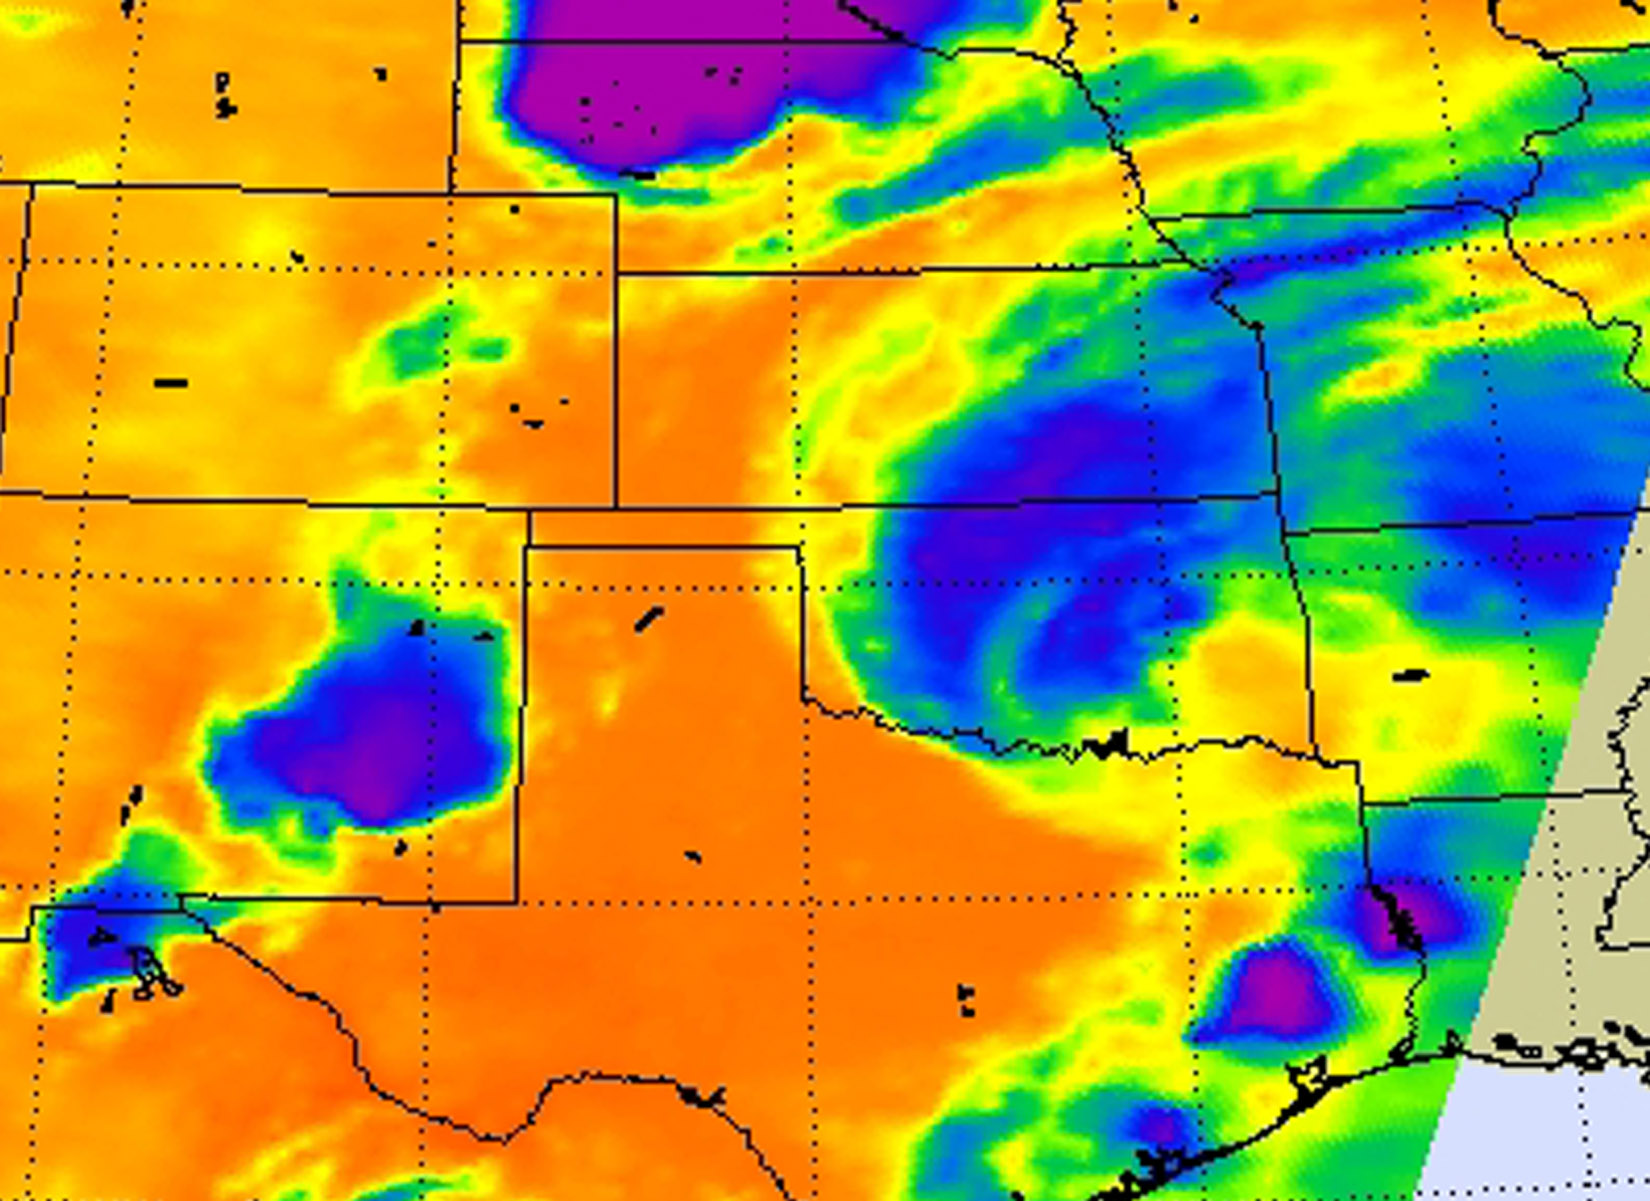
On June 18 at 08:41 UTC (4:41 a.m. EDT) infrared data from the AIRS instrument aboard NASA’s Aqua satellite was made into a false-colored infrared image to show temperature. AIRS data can identify the coldest, highest cloud tops with potential heavy rainfall. The data showed cold cloud tops and thunderstorms over most of Oklahoma (except the panhandle), stretching into southeastern Kansas. The AIRS data was made into an image at NASA’s Jet Propulsion Laboratory in Pasadena, California.
Data from the NASA’s Integrated Multi-satellitE Retrievals for GPM (IMERG) was used in an analysis to estimate rainfall from Tropical Depression Bill. Precipitation was analyzed from the time when Tropical Depression Bill was forming in the Gulf Of Mexico on Monday June 15, 2015 until June 18, 2015 at 0600 UTC (2 a.m. EDT). The data showed rainfall from Tropical Depression Bill was spreading over Oklahoma while rainfall from a frontal system was also occurring in the northern states. The GPM observatory is co-managed by both NASA and the Japanese Space Agency.
Credits: NASA SVS
The NWS expects Tropical Depression Bill to produce total rain accumulations of 4 to 8 inches across eastern Oklahoma, northwest Arkansas and into southern Missouri. Locally higher amounts up to 12 inches may also be possible. Additional amounts of 1 to 2 inches possible into portions of southeastern Texas. Rainfall amounts of 2 to 4 inches are possible farther northeast into the Ohio River Valley. These rains may produce life-threatening flash floods.
At 5 a.m. EDT (0900 UTC) on June 18, the center of Bill was located near Latitude 34.5 North and longitude 96.4 West. That places Bill’s center of circulation about 80 miles (129 km) southeast of Oklahoma City, Oklahoma. Maximum sustained winds were near 25 mph (40 kph). Bill was moving to the north-northeast at 10 mph (16 kph). Tropical depression Bill continues to move north-northeastward into southern Oklahoma.
NWS/WPC noted that Bill is forecast to move across southeastern Oklahoma on Thursday, June 18 and southern Missouri by Friday, June 19. Bill is expected to gradually weaken over the next few days. For updates, visit: http://www.wpc.ncep.noaa.gov/tropical/tropstorms.shtml
Rob Gutro
NASA’s Goddard Space Flight Center
NWS SELECTED STORM TOTAL RAINFALL IN INCHES THROUGH 5 AM EDT ON JUNE 18
ARKANSAS
HARRISON/BOONE CO. ARPT 1.48
BENTONVILLE 1.43
OKLAHOMA
NEWPORT 13.07
BURNEYVILLE 10.09
RINGLING 8.27
SULPHUR 7.09
TEXAS
MONTAGUE 12.50
GANADO 1.5 W 11.77
ALICE INTL ARPT 9.03
WF SAN JACINTO 7.06
CORPUS CHRISTI 6.14
WACO 0.8 N 3.91
AUSTIN 5 E 3.72
SAN ANTONIO INTL ARPT 2.43
HOUSTON 2.09
GALVESTON/SCHOLES 1.42
June 17, 2015 – NASA Sees Bill Make Texas Landfall, Weaken to a Depression
Credits: NASA/NOAA GOES Project
A NASA animation of imagery from NOAA’s GOES-East satellite shows the progression of Tropical Storm Bill through the western Gulf of Mexico, landfall in east Texas and weakening into a depression west of Dallas.
A GOES-East animation of infrared and visible imagery from June 15 through June 17 shows Tropical Storm Bill’s movement and landfall. The animation was created by NASA/NOAA GOES Project at the NASA Goddard Space Flight Center in Greenbelt, Maryland.
At 5 a.m. EDT 0900 UTC), the center of Tropical Depression Bill was located near latitude 31.0 North, longitude 97.1 West. The depression was moving toward the north near 13 mph (20 kph). This general motion is expected to continue through the day on June 16 with a turn to the northeast on Thursday, June 17. Maximum sustained winds were near 35 mph (55 kph). The estimated minimum central pressure is 1000 millibars.
The National Hurricane Center noted that Bill is expected to produce total rain accumulations of 4 to 8 inches over eastern Texas and eastern Oklahoma and 3 to 6 inches over western Arkansas and southern Missouri. Isolated maximum amounts of 12 inches are possible in Texas and Oklahoma. These rains may produce life-threatening flash floods. In addition to the heavy rains, tropical-storm-force winds were occurring east of the center during the morning of June 16. Those winds are expected to subside later in the day.
Storm surge and above normal tides along the Upper Texas and Western Louisiana coasts should subside later on June 16. However, as with any land falling tropical cyclone, an isolated tornado is possible. The National Hurricane Center noted that a brief tornado or two may occur over parts of eastern Texas and eastern Oklahoma during the day and night today, June 16.
The National Hurricane Center (NHC) expects slow weakening over the next two days and by Thursday, June 18, the depression is expected to become a post-tropical low pressure area. NHC forecasts take the depression north and then east over the next several days entering south-central Oklahoma and exiting the eastern part of the state on Thursday, June 17. The remnants are expected to pass through northwestern Arkansas and through southern and eastern Missouri before moving into the Ohio Valley by Saturday, June 20. Updated forecasts can be obtained through the National Weather Service website: www.weather.gov.
Rob Gutro
NASA’s Goddard Space Flight Center
June 16, 2015 – NASA Sees Tropical Storm Bill Making Landfall in Texas
Credits: NASA/NOAA GOES Project
Tropical Storm Bill was making landfall at 11 a.m. CDT on Matagorda Island, Texas on June 16 as NASA and NOAA satellites gathered data on the storm. At NASA a movie of Bill’s landfall was created using data from NOAA’s GOES-East satellite. The center of Bill is expected to move inland over south-central Texas during the afternoon and night of June 16.
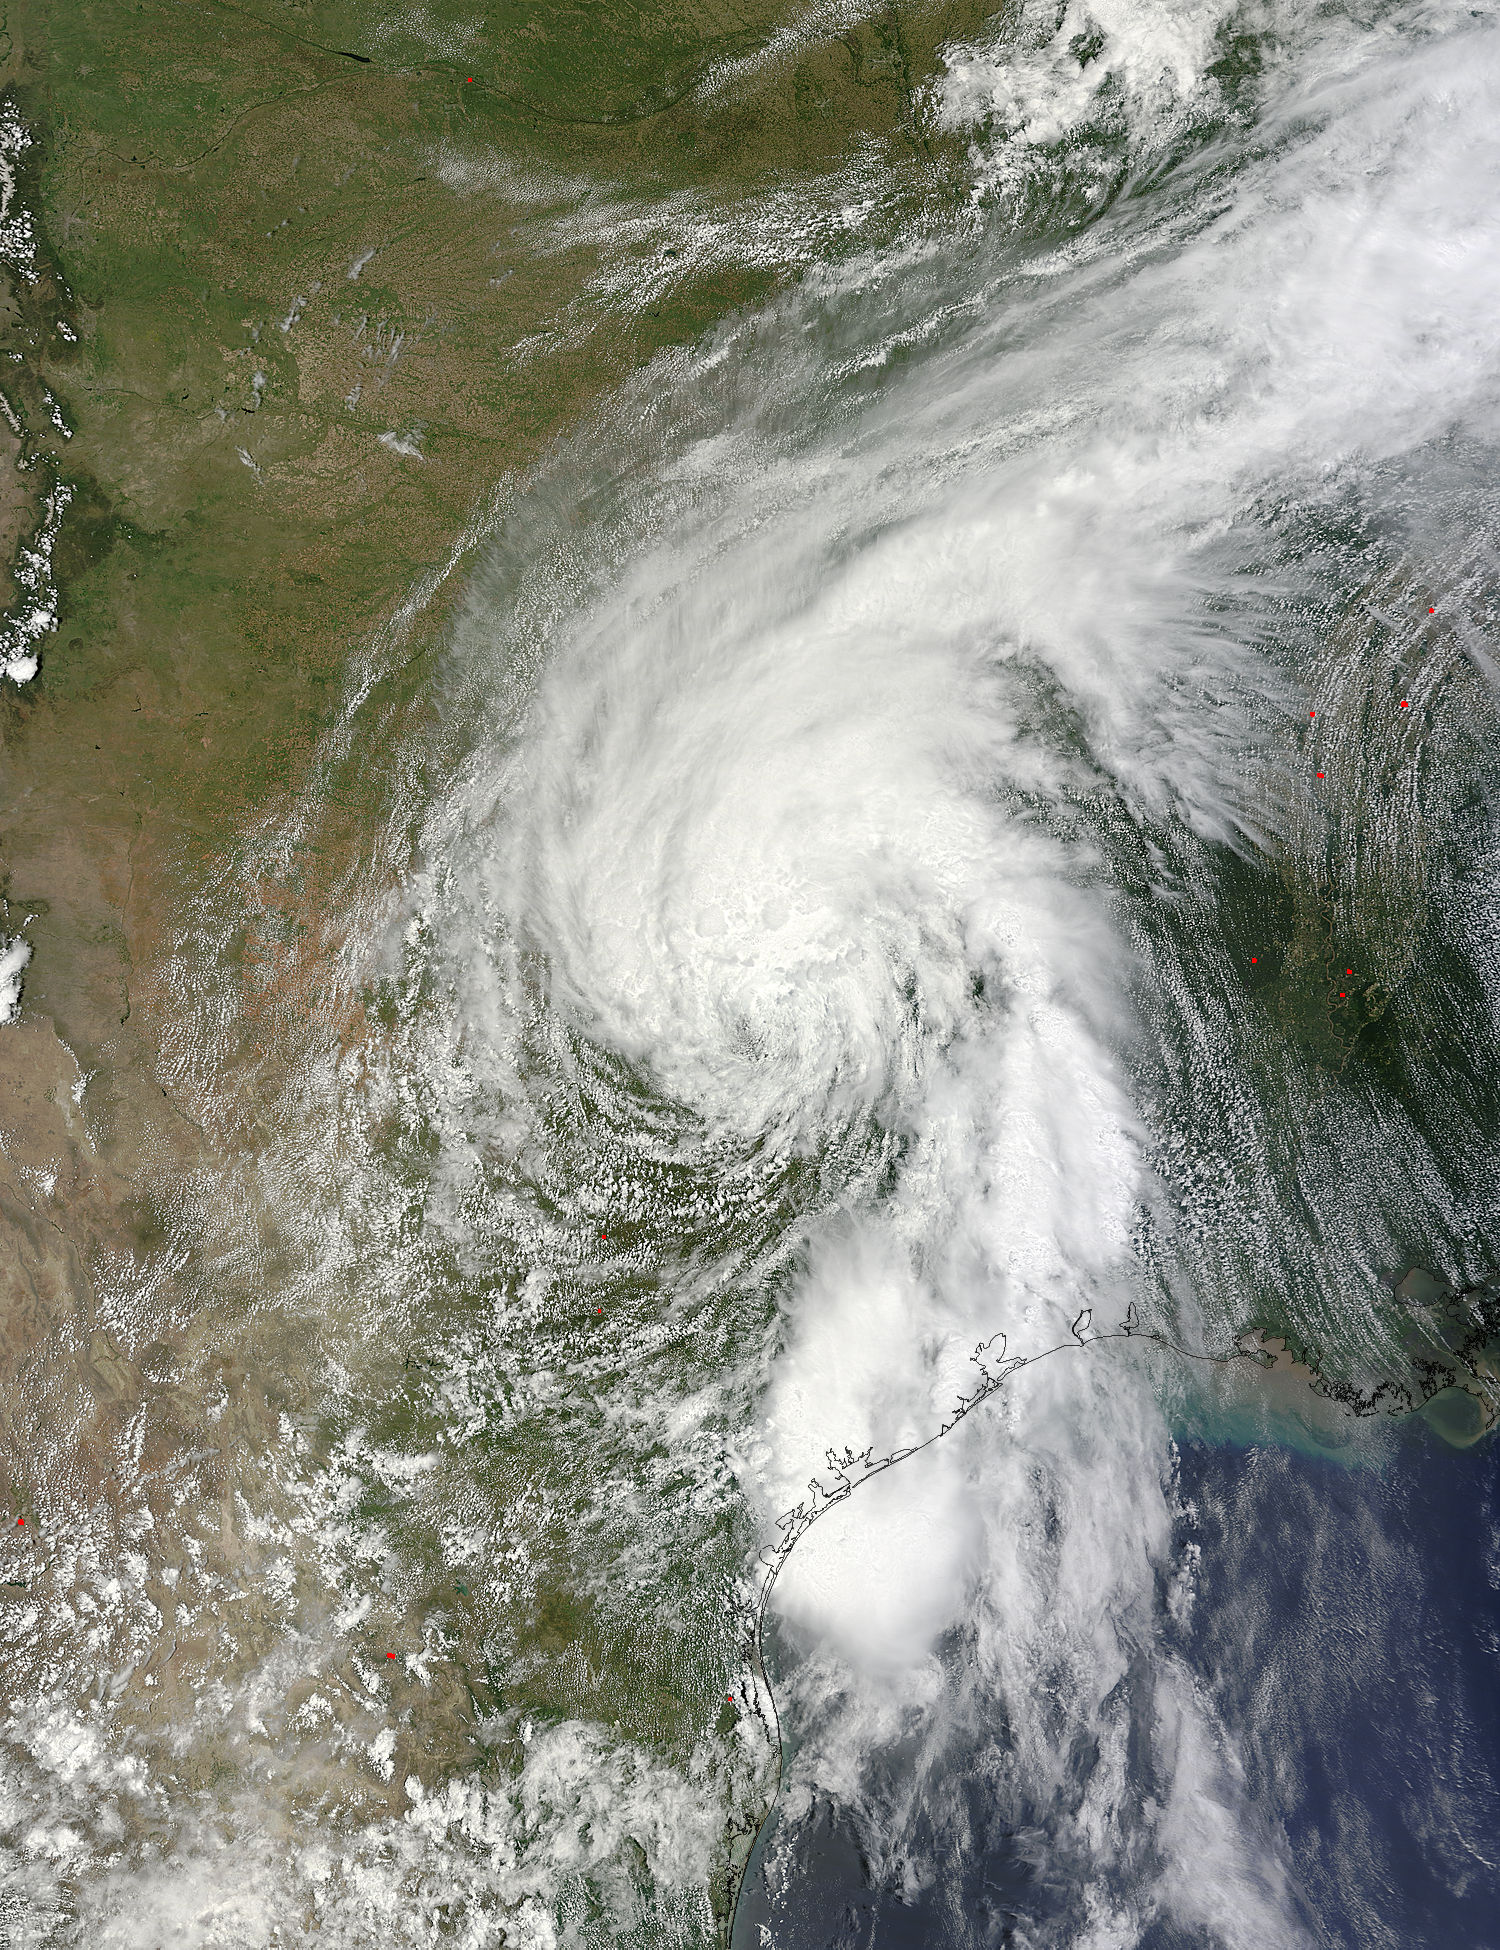
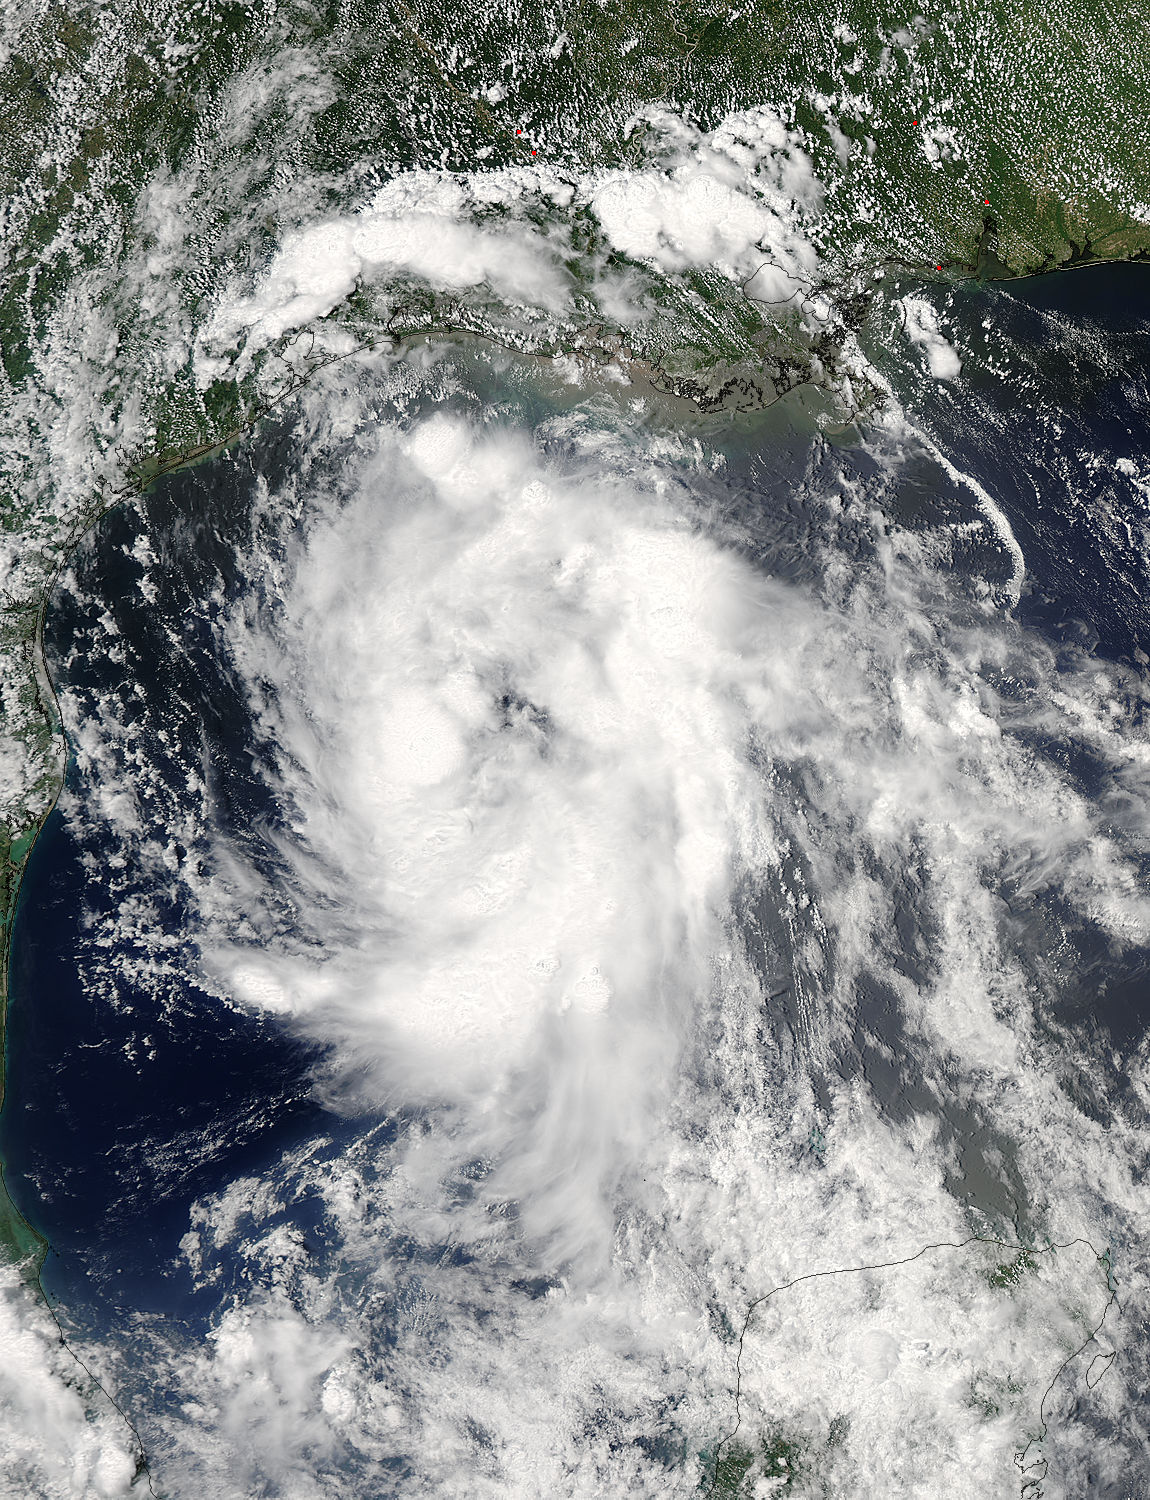
On June 15 at 19:15 UTC (3:15 p.m. EDT) the MODIS instrument aboard NASA’s Aqua satellite captured a visible image of Tropical Storm Bill approaching Texas and Louisiana. Powerful thunderstorms circled the center in fragmented bands.
At 11 a.m. CDT on June 16, a Tropical Storm Warning was in effect from Baffin Bay to High Island Texas as Bill was making landfall.
An animation of visible and infrared imagery from NOAA’s GOES-East satellite was created by NASA/NOAA’s GOES Project at NASA’s Goddard Space Flight Center in Greenbelt, Maryland. The animation shows Tropical Storm Bill developing in the Gulf of Mexico on June 14 and 15 and its landfall along the southeastern Texas coast on June 16.
The National Hurricane Center noted that Bill is expected to produce total rain accumulations of 4 to 8 inches over eastern Texas and eastern Oklahoma and 2 to 4 inches over western Arkansas and southern Missouri, with possible isolated maximum amounts of 12 inches in eastern Texas. In eastern Texas and far western Louisiana today and tonight, isolated tornadoes are also possible, as with any landfalling tropical storm.
Tropical storm conditions are expected to continue into the evening in the warning area. Along the coasts, the combination of a storm surge and the tide will cause normally dry areas near the coast to be flooded by rising waters. The water could reach the following heights above ground if the peak surge occurs at the time of high tide. The NHC noted that the Upper Texas coast could experience 2 to 4 feet, and the western Louisiana coast between 1 to 2 feet.
At 10 a.m. CDT (1500 UTC), the center of Tropical Storm Bill was located near latitude 28.2 North, longitude 96.4 West. Bill was moving toward the northwest near 10 mph (17 kph) and that general motion is expected to continue today. The latest minimum central pressure reported by an Air Force Reserve Hurricane Hunter aircraft was 997 millibars. Reports from an Air Force Reserve reconnaissance aircraft indicate that maximum sustained winds remain near 60 mph (95 kph) with higher gusts.
Unlike Carlos, Bill is not a compact storm. Tropical-storm-force winds extend outward up to 150 miles (240 km) from the center. Between 9 and 10 a.m. CDT, an automated observing station at Port O’Connor also reported a sustained wind of 44 mph (70 kph) and a gust to 53 mph (85 kph).
For updated forecasts, watches and warnings, visit the National Hurricane Center webpage at www.nhc.noaa.gov. For local forecasts and advisories, visit: www.weather.gov.
Bill is forecast to continue moving inland and is expected to be a tropical depression by Wednesday, June 17, west of Dallas. The remnants of Bill are forecast to move into the Midwest later in the week.
Rob Gutro
NASA’s Goddard Space Flight Center
June 15, 2015 – Satellite Animation Shows System 91L Developing in the Gulf of Mexico
Credits: NASA/NOAA GOES Project
The National Hurricane Center is keeping a close eye on a developing tropical low pressure area in the south-central Gulf of Mexico. NOAA’s GOES-East satellite provided imagery of the system, and an animation was created at NASA showing the development over two days. The system has a high chance for development into a tropical depression.
NOAA’s GOES-East satellite sits in a fixed location providing continuous coverage of weather systems in the eastern U.S. and Atlantic Ocean basin. An animation of visible and infrared imagery of the low was created by NASA/NOAA’s GOES Project at NASA’s Goddard Space Flight Center in Greenbelt, Maryland. The animation shows the low developing near Mexico’s Yucatan Peninsula on June 13 and moving north into the Gulf of Mexico where it began to consolidate. The spin of the low pressure area became evident as the low moved off the Yucatan.
At 8 a.m. EDT on Monday, June 15 The National Hurricane Center (NHC) noted that the thunderstorm activity associated with System 91L have become a little more concentrated. NHC said, “The low continues to produce tropical-storm-force winds well to the east and northeast of the center. Upper-level winds are forecast to become more favorable for development while this system moves northwestward across the western Gulf of Mexico, and a tropical depression or tropical storm could form at any time before the system reaches the Texas coast sometime tomorrow.”
Regardless of further development the National Hurricane Center cautioned residents along the northwestern Gulf of Mexico. NHC said tropical storm conditions are possible along portions of the middle and upper Texas coast and the western Louisiana coast Monday night, June 15 and Tuesday, June 16. The system is also likely to bring heavy rainfall with possible flooding across portions of eastern Texas and western Louisiana.
Rob Gutro
NASA’s Goddard Space Flight Center

