


![Request for Information – Potential [Placeholder for Prize]](https://assets.science.nasa.gov/dynamicimage/assets/science/psd/solar/2023/09/s/solarsystem_0.jpg?w=1024)


NASA Sees a Fading Fiona in Atlantic
When NASA’s Aqua satellite passed over the eastern Atlantic Ocean it looked at the weakening Tropical Depression Fiona and a developing tropical low pressure area named System 99L. Fiona became a post-tropical depression today, Aug. 23.
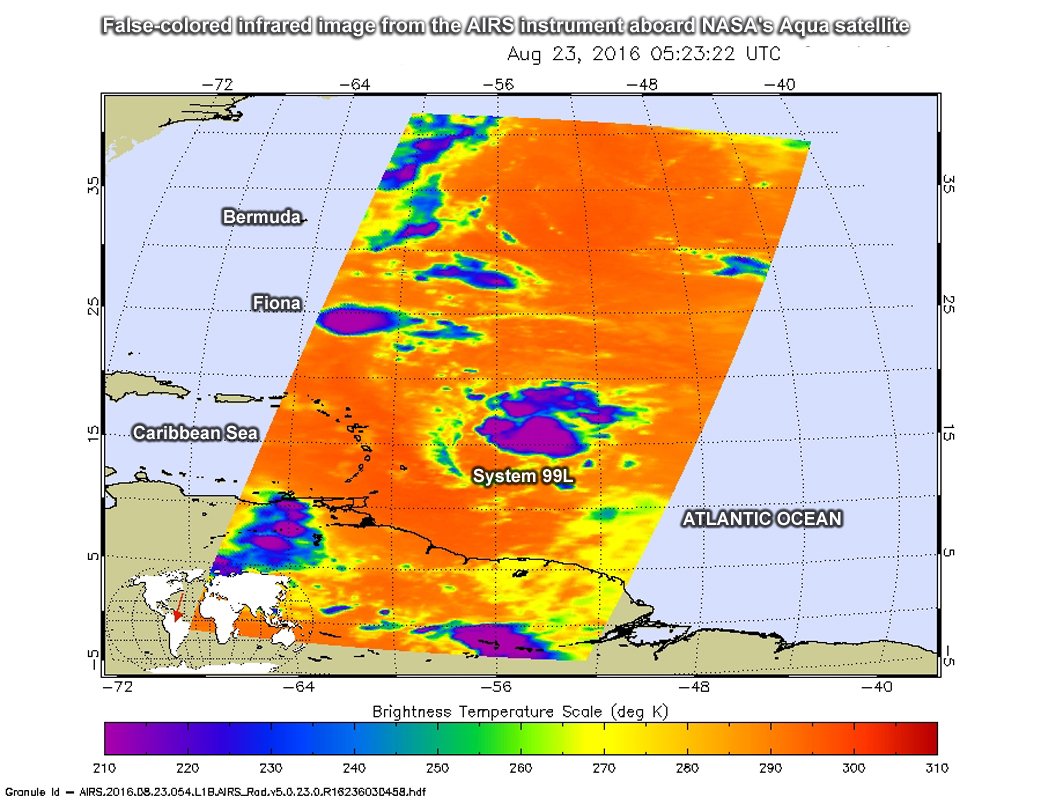
The Atmospheric Infrared Sounder or AIRS instrument aboard Aqua, provided temperature data on the systems as it analyzed them in infrared light. On Aug. 23 at 0841 UTC (4:41 a.m. EDT) infrared data showed both Fiona and the low pressure area designated 99L showed some powerful thunderstorms with high cold cloud tops (as cold as -63F/-53C) in each system. AIRS imagery is created at NASA’s Jet Propulsion Laboratory in Pasadena, California.
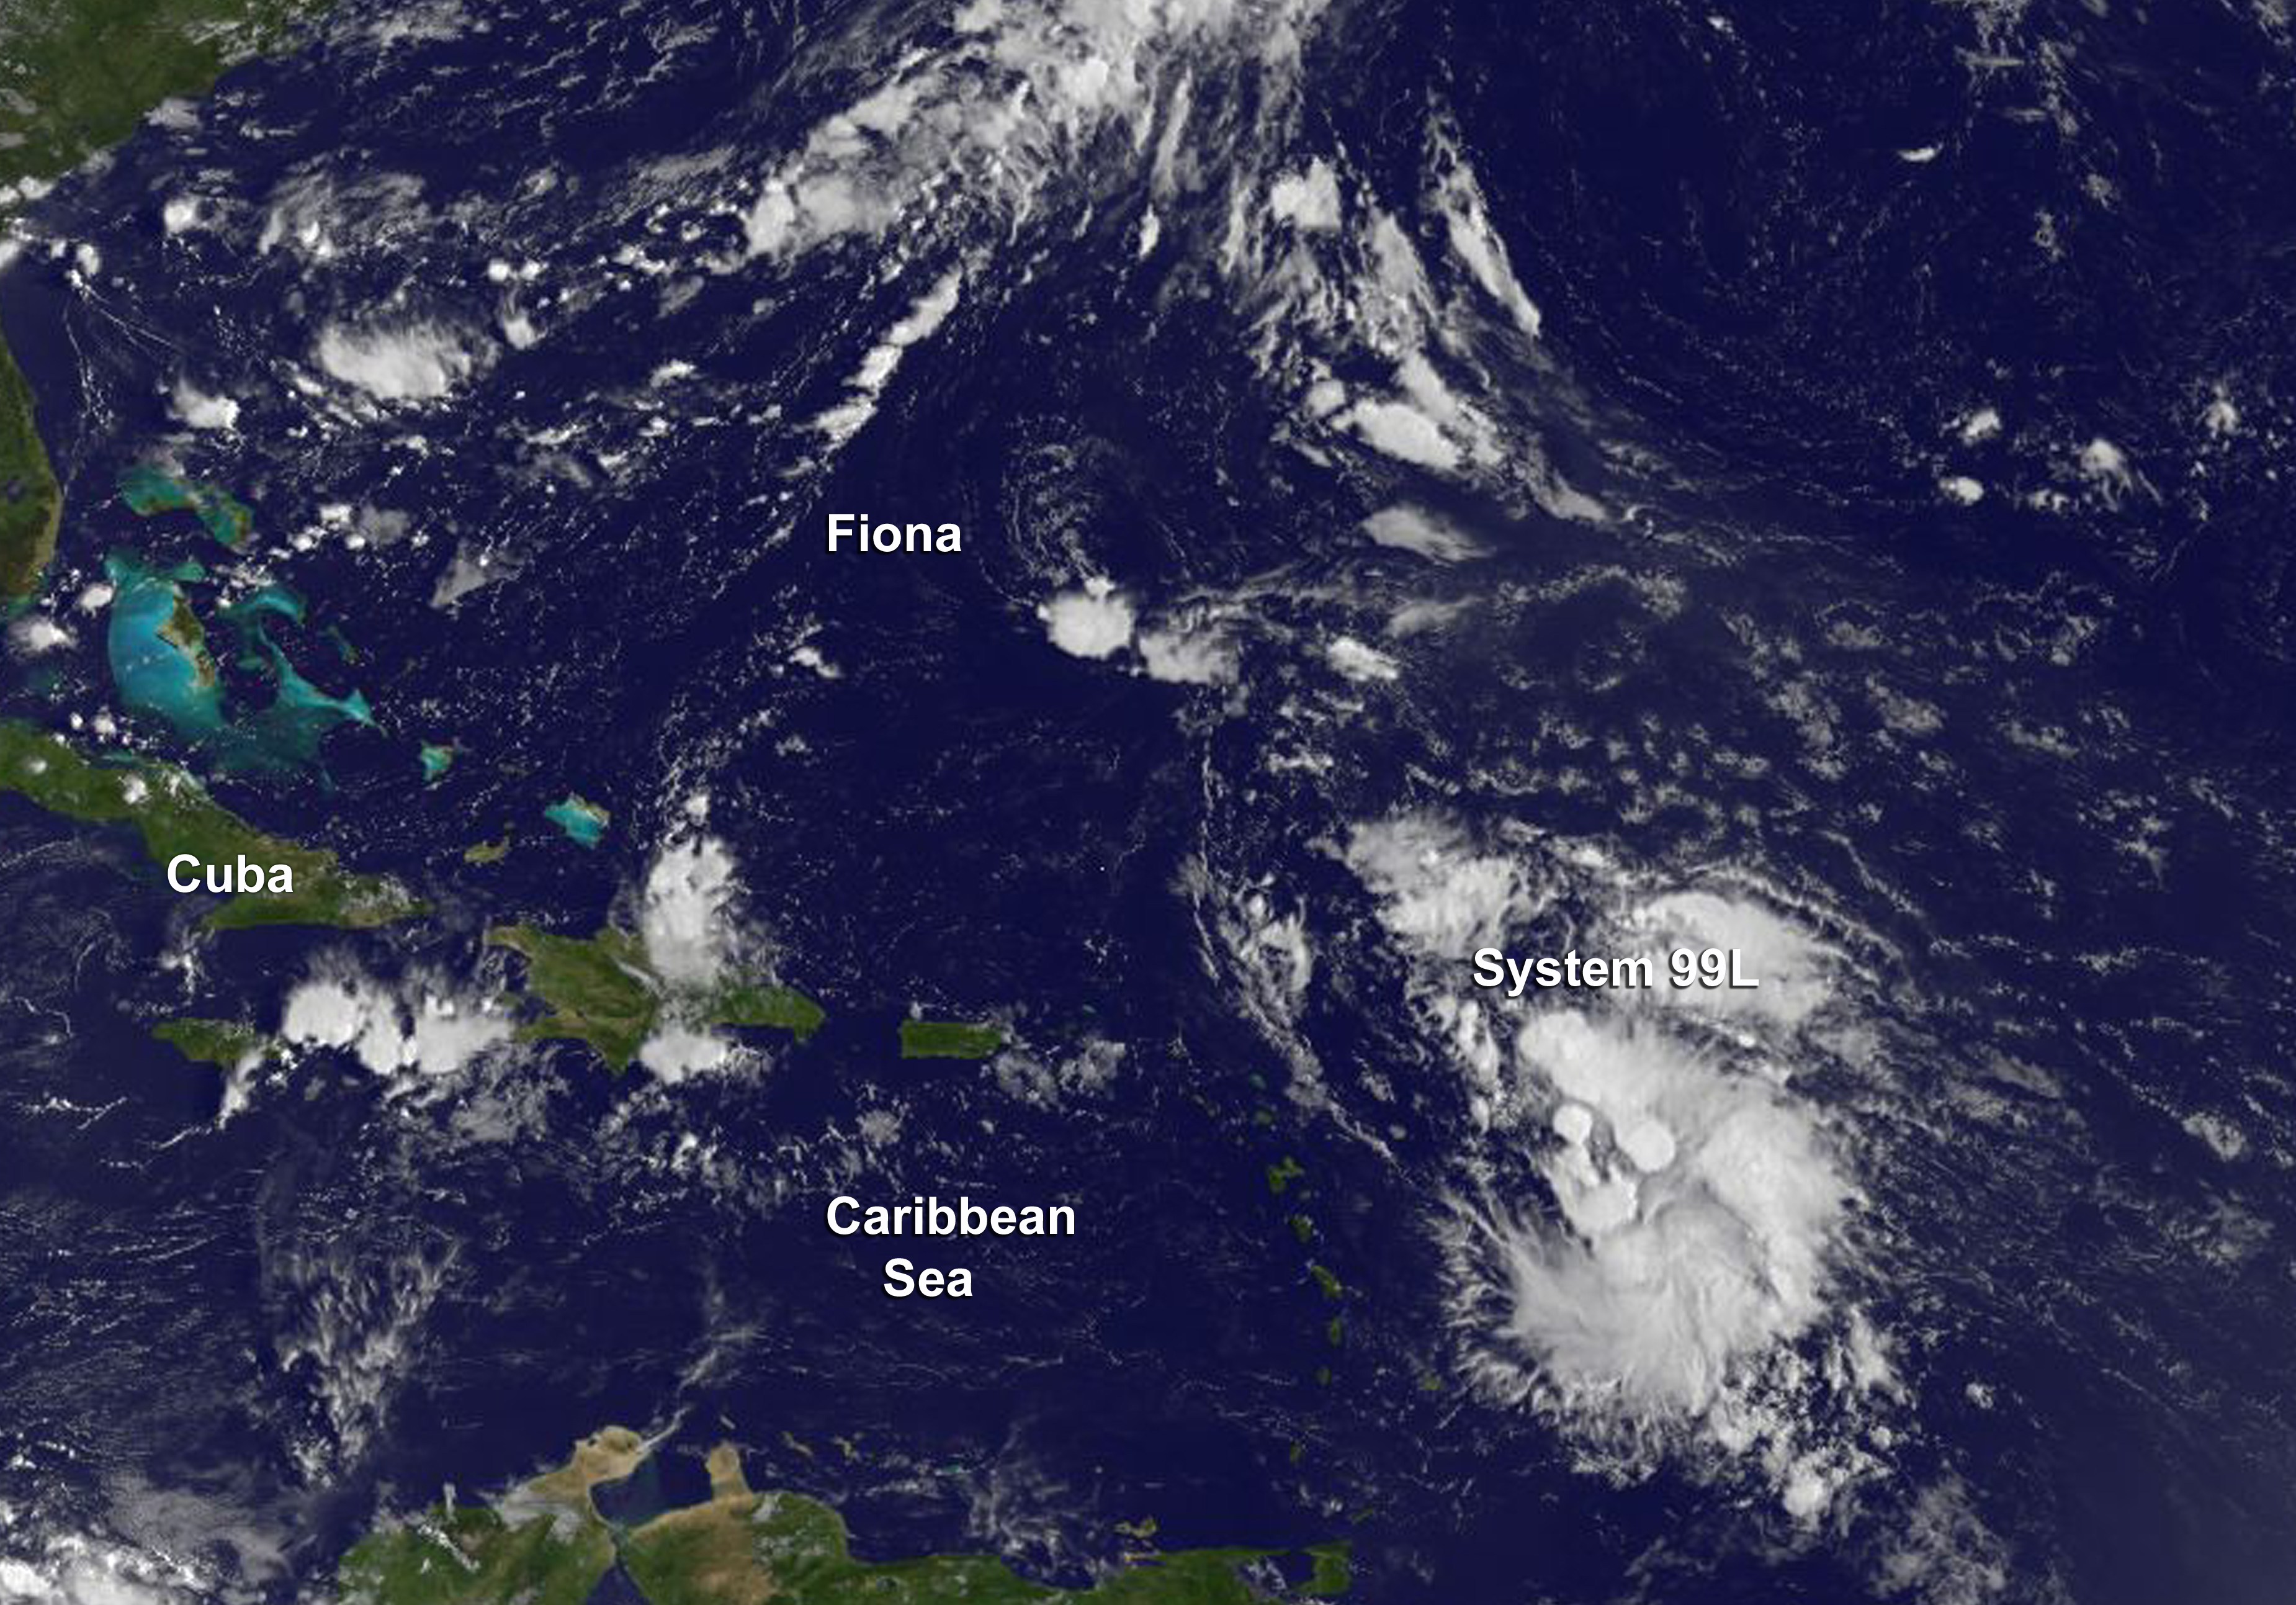
NOAA’s GOES-East satellite saw a tiny, elongated post-tropical depression Fiona and a larger developing System 99L in the Eastern Atlantic at 1145 UTC (7:45 a.m. EDT). The image was created by the NASA/NOAA GOES Project at NASA’s Goddard Space Flight Center in Greenbelt, Maryland using data from NOAA’s GOES-East satellite.
Fiona appeared elongated as a result of battling vertical wind shear and had a small area of strong convection at the time of the Aqua image. But that area diminished by 11 a.m. EDT.
National Hurricane Center (NHC) forecaster Blake noted in the 11 a.m. EDT discussion “Satellite images indicate that Fiona has lost even more organization this morning with only a weak, elongated circulation and no organized deep convection. Thus, Fiona no longer meets the requirements of a tropical cyclone and this is the last advisory.”
Infrared data on System 99L showed a larger area of powerful thunderstorms, although fragmented around its center.
At 11 a.m. EDT (1500 UTC) on Aug. 23 the center of Post-Tropical Cyclone Fiona was located near 26.1 degrees north latitude and 64.5 degrees west longitude. That’s about 430 miles (690 km) south of Bermuda.
The post-tropical cyclone is moving toward the west-northwest near 12 mph (19 kph), and a gradual turn toward the northwest with a decrease in forward speed is expected over the next 48 hours. The estimated minimum central pressure is 1014 millibars.
Maximum sustained winds have decreased to near 30 mph (45 kph) with higher gusts. The low should gradually weaken over the next couple of days.
Regeneration is not expected at this time. The NHC forecast noted that the low pressure area should move northwestward into a break in the subtropical ridge (elongated area) of high pressure, then westward as the ridge re-strengthens.
Rob Gutro
NASA’s Goddard Space Flight Center
Aug. 22, 2016 – NASA Sees Tropical Storm Fiona Weakening from Wind Shear
NASA-NOAA’s Suomi NPP satellite passed over Tropical Storm Fiona as it was being weakened by wind shear in the Central Atlantic Ocean.
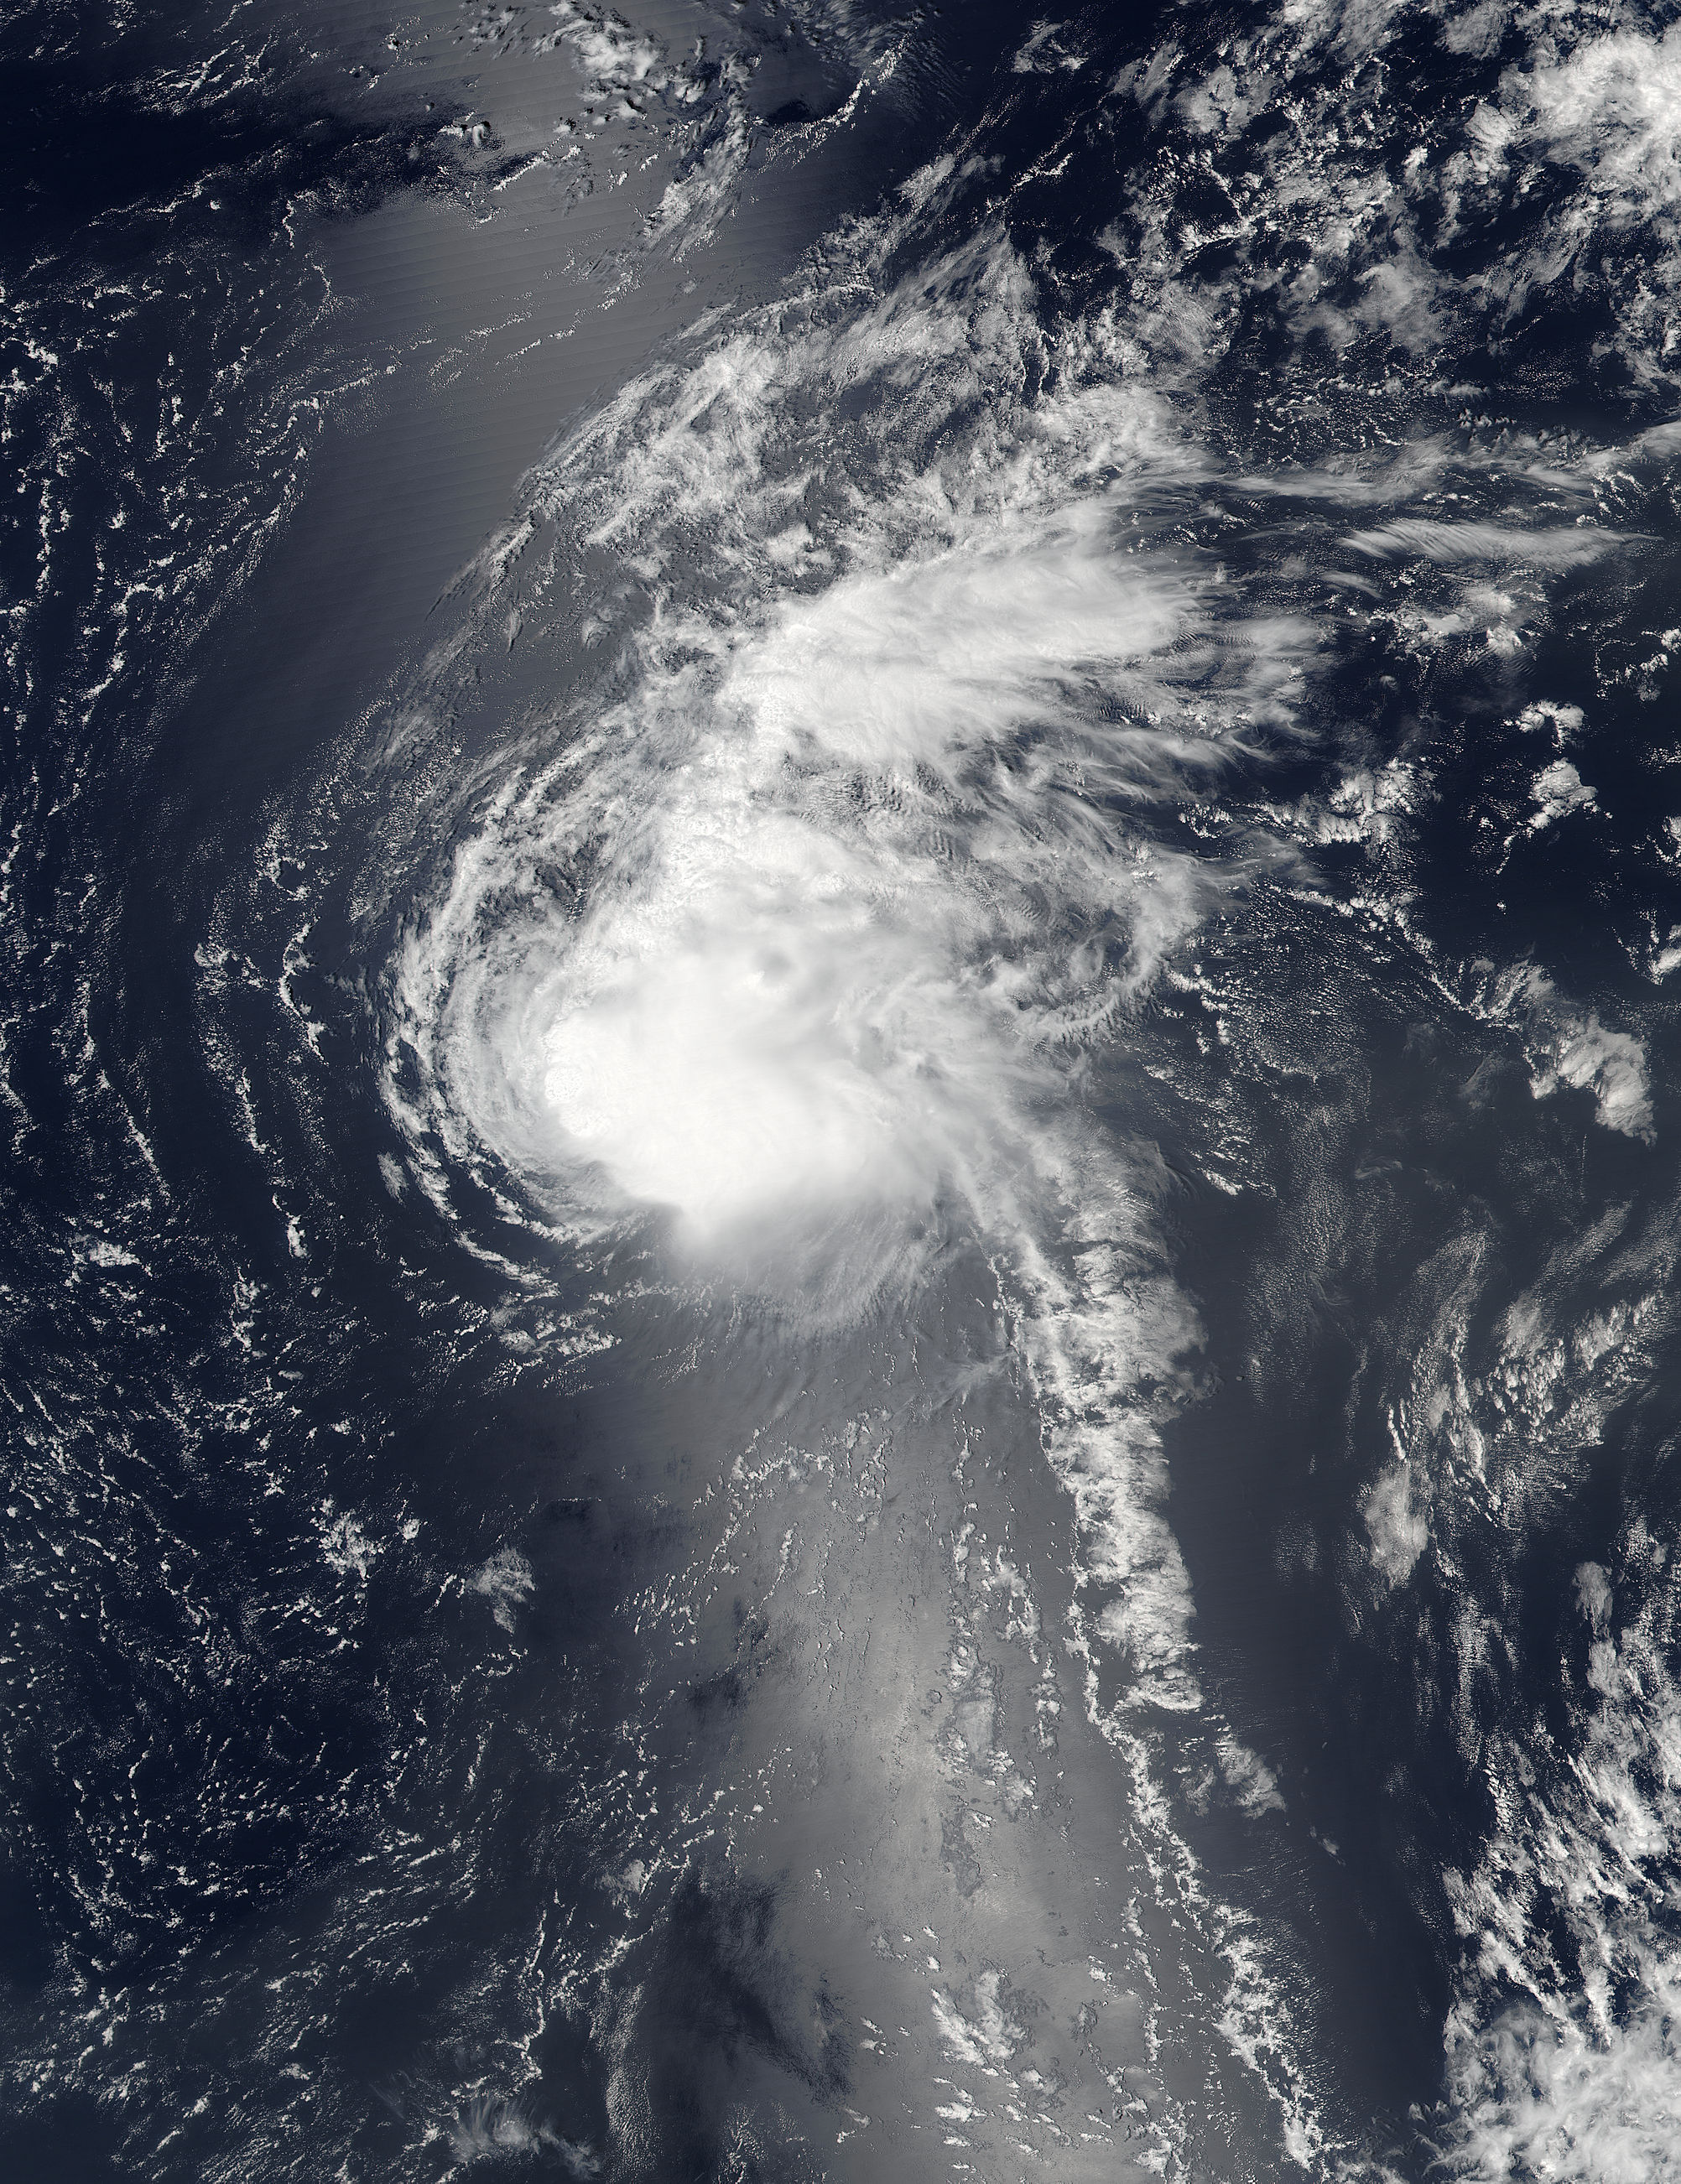
On Aug. 22 at 12:10 p.m. EDT (16:10 UTC) the Visible Infrared Imaging Radiometer Suite (VIIRS) instrument aboard NASA-NOAA’s Suomi NPP satellite captured a visible light image of Tropical Storm Fiona before it weakened into a tropical depression. At the time of the image, Forecaster Daniel Brown of the National Hurricane Center noted that “strong westerly shear continues to take a toll on Fiona.” The Suomi NPP image showed the bulk of Fiona’s clouds pushed to the east.
“After becoming devoid of convection overnight, new convective cells have developed around the small circulation, but there is not much organization to the thunderstorm activity,” Brown said. “Besides, the clouds tops are already being sheared eastward by strong upper-level westerly flow.”
The tropical storm weakened into a depression at 11 p.m. EDT on Aug. 21 (0300 UTC, Aug. 22).
By 5 a.m. EDT (0900 UTC) on Aug. 22, the center of Tropical Depression Fiona was located near 24.4 degrees north latitude and 58.4 degrees west longitude. That’s about 525 miles (855 km) northeast of the Northern Leeward Islands.
Fiona was moving toward the west-northwest near 18 mph (30 kph) and the National Hurricane Center expects a continued west-northwestward motion with a gradual decrease in forward speed today, Aug. 22 and Tuesday, Aug. 23. The estimated minimum central pressure is 1008 millibars.
Maximum sustained winds were near 35 mph (55 kph). Little change in strength is forecast during the next 48 hours, but Fiona could become a post-tropical remnant low pressure area in the next day or two.
For updated forecasts on Fiona, visit: www.nhc.noaa.gov
Rob Gutro
NASA’s Goddard Space Flight Center
Aug. 19, 2016 – NASA Sees Wind Shear Affecting Tropical Storm Fiona
An image from NASA’s Aqua satellite showed that southwesterly wind shear was affecting Tropical Storm Fiona, pushing clouds to the northeast of the center.
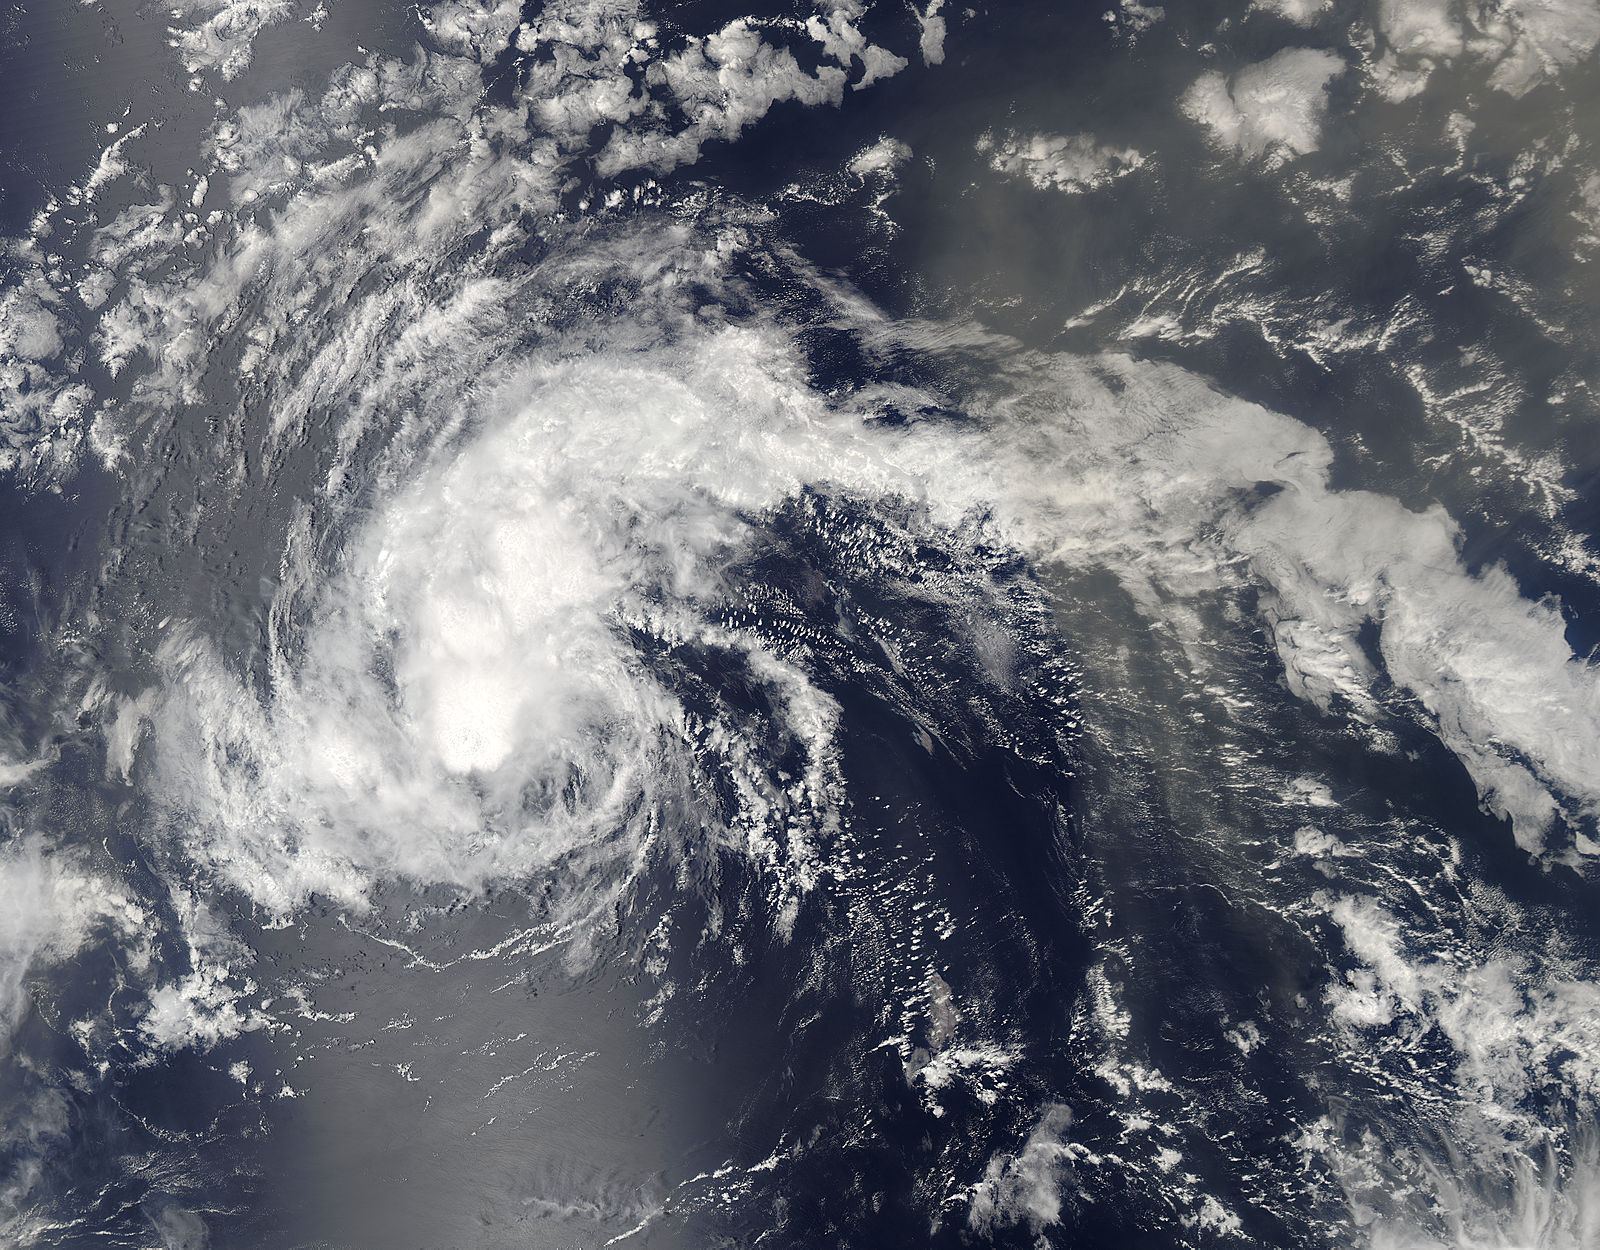
On August 18 at 12:05 p.m. EDT (16:05 UTC) the Moderate Resolution Imaging Spectroradiometer or MODIS instrument that flies aboard NASA’s Aqua satellite provided a visible light image Fiona. The image showed that strong thunderstorms and deep convection (rising air that forms them) circled the center and were being pushed to the northeast of the center.
The National Hurricane Center (NHC) reported microwave data suggest the center is near or south of the main area of thunderstorms, which is a sign of the ongoing southwesterly shear.
At 5 a.m. EDT (0900 UTC) on Aug. 19 the center of Tropical Storm Fiona was located near 17.6 degrees north latitude and 42.7 degrees west longitude. That’s about 1,240 miles (1,995 km) west of the Cape Verde Islands.
Fiona was moving toward the west-northwest near 10 mph (17 kph), and this general motion with some increase in forward speed is expected over the next couple of days. Maximum sustained winds are near 45 mph (75 kph) with higher gusts. The estimated minimum central pressure is 1006 millibars.
NHC forecaster Blake said that “Little significant change is expected with Fiona’s intensity today due to gradually increasing shear. The storm should weaken over the weekend as the shear further increases, along with the likely entrainment of drier mid-level air.”
Rob Gutro
NASA’s Goddard Space Flight Center
August 18, 2016 – NASA Sees Formation of Atlantic Ocean’s Tropical Storm Fiona
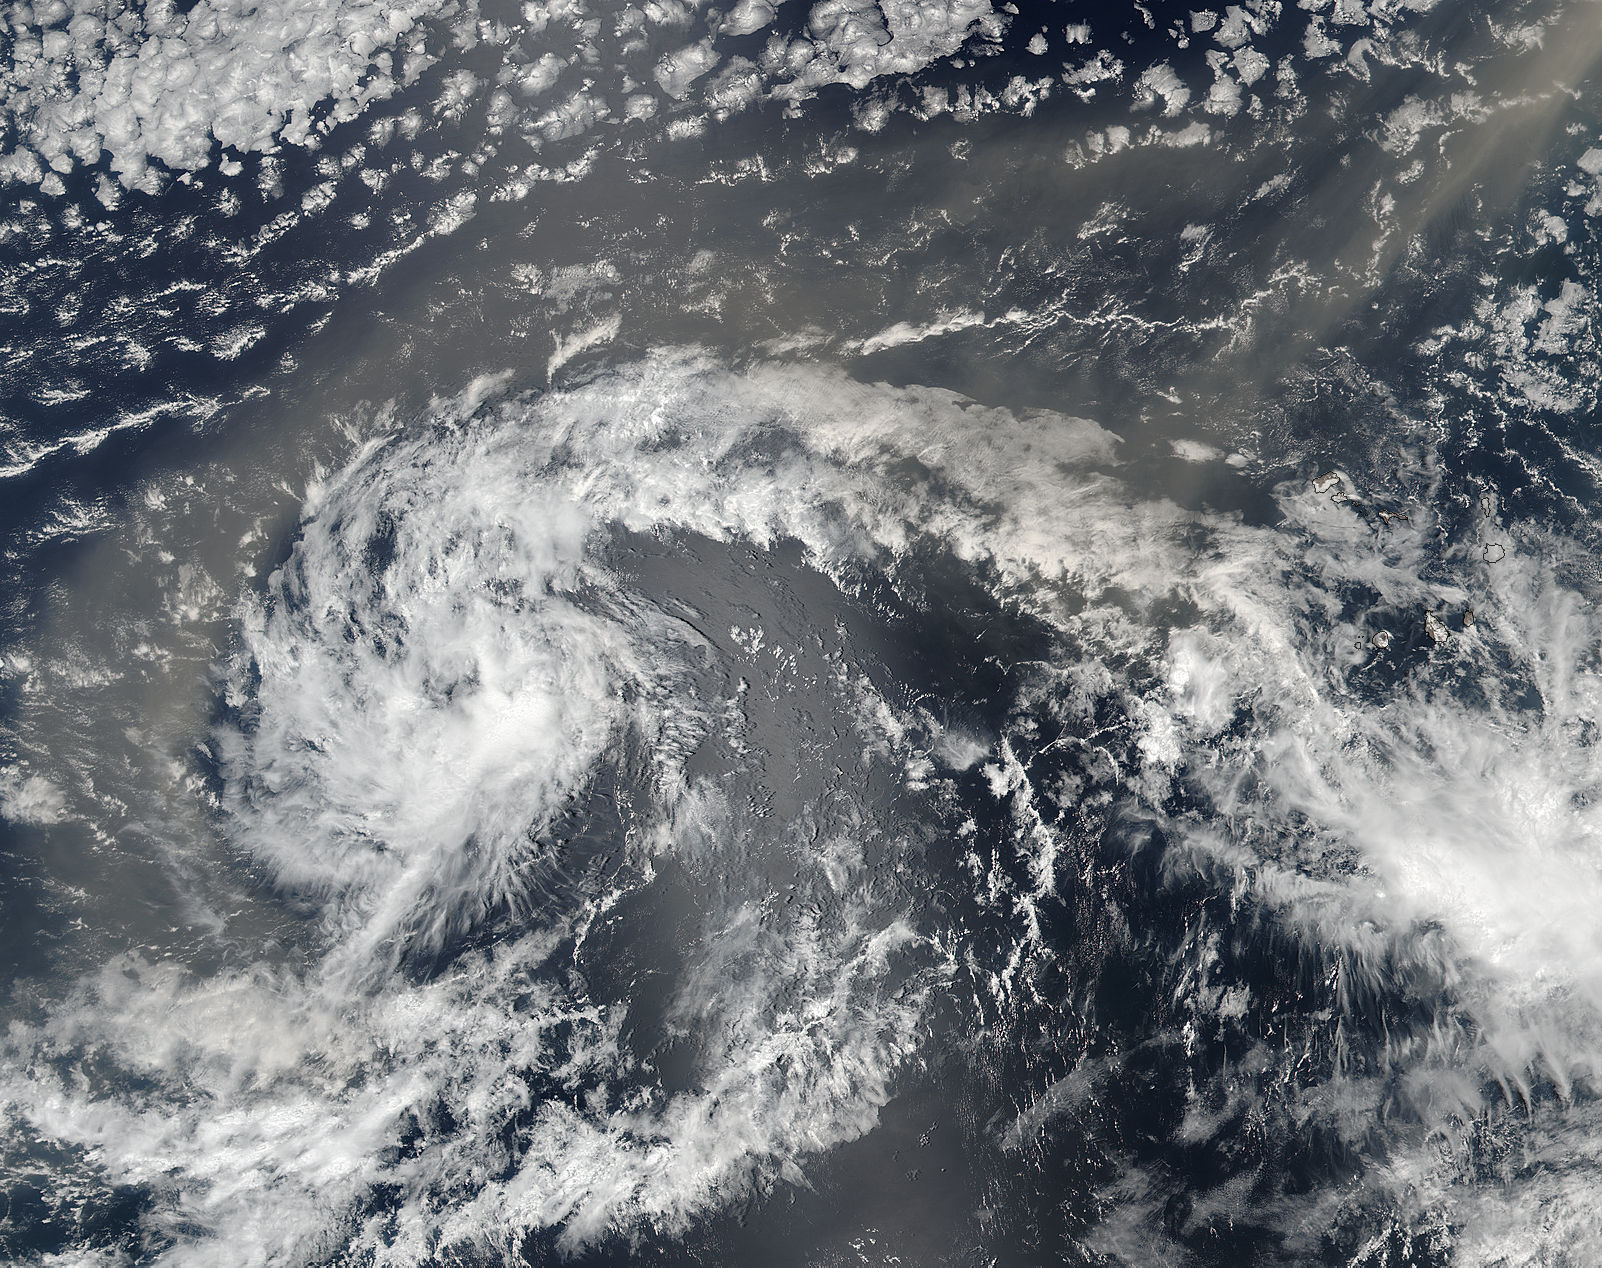
NASA-NOAA’s Suomi NPP satellite passed over Tropical Storm Fiona as it developed in the northeastern Atlantic Ocean and captured a visible image of the strengthening storm.
On Aug. 17 at 11:24 a.m. EDT (15:24 UTC) the Visible Infrared Imaging Radiometer Suite (VIIRS) instrument aboard NASA-NOAA’s Suomi NPP satellite captured a visible light image of Tropical Depression 6 as it was strengthening into Tropical Storm Fiona. At the time, the National Hurricane Center noted that the depression’s overall cloud pattern and low-level wind field continued to improve, as was visible in the Suomi NPP image.
The depression became a tropical storm at 5 p.m. EDT and the sixth named storm of the Atlantic Ocean Hurricane Season.
Southwesterly wind shear that had pushed the bulk of clouds and showers to the northeast of the storm’s center on August 8 had weakened and has kicked up again on Aug. 11 and Aug. 12. The southwesterly winds were as strong as 23 mph (20 knots/37 kph).
At 11 a.m. EDT (1500 UTC), the center of Tropical Storm Fiona was located near 16.4 north latitude and 40.5 west longitude, about 1,095 miles (1,760 km) west of the Cape Verde Islands. Fiona is moving toward the west-northwest near 8 mph (13 kph) and the National Hurricane Center said this general motion is expected to continue during the next couple of days. The estimated minimum central pressure is 1006 millibars.
Maximum sustained winds are near 45 mph (75 kph) with higher gusts. Slow strengthening is possible during the next day or so, followed by gradual weakening over the weekend.
For updated forecasts on Fiona, visit: www.nhc.noaa.gov.
Rob Gutro
NASA’s Goddard Space Flight Center
Aug. 17, 2016 – NASA Sees Sixth Tropical Cyclone Form in Atlantic
Tropical Depression 6 developed in the far eastern North Atlantic Ocean and NASA and NOAA satellites provided infrared and visible views at the storm.
Credits: NASA/JAXA/Hal Pierce
The Global Precipitation Measurement mission or GPM core observatory satellite collected data as the newest Atlantic Ocean tropical depression was forming on August 16, 2016 at 4:31 p.m. EDT (2031 UTC). GPM data showed that the forming tropical cyclone was getting organized. A strong band of rainfall south of the center of the low’s circulation was shown with data from GPM’s Microwave Imager (GMI) and Dual-Frequency Precipitation Radar (DPR) instruments. DPR measurements found that an intense shower in this band was dropping rain at a rate of over 155 mm (6.1 inches) per hour.
GPM’s radar data (DPR Ku Band) data was used to create a 3-D slice through the forming tropical depression. The 3-D image, created at NASA’s Goddard Space Flight Center in Greenbelt, Md. showed intensity and heights of precipitation in some tall storms reached heights of over 15 km (9.3 miles).
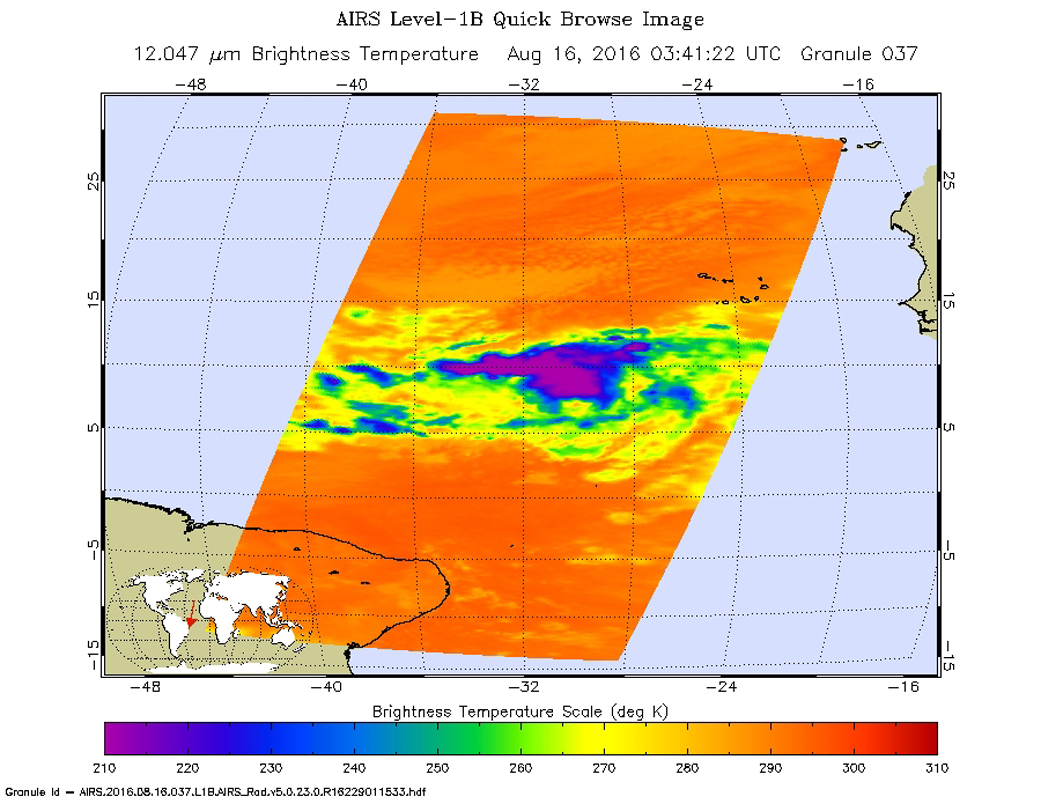
The Atmospheric Infrared Sounder or AIRS instrument that flies aboard NASA’s Aqua satellite analyzed the depression within an hour after it formed. AIRS looked at Tropical Depression 6 (TD6) in infrared light on Aug. 16 at 11:41 p.m. EDT (0341 UTC on Aug. 17) gathering temperature data of the system’s clouds. Strong thunderstorms were seen north of the center of circulation where cloud top temperatures exceeded minus 63 degrees Fahrenheit (minus 53 degrees Celsius). Storms with temperatures that cold are high in the troposphere and NASA research has shown they have the ability to generate heavy rain.
On Aug. 17 at 11 a.m. EDT the National Hurricane Center discussion noted “The depression’s overall cloud pattern and low-level wind field have continued to improve, although cloud tops have warmed considerably near the center since the previous advisory.”
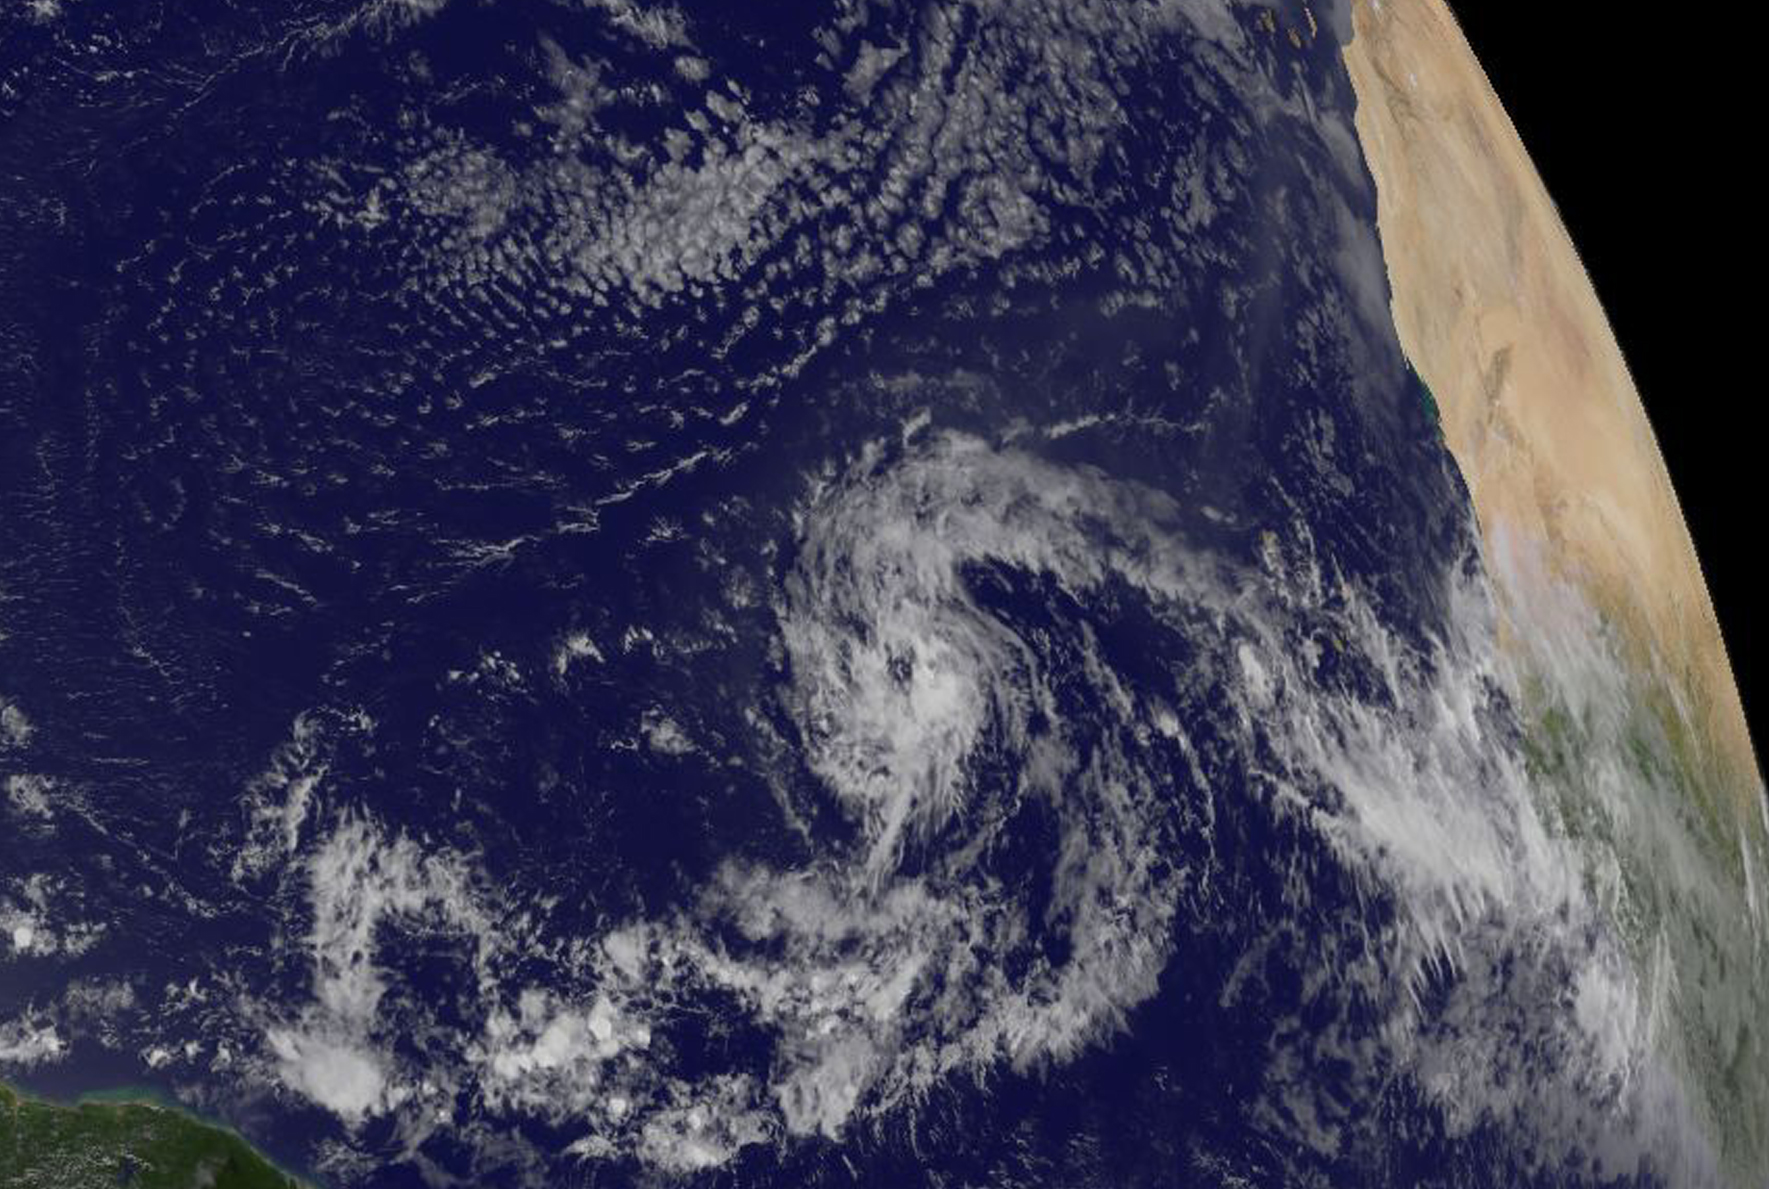
NOAA’s GOES-East satellite captured a visible image of Tropical Depression 6 in the far eastern Atlantic on Aug. 17 at 10:45 a.m. EDT (1645 UTC). NOAA manages the GOES series of satellites and the NASA/NOAA GOES Project at NASA’s Goddard Space Flight Center in Greenbelt, Maryland uses the satellite data to create images and animations.
At 11 a.m. EDT (1500 UTC) the center of Tropical Depression Six (TD6) was located near 14.0 degrees north latitude and 36.4 degrees west longitude, about 840 miles (1,350 km) west of the Cape Verde Islands. The Cape Verde islands are made up of two small archipelagos, located about 400 miles off of Africa’s west coast.
The National Hurricane Center (NHC) said that the depression is moving toward the west-northwest near 15 mph (24 kph) and this motion with some decrease in forward speed is expected during the next couple of days.
Maximum sustained winds are near 35 mph (55 kph) with higher gusts. Slow strengthening is forecast during the next 48 hours, and the depression is likely to become a tropical storm today, Aug. 17.
For the latest forecasts on TD6, visit the National Hurricane Center website: www.nhc.noaa.gov.
Rob Gutro / Hal Pierce
NASA’s Goddard Space Flight Center