


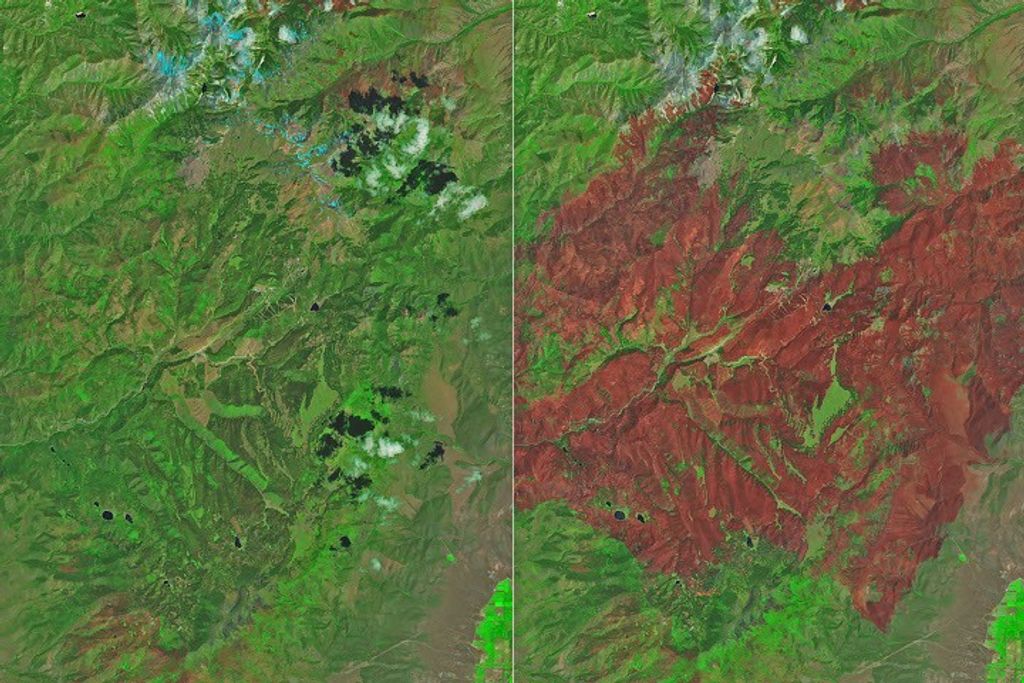


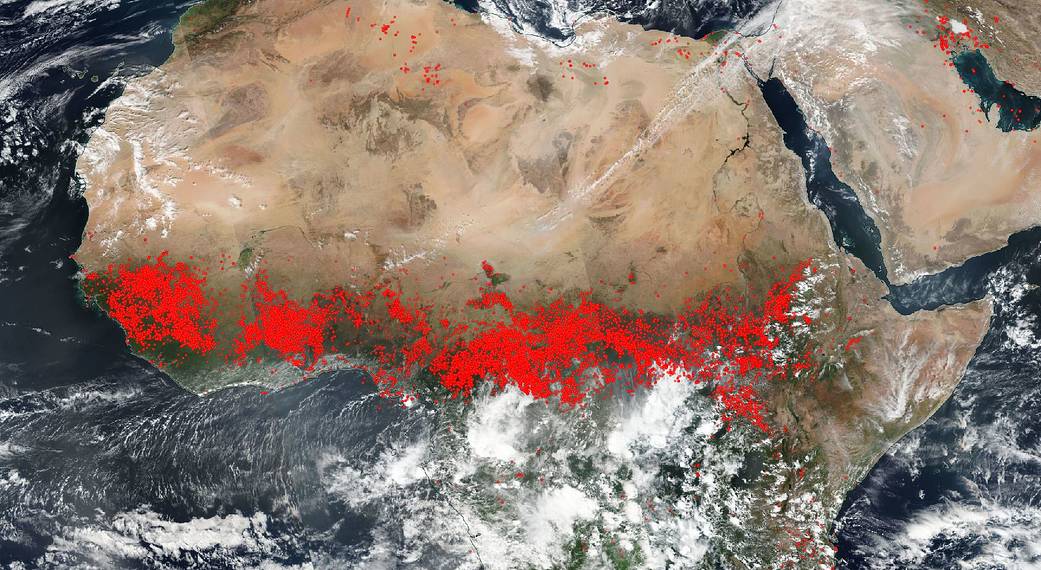
The Moderate Resolution Imaging Spectroradiometer (MODIS) on NASA’s Aqua satellite collected this natural-color image which detected hundreds and hundreds of fires burning in Central Africa on December 16, 2018. The location, widespread nature, and number of fires, and time of year suggest that these fires were deliberately set to manage land. Farmers often use fire to return nutrients to the soil and to clear the ground of unwanted plants. While fire helps enhance crops and grasses for pasture, the fires also produce smoke that degrades air quality. Each hot spot, which appears as a red mark, is an area where the thermal detectors on the MODIS instrument recognized temperatures higher than background. Such hot spots are diagnostic for fire.
The smoke released by any type of fire (forest, brush, crop, structure, tires, waste or wood burning) is a mixture of particles and chemicals produced by incomplete burning of carbon-containing materials. All smoke contains carbon monoxide, carbon dioxide and particulate matter or soot. In addition, smoke can contain other chemicals as well, including aldehydes, acid gases, sulfur dioxide, nitrogen oxides, polycyclic aromatic hydrocarbons (PAHs), benzene, toluene, styrene, metals and dioxins. The type and amount of particles and chemicals in smoke varies depending on what is burning, how much oxygen is available, and the burn temperature. Exposure to high levels of smoke should be avoided. Individuals are advised to limit their physical exertion if exposure to high levels of smoke cannot be avoided.
NASA’s Earth Observing System Data and Information System (EOSDIS) Worldview application provides the capability to interactively browse over 700 global, full-resolution satellite imagery layers and then download the underlying data. Many of the available imagery layers are updated within three hours of observation, essentially showing the entire Earth as it looks “right now. This Suomi NPP satellite image was collected on December 16, 2018. Actively burning fires, detected by thermal bands, are shown as red points. Image Courtesy: NASA Worldview, Earth Observing System Data and Information System (EOSDIS). Caption: Lynn Jenner