


The new projects look at food- and water-supply stability and how changes in human activity are affecting the environment.
The COVID-19 pandemic has touched most aspects of human life. In recent months, NASA has initiated research projects focused on how the human response to the pandemic has affected our environment, like how air quality has improved in the wake of reduced vehicular traffic in many places. But the tentacles of the pandemic extend well beyond that.
How have production disruptions affected agriculture and food supply? What about our ability to forecast water availability in coming months? How do changes in activity levels affect environmental conditions?
NASA’s Earth Science Division recently selected three new projects that aim to answer these and other pandemic-related questions for Rapid Response and Novel Research (RRNES) awards. RRNES is funding quick-turnaround projects that make innovative use of the agency’s resources and data to better understand regional-to-global environmental, economic, and societal impacts of the COVID-19 pandemic.
The new projects join a growing list of RRNES research now underway.
Food Supply Monitoring
Shutdowns in response to COVID-19 left many farmers facing two distinct problems: labor shortages brought on by travel restrictions, and falling demand resulting from the closures of restaurants and schools. Realizing that their labor costs would exceed the value of their crops, some farmers decided to forgo harvesting them.
The impacts don’t stop there. The economic downturn and related unemployment put food security at risk for many people, especially in developing countries. Import and export restrictions, COVID-19 outbreaks in and around port cities, and other supply-chain disruptions have all added to uncertainty in agricultural markets. In order to monitor the development of crop conditions globally, these factors and others need to be taken into consideration.
University of Maryland scientist and NASA Harvest data lead Michael Humber and his colleagues are working on a project that brings all of the relevant Earth Science data together in one easy-to-access place. In line with the mission of NASA’s food-security-focused program, NASA Harvest is striving to expand open access to agricultural data that can help inform food policy decisions.
“Our goal is to provide an interactive, web mapping tool that will show you, in just a few clicks, the international and national market situation and primary food-crop assessments supported with remote-sensing data,” Humber said. “You would be able to combine this data with the Johns Hopkins COVID-19 tracker data and the latest pandemic-related updates.”
The information available through the tool will provide policymakers, humanitarian organizations, and others with vital information needed to respond to supply disruptions and other challenges proactively and to make the best decisions for their respective communities.
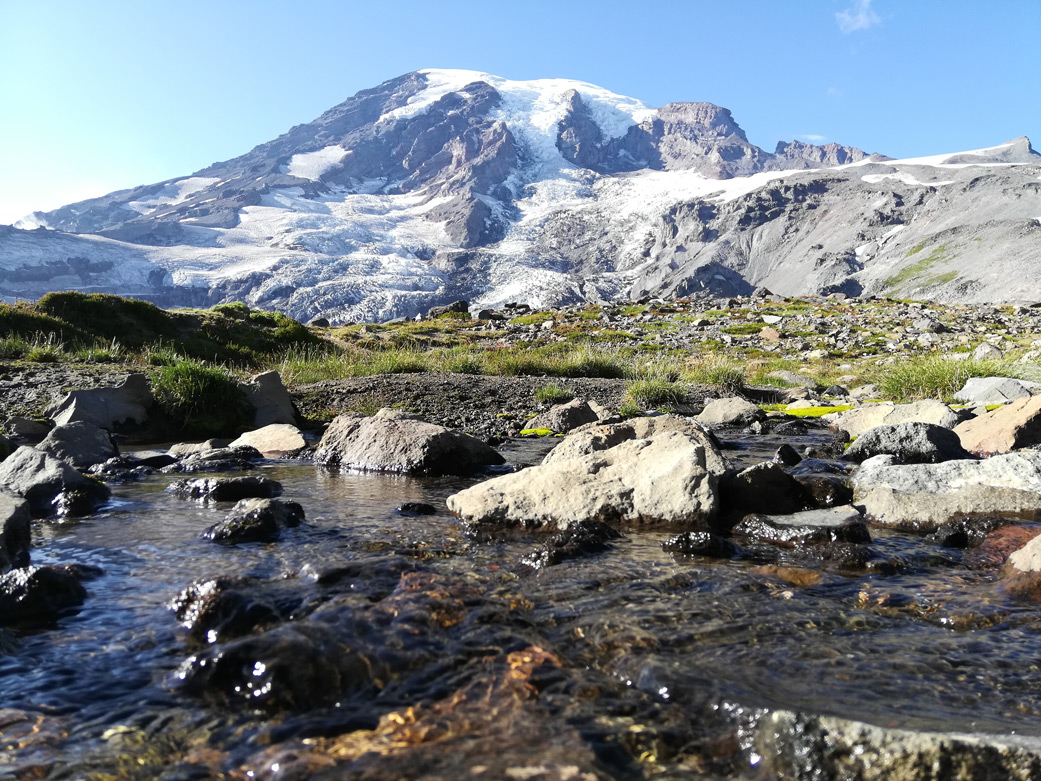
Preserving Water Supply Forecasts With Remote Sensing
In the semiarid western U.S., farmers and water resource managers rely on water supply forecasts both to ensure there is enough water to meet demand and to make the most efficient use of the water available.
The primary variable in these forecasts is what’s called snow water equivalent, which is the amount of water contained in the snow that accumulates and compacts over the winter. In spring and summer, snowmelt becomes a significant freshwater source. Each month, surveyors take manual measurements of snow water equivalent at hundreds of monitoring stations across the region.
But what happens when a global pandemic limits the surveyors’ ability to travel and take these measurements?
“As the pandemic evolved, we quickly discovered that the ground-based data that water resource managers have historically relied on for their decision making is potentially not going to be as readily available as it was in the past, because it requires people in trucks or in helicopters going out into the field to make these measurements,” said University of Colorado scientist Noah Molotch. “Our project will leverage remotely-sensed snow data to fill these data gaps.”
In doing so, Molotch and his colleagues hope to minimize disruptions to the water supply forecasts on which so many water and agricultural professionals rely.
Activity Mapping: Slowing Down and Speeding Up
Most governments responded to the COVID-19 pandemic by implementing some form of shutdown; however, shutdown orders and their enforcement have varied extensively at local, national, and global levels. To determine what effects these reductions in activity have had on virus control and on the environment, we need to look at the global picture. Luckily, satellites make that possible.
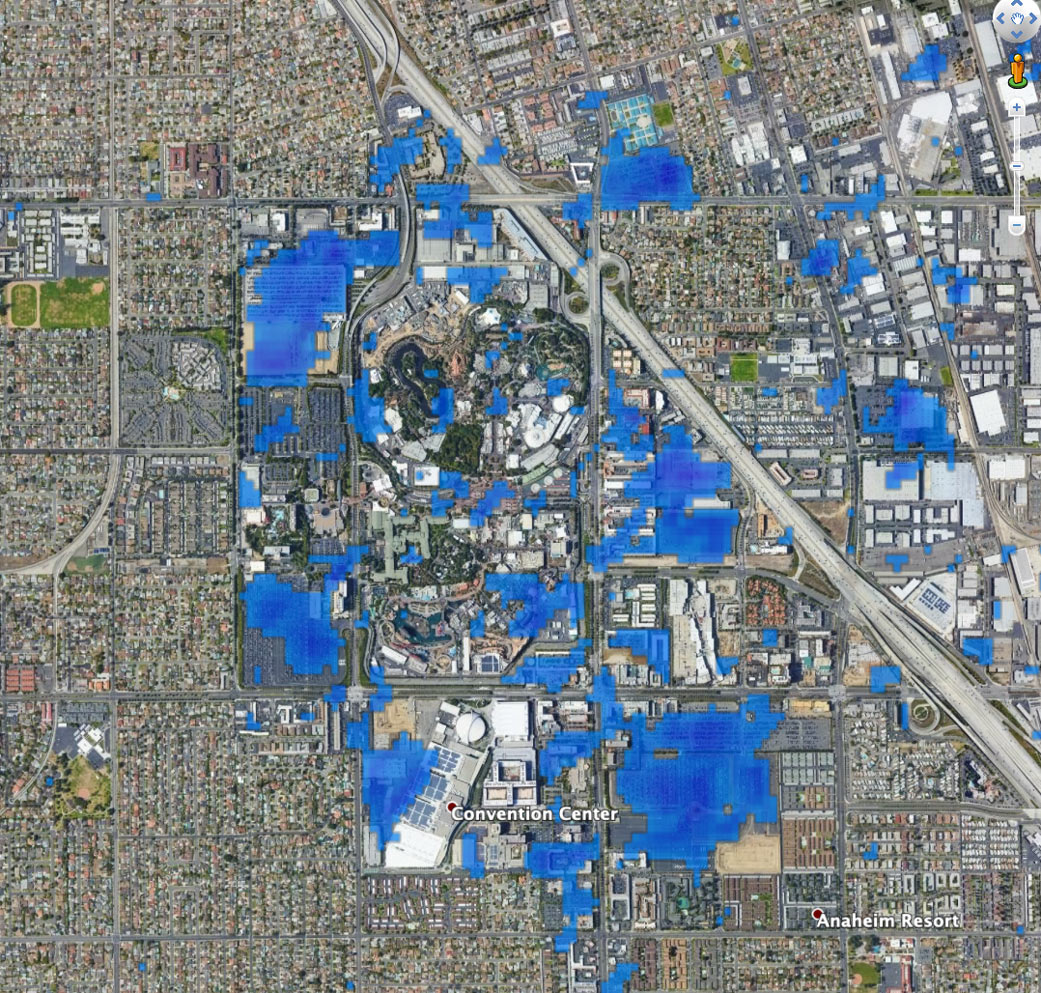
Scientist Sang-Ho Yun and his team at NASA’s Jet Propulsion Laboratory, along with researchers from the Earth Observatory of Singapore, are using satellite-derived synthetic aperture radar (SAR) data to map changes in activity levels in cities around the world.
SAR data can show changes to Earth’s surface over time. In this case, the scientists are looking at things like how the concentration and arrangement of cars in parking lots and on highways has changed from pre-pandemic patterns as well as changes to construction sites.
“Using the SAR data, we’ll be able to provide citywide maps that quantify the changes in activity, both the slowing down due to lockdowns and the gradual increase as governments decide to reopen,” said Yun. “These maps will help us to better understand how activity reductions correspond to different cities’ levels of success in controlling virus outbreaks, and how those reductions correspond to observed improvements in environmental conditions like air quality.”
Research from this project will also be incorporated into NASA’s COVID-19 dashboard.
NASA accepts proposals for new RRNES research on a rolling basis.
Ian J. O’Neill / Jane J. Lee
Jet Propulsion Laboratory, Pasadena, Calif.
818-354-2649 / 818-354-0307
ian.j.oneill@jpl.nasa.gov / jane.j.lee@jpl.nasa.gov
Written by Esprit Smith, NASA’s Earth Science News Team
2020-147