


A new study of Southern California’s largest earthquake sequence in two decades provides new evidence that large earthquakes can occur in a more complex fashion than commonly assumed. The analysis by geophysicists from Caltech and NASA’s Jet Propulsion Laboratory, both in Pasadena, California, documents a series of ruptures in a web of interconnected faults, with rupturing faults triggering other faults.
The dominoes-like sequence of ruptures also increased strain on a nearby major fault, according to the study, which was published today in the journal Science.
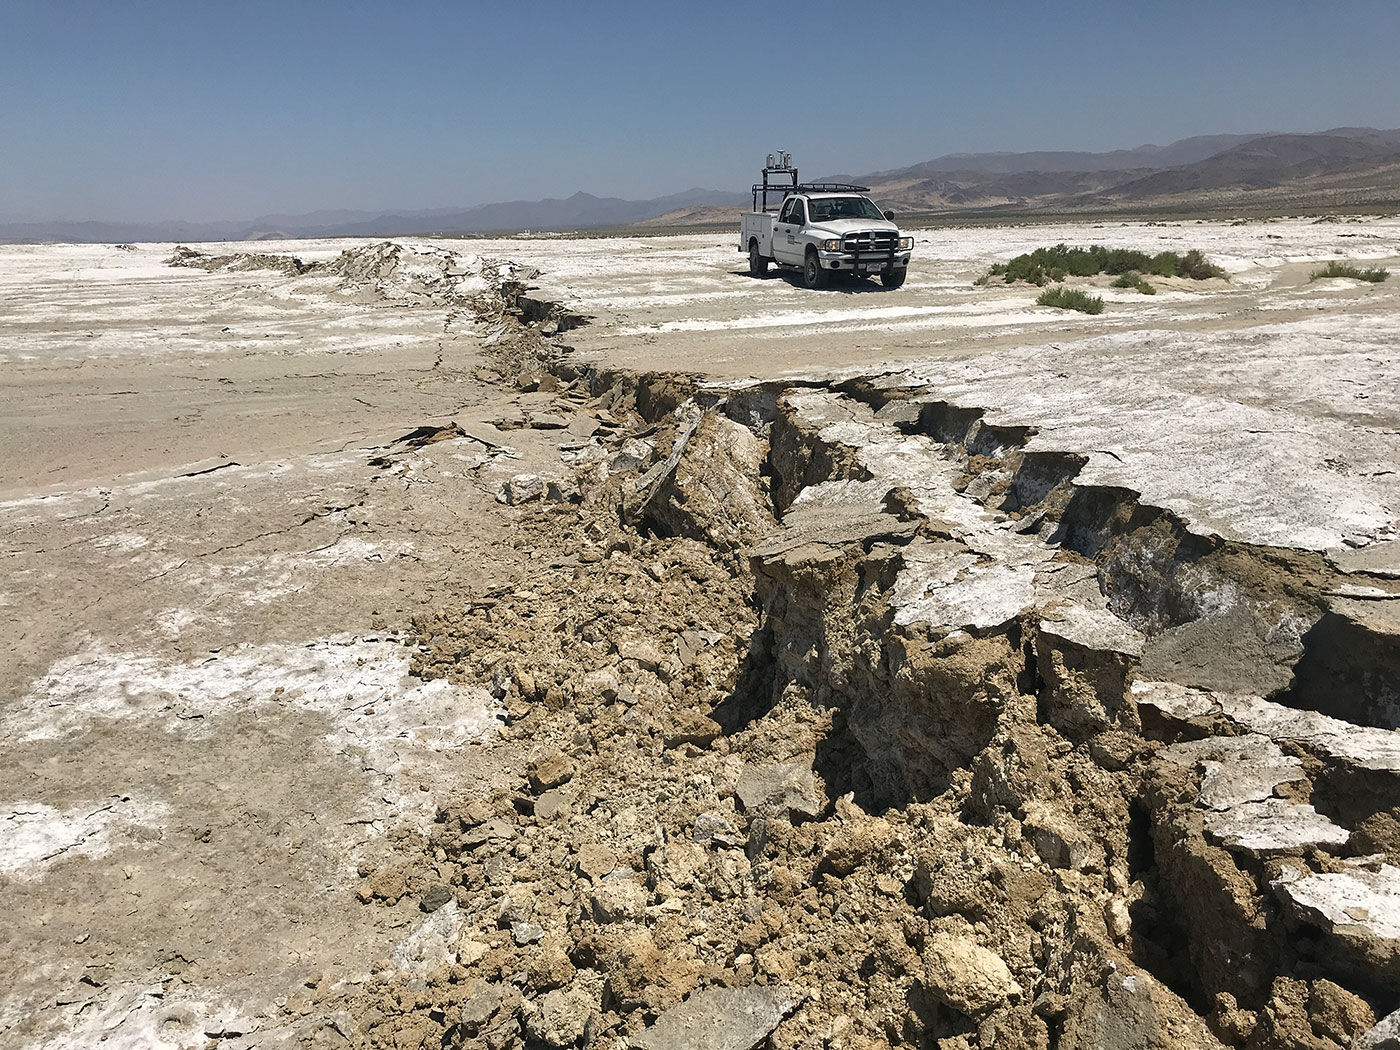
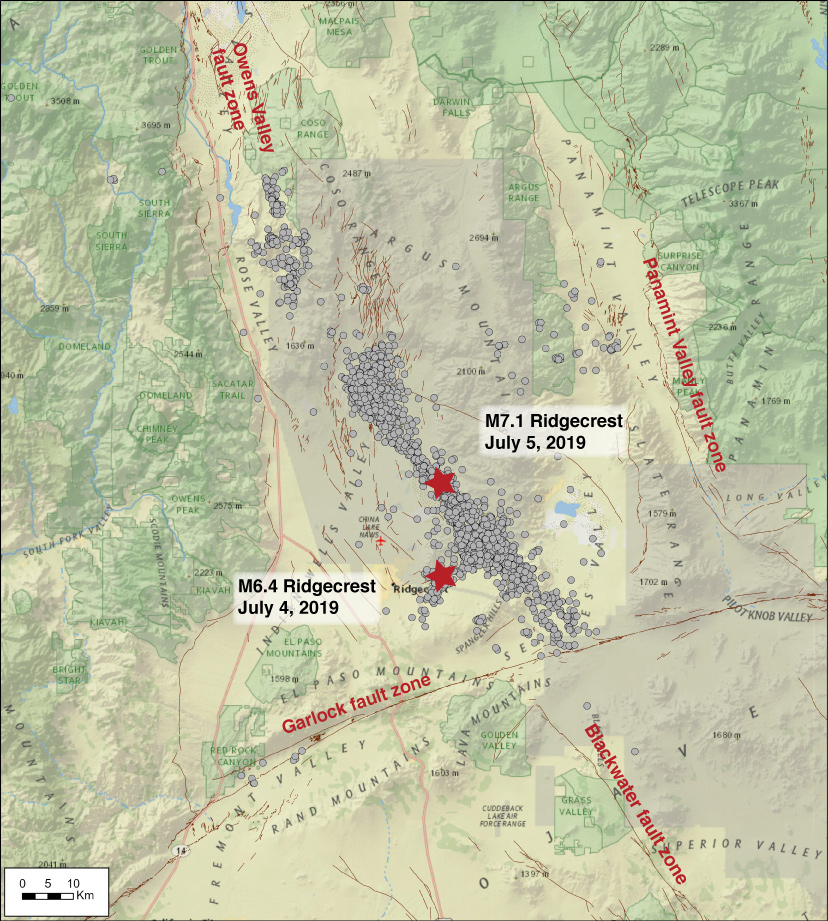
The Ridgecrest Earthquake Sequence began with a magnitude 6.4 foreshock on July 4, 2019, followed by a magnitude 7.1 mainshock the next day with more than 100,000 aftershocks. The sequence rattled most of Southern California, but the strongest shaking occurred about 120 miles (190 kilometers) north of Los Angeles near the town of Ridgecrest.
“This ended up being one of the best-documented earthquake sequences in history,” said Zachary Ross, assistant professor of geophysics at Caltech and lead author of the Science paper. Ross developed an automated computer analysis of seismometer data that detected the enormous number of aftershocks with highly precise location information, and the JPL team members analyzed data from international radar satellites ALOS-2 (from the Japan Aerospace Exploration Agency, or JAXA) and Sentinel-1A/B (operated by the European Space Agency, or ESA) to map fault ruptures at Earth’s surface.
“I was surprised to see how much complexity there was and the number of faults that ruptured,” said JPL co-author Eric Fielding.
The satellite and seismometer data together depict an earthquake sequence that is far more complex than those found in the models of many previous large seismic events. Major earthquakes are commonly thought to be caused by the rupture of a single long fault, such as the more than 800-mile-long (1,300-kilometer-long) San Andreas fault, with the maximum possible magnitude dictated primarily by the length of the fault. After a large 1992 earthquake in Landers, California, ruptured several faults, seismologists began rethinking that model.
The Ridgecrest sequence involved about 20 previously undiscovered, smaller faults crisscrossing in a geometrically complex and geologically young fault zone.
“We actually see that the magnitude 6.4 quake simultaneously broke faults at right angles to each other, which is surprising because standard models of rock friction view this as unlikely,” Ross said.
The complexity of the event is only clear because of the multiple types of scientific instruments used to study it. Satellites observed the surface ruptures and associated ground deformation extending out over 60 miles (100 kilometers) in every direction from the rupture, while a dense network of seismometers observed the seismic waves that radiated from the earthquake. Together, these data allowed scientists to develop a model of how the faults slipped below the surface and the relationship between the major slipping faults and the significant number of small earthquakes occurring before, between and after the two largest shocks.
The Ridgecrest ruptures ended just a few miles shy of the Garlock Fault, a major east-west fault running more than 185 miles (300 kilometers) from the San Andreas Fault to Death Valley. The fault has been relatively quiet for the past 500 years, but the strain placed on the Garlock Fault by July’s earthquake activity triggered it to start slowly moving, a process call fault creep. The fault has slipped 0.8 inches (2 centimeters) at the surface since July, the scientists said.
The event illustrates how little we still understand about earthquakes. “It’s going to force people to think hard about how we quantify seismic hazard and whether our approach to defining faults needs to change,” Ross said. “We can’t just assume that the largest faults dominate the seismic hazard if many smaller faults can link up to create these major quakes.”
The Science paper is titled “Hierarchical interlocked orthogonal faulting in the 2019 Ridgecrest earthquake sequence.”
Esprit Smith
Jet Propulsion Laboratory, Pasadena, Calif.
818-354-4269
esprit.smith@jpl.nasa.gov
Robert Perkins
Caltech, Pasadena, Calif.
626-395-1862
rperkins@caltech.edu
2019-207