Aug. 21, 2017, marked a unique opportunity for scientists in the contiguous U.S. — for the first time in nearly a century, a total solar eclipse would sweep coast to coast, providing scientists under the path of totality with a rare chance to study the Sun and Earth in uncommon ways. Now, scientists are sharing some of what they’ve learned so far and their plans for science during future eclipses.
One of the primary scientific advantages of a total solar eclipse is the way it reveals our star. With the Sun’s face blocked out by the Moon, the outer atmosphere of the Sun — the corona, which is too faint to see when observed right next to the overwhelming brightness of the Sun’s face — can shine.
Star of the eclipse
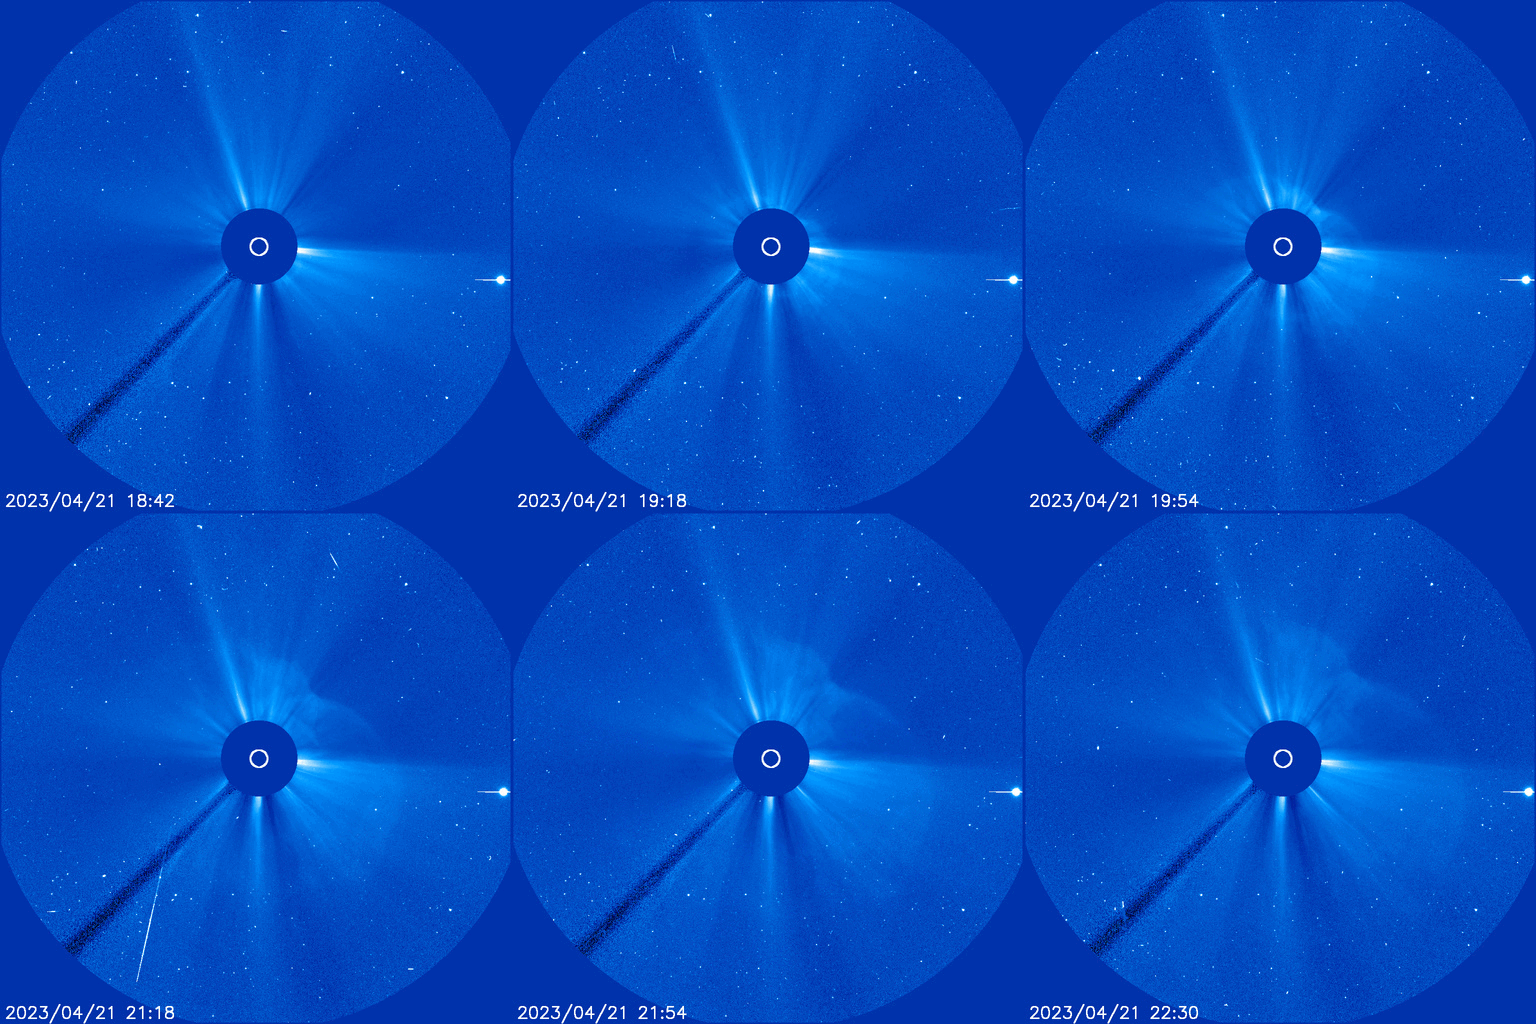
Scientists can study the corona in more limited ways outside of eclipses using instruments called coronagraphs. Coronagraphs create constant, artificial eclipses by using solid disks or spheres to block out the photosphere and reveal the corona. But because of a property of light called diffraction, coronagraphs must block out some parts of the lower corona in order to obtain a crisp image.
A natural total solar eclipse suffers from no such limitations: The very lowest reaches of the corona are visible, and in clear detail. Several NASA-funded experiments took advantage of this rare look at the lower corona on Aug. 21, 2017.
A team led by Nat Gopalswamy, a solar scientist at NASA’s Goddard Space Flight Center, tested a new instrument during the 2017 total solar eclipse — a camera that could capture multiple wavelengths of polarized light from the Sun’s corona simultaneously, without the need for a moving part that rotates through different types of polarization filters. Their experiment showed that such an instrument could be effective in studying the Sun’s corona — a boon for spaceflight, where moving parts such a polarization wheel add more potential failure points to a mission. The team’s work has already been incorporated into an instrument that flew on the BITSE scientific balloon in 2018, and continued work on the concept could make it ready to potentially fly as a space-borne instrument.
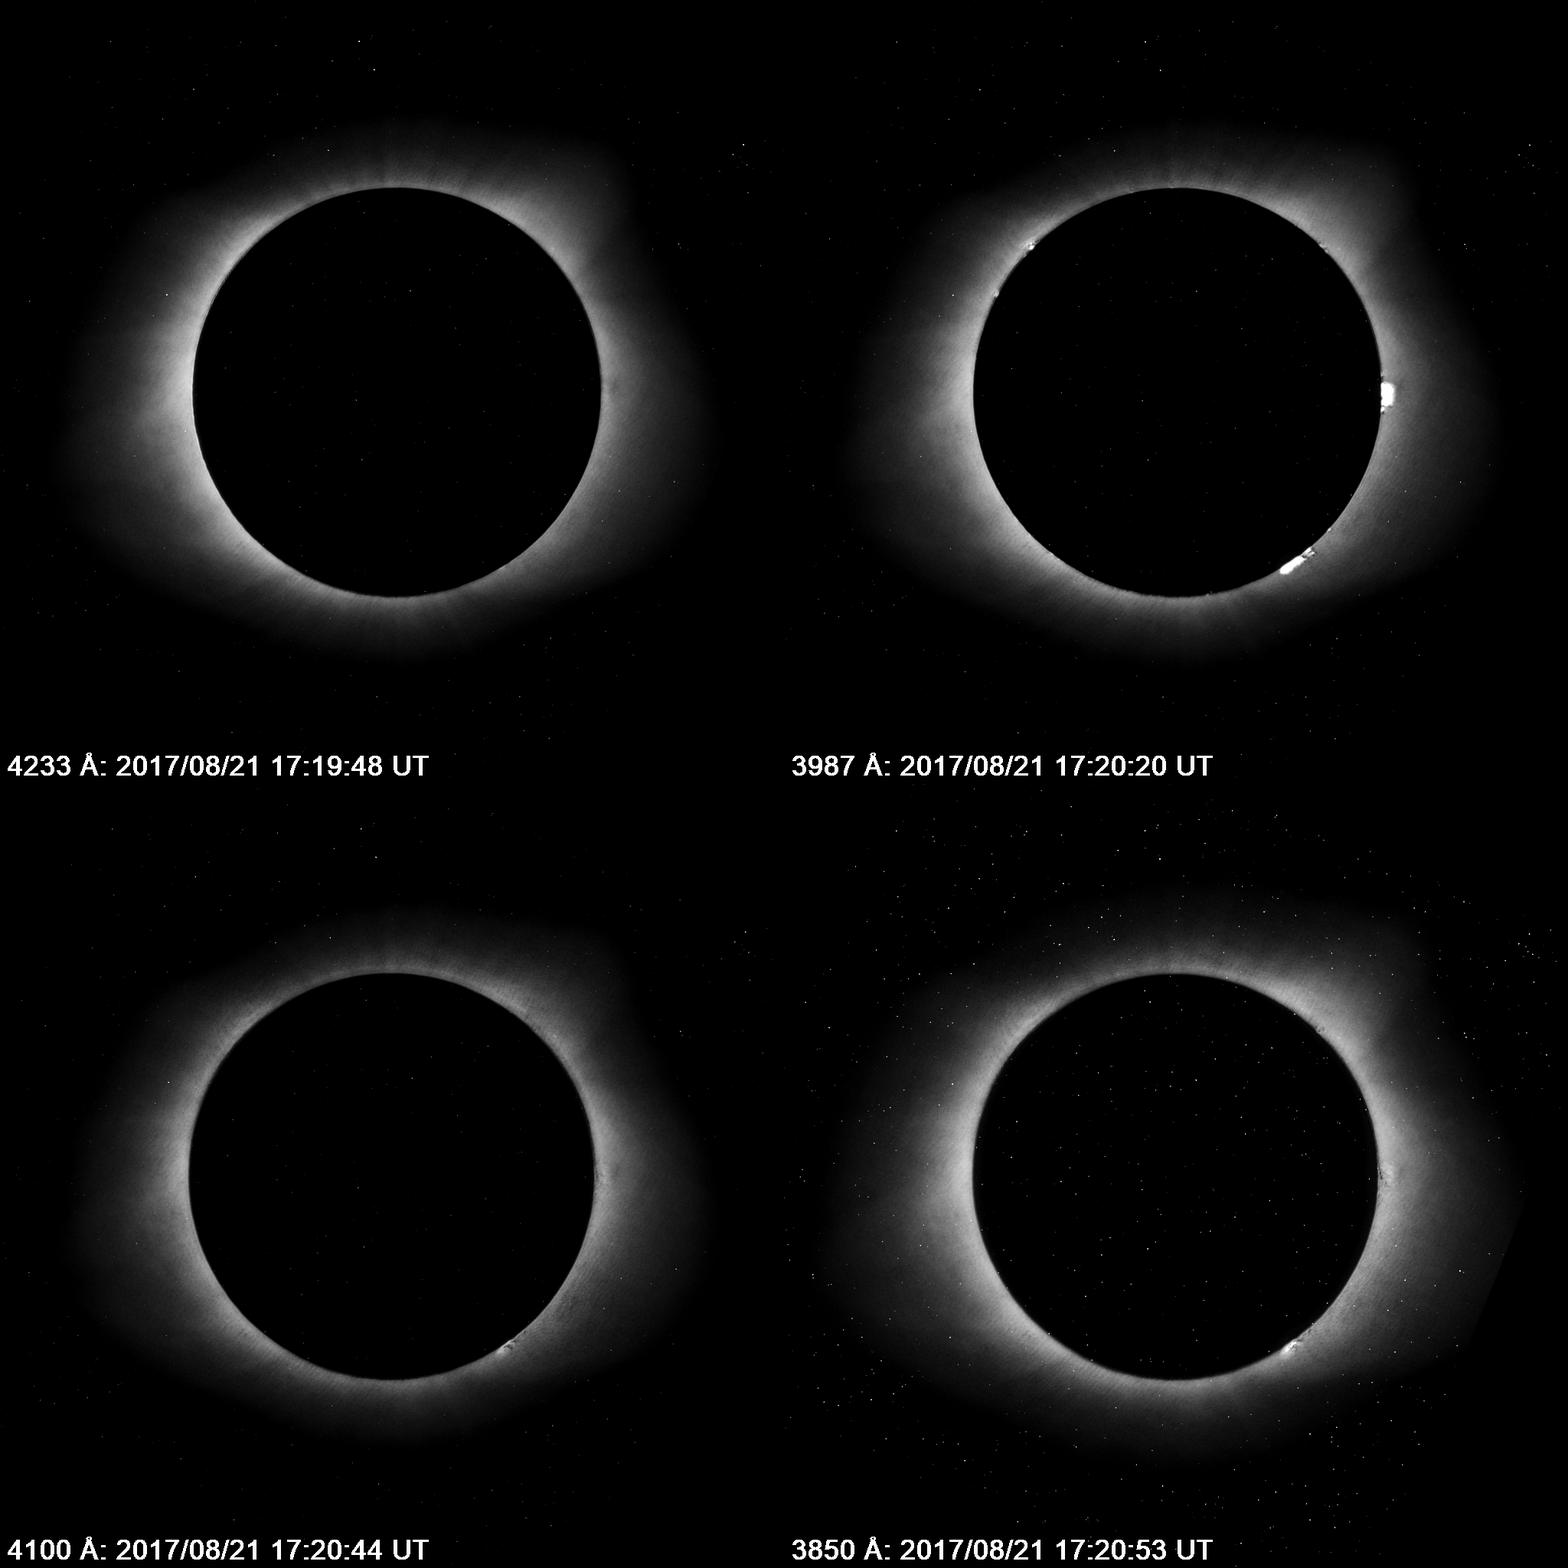
In addition to acting as a technological proof of concept, their data also revealed some intriguing questions. In particular, differences in temperature throughout the Sun’s corona may shed light on the formation and behaviors of different structures within the corona.
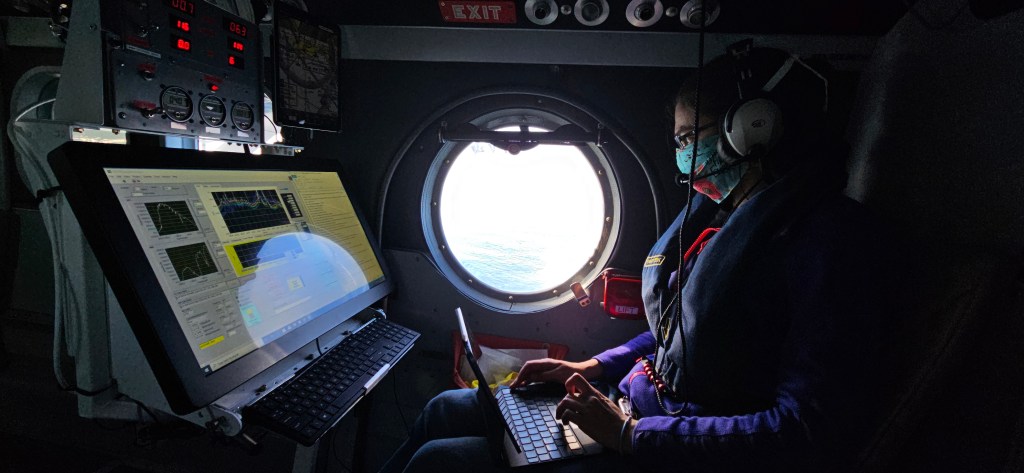
Amir Caspi and team used a pair of retrofitted WB-57F jet planes to chase the eclipse in 2017, giving them a longer observation time. Early results from the gathered data indicate a few promising features for further study, some of which could help illuminate more about the dynamics of the corona, including the formation of structures linked to solar storms — massive clouds of solar material that are launched into space — and the corona’s counterintuitively high temperatures. Their analysis continues — with the help of several student scientists — and the team is hoping to share more research soon.
Shadia Habbal of the University of Hawaii’s Institute for Astronomy in Honolulu led a team to image the Sun from multiple sites during the 2017 total solar eclipse, spread out across the long path of totality. The team used their measurements at different wavelengths of light to trace changes in the corona’s temperature throughout the eclipse, revealing changes caused by a coronal mass ejection traveling through the corona at the time of the eclipse. The team’s data from the 2017 eclipse has also played a role in a larger study, which examined the changing shape of the Sun’s magnetic field over the past two decades. Tracking such shifts helps scientists improve computer models of the solar atmosphere — powerful tools for understanding the Sun’s cycles of activity.
Paul Bryans and Philip Judge, both of the High Altitude Observatory in Boulder, Colorado, ran complementary experiments to study the solar corona in infrared light. Along with data from other High Altitude Observatory experiments, their measurements revealed unexpected signatures of helium from the corona throughout the eclipse. The teams continued their work with further experiments during the July 2, 2019, total solar eclipse over Chile, with analysis of this work in progress.
Read about more Sun-focused studies from the August 2017 total solar eclipse.
The Sun-Earth connection
A total solar eclipse also provides a chance to study Earth’s atmosphere under an unusual circumstance: the sudden, localized onset of nighttime conditions, outside the usual day-night cycle. This abrupt darkness over a narrow path of land can help scientists tease apart just how the Sun’s energy affects the atmosphere.
A team led by Phil Erickson of the MIT Haystack Observatory used radar and GPS measurements to study the response of the electrically-charged upper atmosphere, a region called the ionosphere, to the total solar eclipse. The charged particles of the ionosphere — created when neutral atoms are split apart by the Sun’s intense radiation — respond to both conditions in space and changes in Earth’s lower atmosphere, making their behavior unpredictable. Changes in the ionosphere can disrupt communications and navigation signals, so understanding how it responds to the Sun’s energy is a key part of safeguarding our technology.
Erickson’s team has published several findings based on their 2017 eclipse data — from changes in electron density more than 600 miles away from the path of the total eclipse to differences in the way the ionosphere is disturbed based on the time of day at which the eclipse crossed over. As part of this work, MIT Haystack researcher Shunrong Zhang and colleagues found bow waves — similar to those that ripple out from a boat moving through water — in the ionosphere, rippling out from the path of the eclipse. These traveling disturbances in the ionosphere can be linked to some of the space weather events that affect human technology. Erickson and team look forward to future eclipses to further explore the phenomena they observed.
Credits: MIT Haystack Observatory/Zhang et al.
Another team led by Bob Marshall from the University of Colorado Boulder relied on very-low frequency radio waves to measure changes in the lowest and least dense region of the ionosphere. Their work has shed new light on how the electron content — which is influenced by the composition of the atmosphere — at even the lowest reaches of the ionosphere can impact the way that such radio waves travel throughout the ionosphere. The team hopes to perform more very-low frequency radio experiments during future eclipses.
Greg Earle of Virginia Tech led a study of the ionosphere’s response to the eclipse using a combination of ionosondes — a specialized transceiver technology for studying the ionosphere — along with radar and GPS data. The team’s data have shown that wind speed and direction are crucial parts of understanding the ionosphere’s response to sudden changes like the eclipse. Several students have used data from the experiment in dissertations.
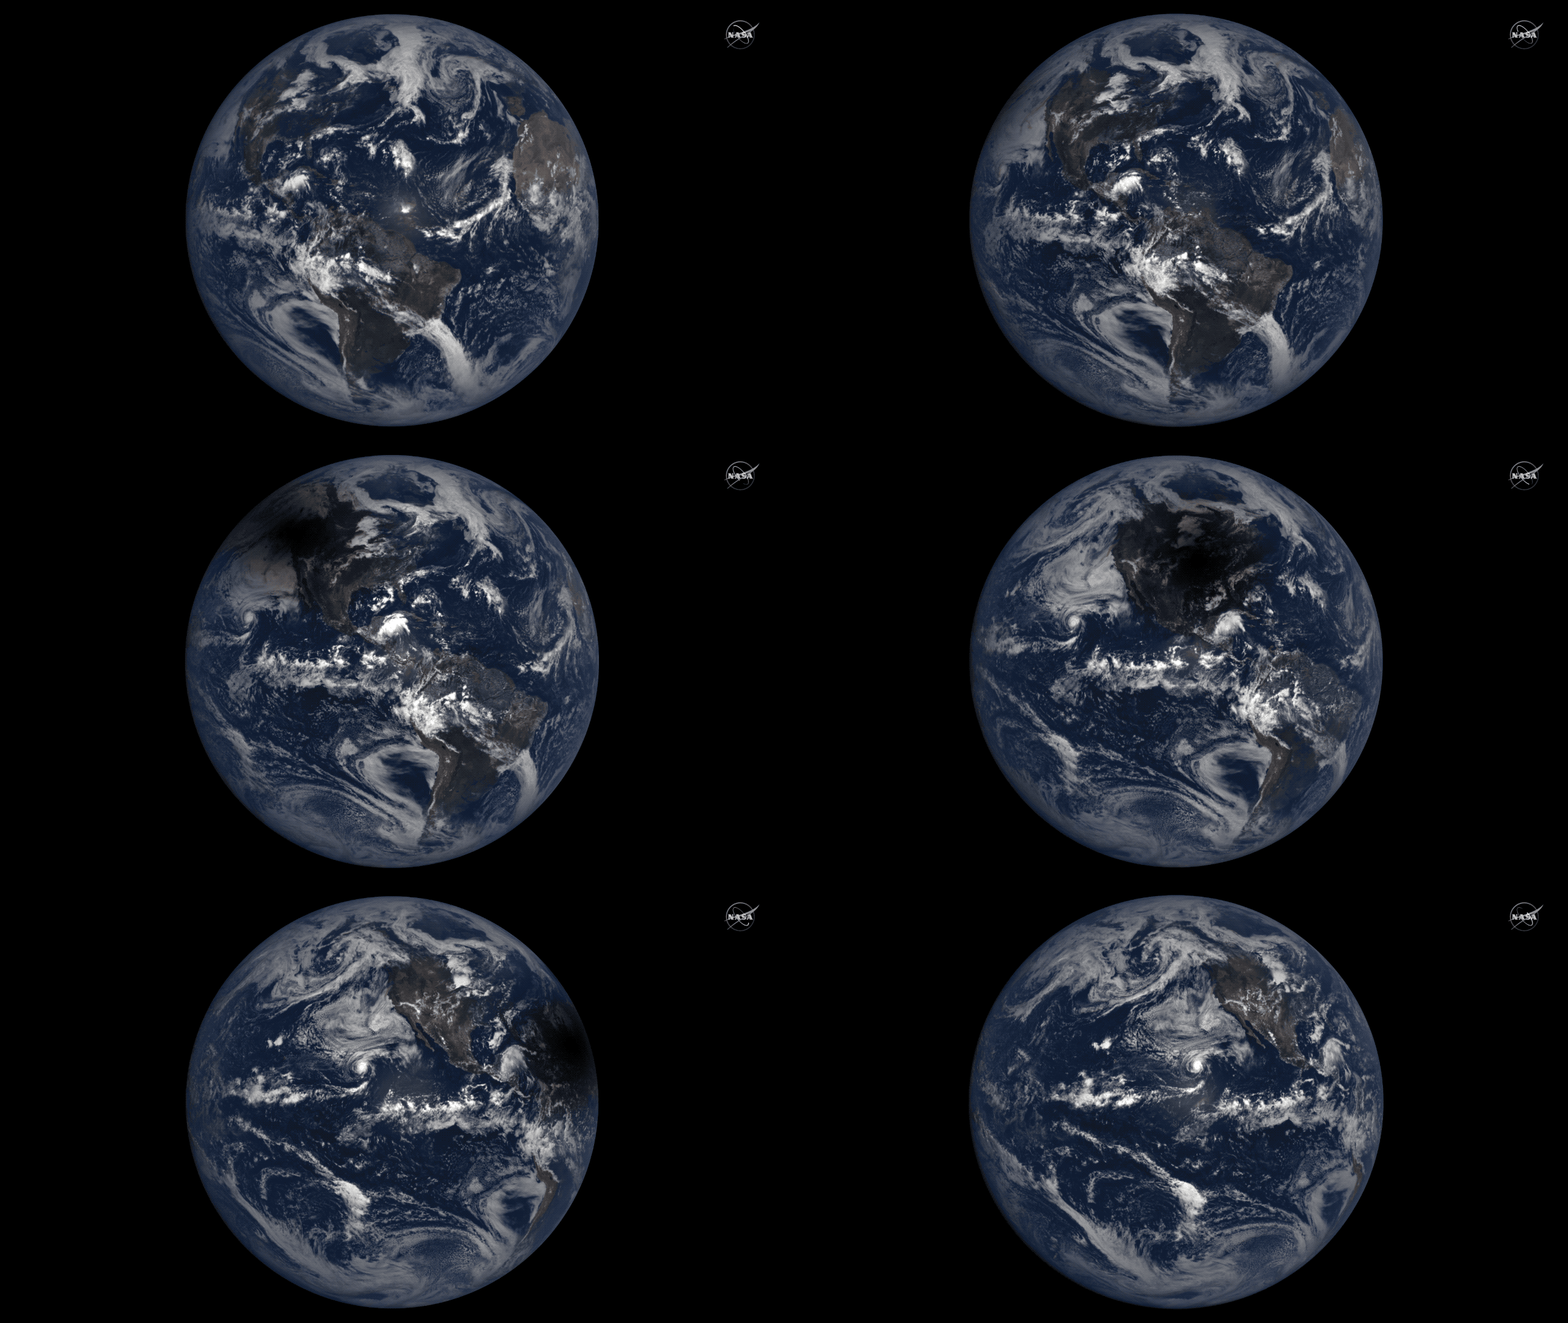
A project led by Guoyong Wen of NASA Goddard used measurements of light reduction during the eclipse to improve models of how clouds affect the amount of energy that reaches and leaves Earth. Their measurements are helping scientists understand how the presence of clouds, and their optical thickness, can impact the amount of sunlight and energy that reaches Earth’s surface.
Read more about 2017 eclipse experiments focused on Earth’s atmosphere.
Dec. 14, 2020, Total Solar Eclipse
Total solar eclipses happen when the Moon lines up just right between the Sun and Earth, casting its shadow on Earth’s surface. Because the Moon’s orbit is tilted, total solar eclipses don’t happen during each lunar orbit, though there is a total solar eclipse somewhere on Earth about once every 18 months.
Chile and Argentina will experience a total solar eclipse on Dec. 14, 2020. NASA will share live images of the eclipse starting at 9:40 a.m. EST on Dec. 14 on NASA TV and the agency’s website, along with a narrated show in Spanish starting at 10:30 a.m. EST. Más información en español sobre el eclipse solar total del 14 de diciembre.
People in North America will have a chance to see a total solar eclipse on April 8, 2024. The path of totality for the 2024 eclipse stretches across parts of Mexico, the U.S. and Canada.
Related Links
By Sarah Frazier
NASA’s Goddard Space Flight Center, Greenbelt, Md.

