


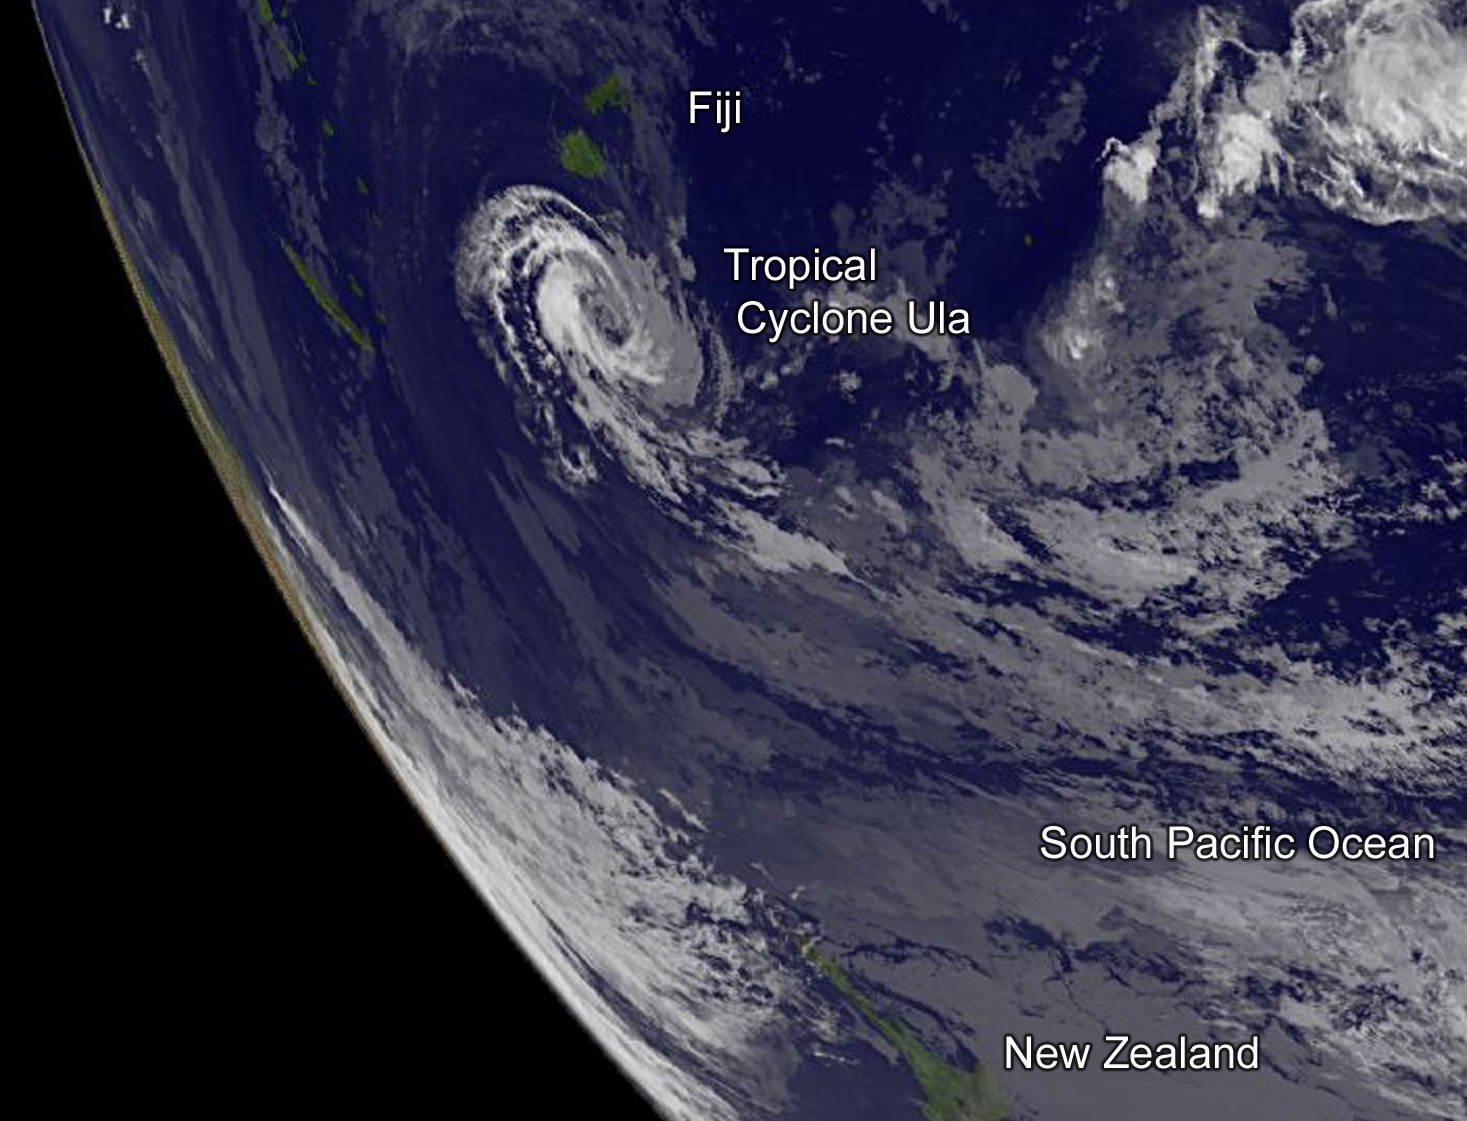
NASA Sees Ula Go Extra-Tropical
NOAA’s GOES-West satellite and NASA’s RapidScat instrument provided a look at Tropical Cyclone Ula after it became extra-tropical north of New Zealand.
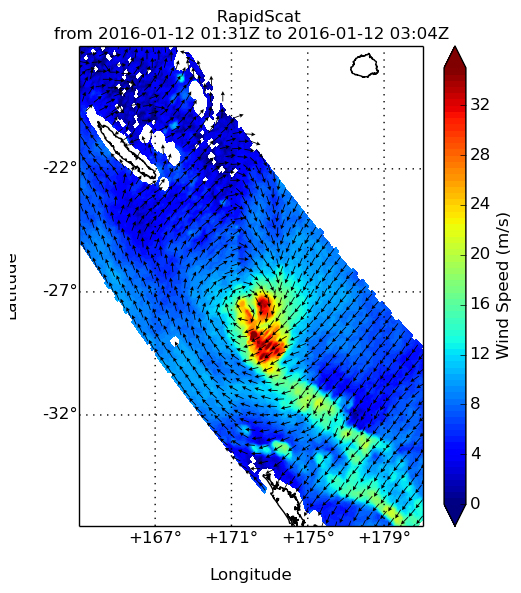
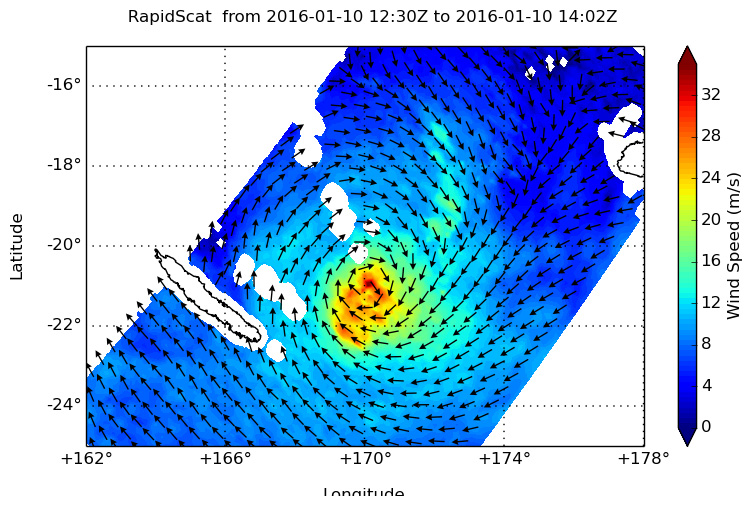
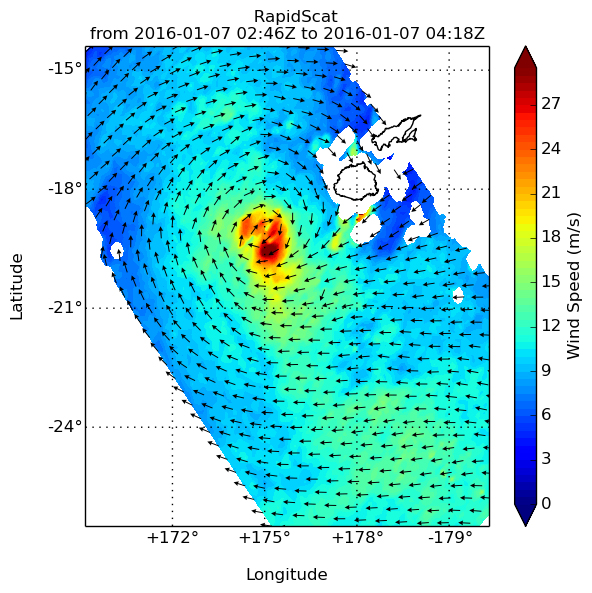
On Jan. 12, RapidScat, instrument that flies aboard the International Space Station, saw Extra-tropical Storm Ula’s strongest winds (red) east to south of the center at 32 meters per second (71.5 mph/ 115.2 kph). Maximum sustained winds are not always equally distributed in a tropical cyclone and the RapidScat instrument helps forecasters find the strongest quadrants of a storm.
Ula ran into increasing vertical wind shear that continued weakening the storm, and pushing its clouds and showers southeast of the center.
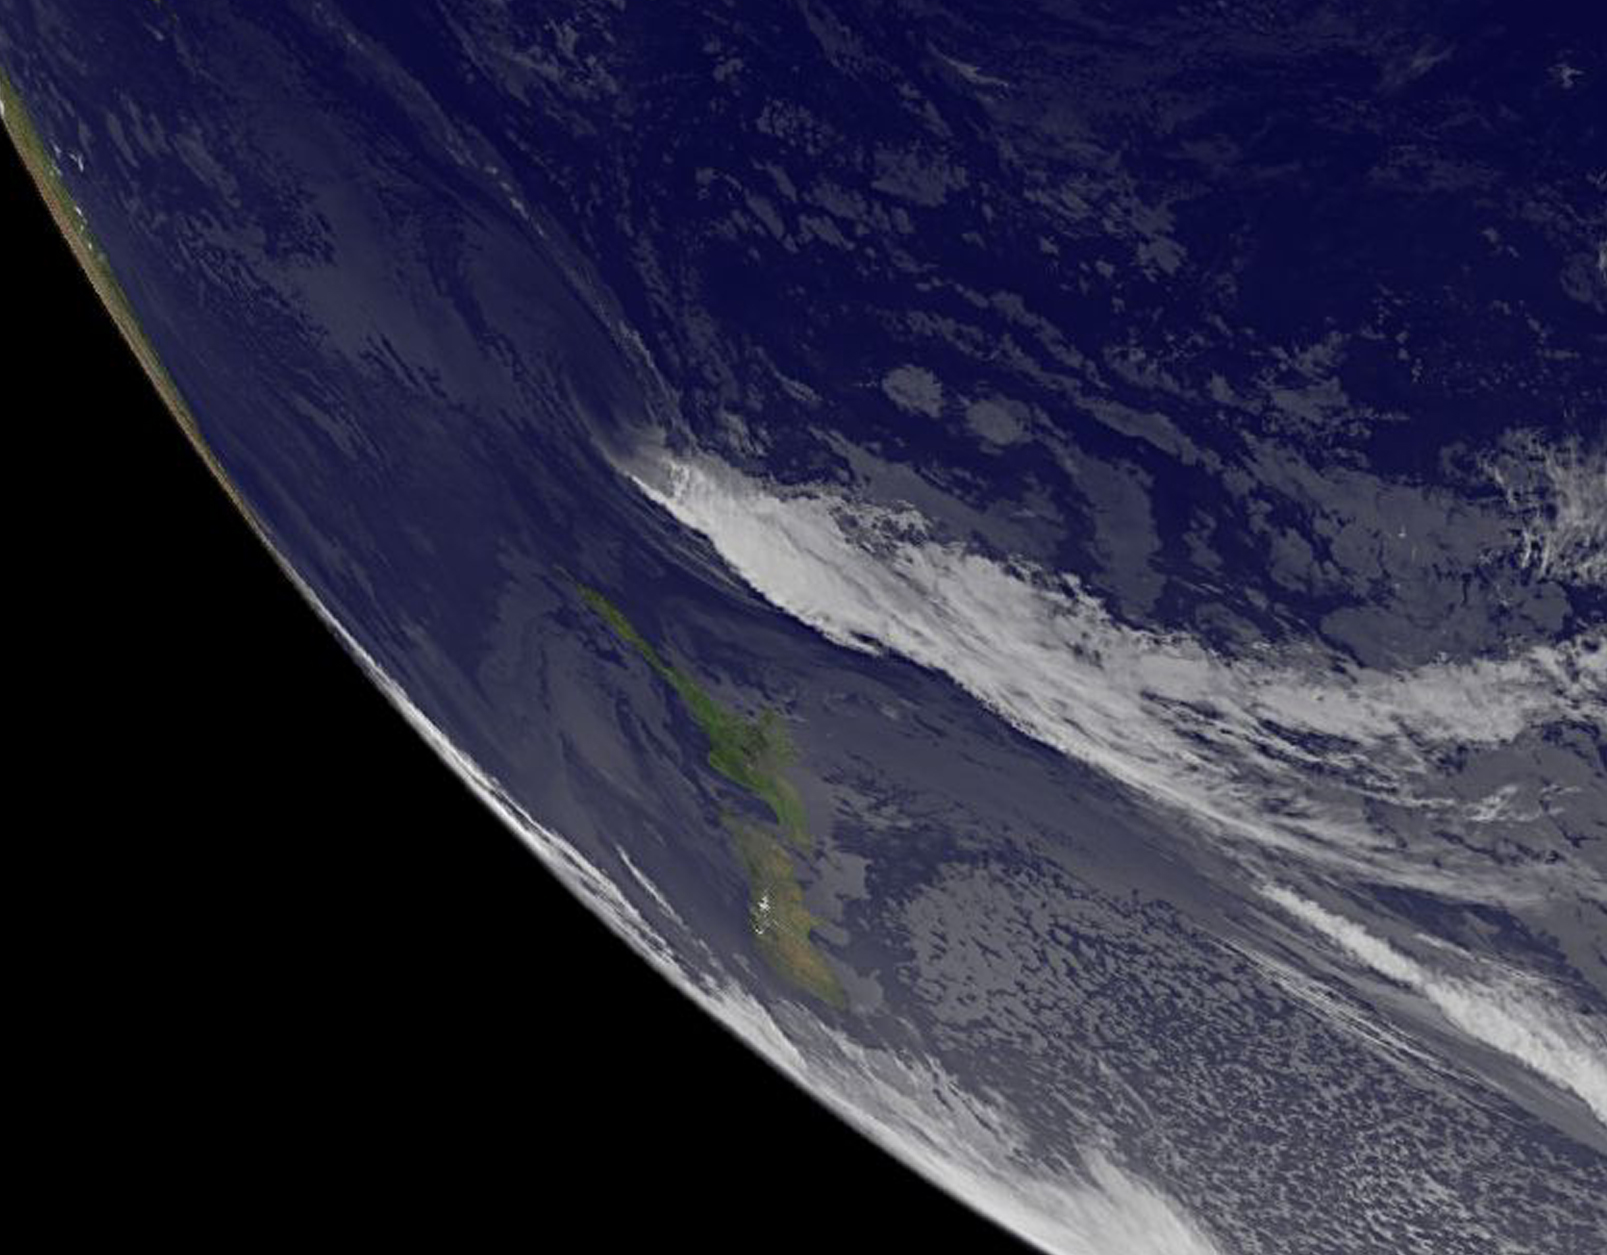
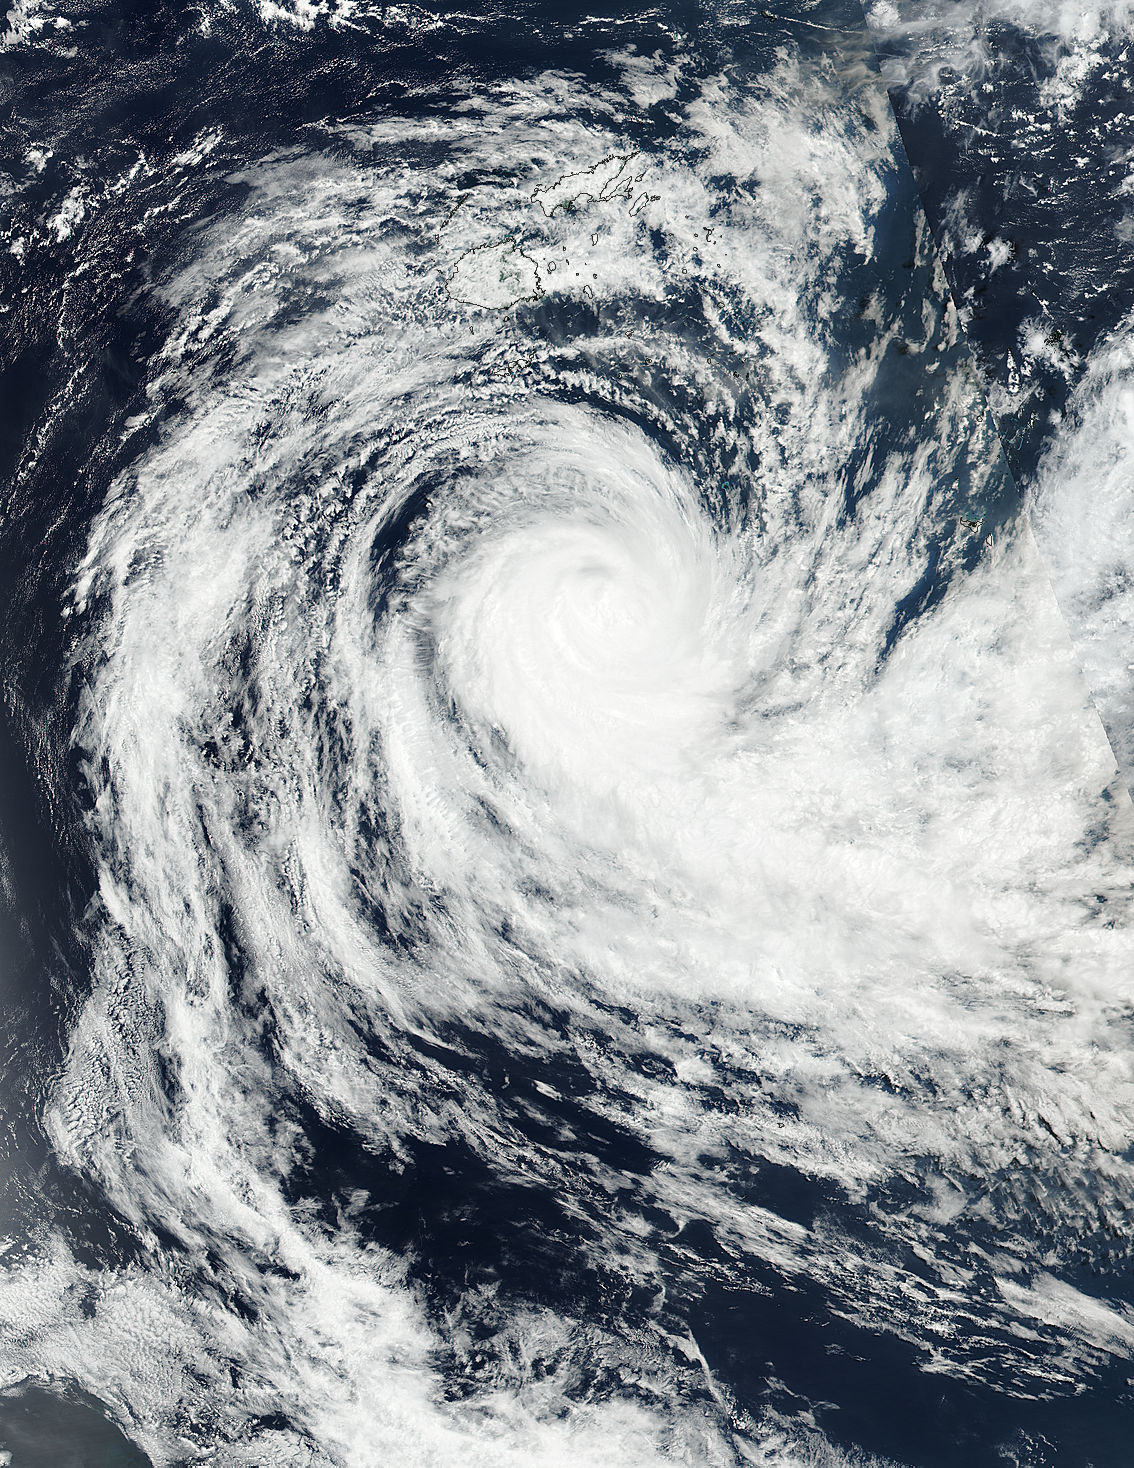
NOAA’s GOES-West satellite captured an infrared view of extra-tropical Storm Ula north of New Zealand on Jan. 13 at 1500 UTC (11 a.m. EST). The image showed the bulk of clouds associated with the storm were pushed to the southeast of the center as a result of strong vertical wind shear. The image was created by the NASA/NOAA GOES Project at NASA’s Goddard Space Flight Center, Greenbelt, Maryland.
At 0000 UTC on Jan. 13 (7 p.m. EST, Jan. 12) Extra-tropical Cyclone Ula ULA (1001hPa) was located over sub-tropical waters near 29.8 south latitude and 175.7 east longitude. Ula was moving south-southeast at 10 knots (11.5 mph/18.5 kph) away from the tropics. Ula is expected to dissipate in a couple of days.
For updated forecasts, visit the New Zealand Meteorological Service at: http://www.metservice.com/national/home.
Rob Gutro
NASA’s Goddard Space Flight Center
Jan. 12, 2016 – Tropical Cyclone Ula’s Winds, Rainfall Seen by NASA’s GPM and RapidScat
A weaker Tropical Storm Ula continued to move through the Southern Pacific Ocean on Jan. 11 after peaking at major hurricane status. NASA’s RapidScat instrument looked at Ula’s winds, while the Global Precipitation Measurement or GPM mission satellite measured rainfall in the storm.
Tropical cyclone Ula’s winds peaked at 115 knots (132 mph) over the weekend of Jan. 9 and 10 Those high winds meant that for a couple days Ula was a category four tropical cyclone on the Saffir-Simpson Hurricane Wind Scale. Ula moved over the waters of the North Fiji Basin between the Fiji Islands and New Caledonia before moving southeastward into the South Fiji Basin.
The GPM core observatory satellite is co-managed by NASA and the Japan Aerospace Exploration Agency. GPM had good views of powerful tropical cyclone Ula during its changes in intensity. On January 8, 2015 at 2216 UTC (5:16 p.m. EST) GPM saw that rain was falling at a rate of over 63.5 mm (2.5 inches) per hour north of the intensifying tropical cyclone’s eye. GPM’s Dual-Frequency Precipitation Radar (DPR) instrument (Ku Band) collected 3-D data at that time that showed cloud tops reached heights above 12.2 km (7.6 miles) in Ula’s inner and outer eye walls.
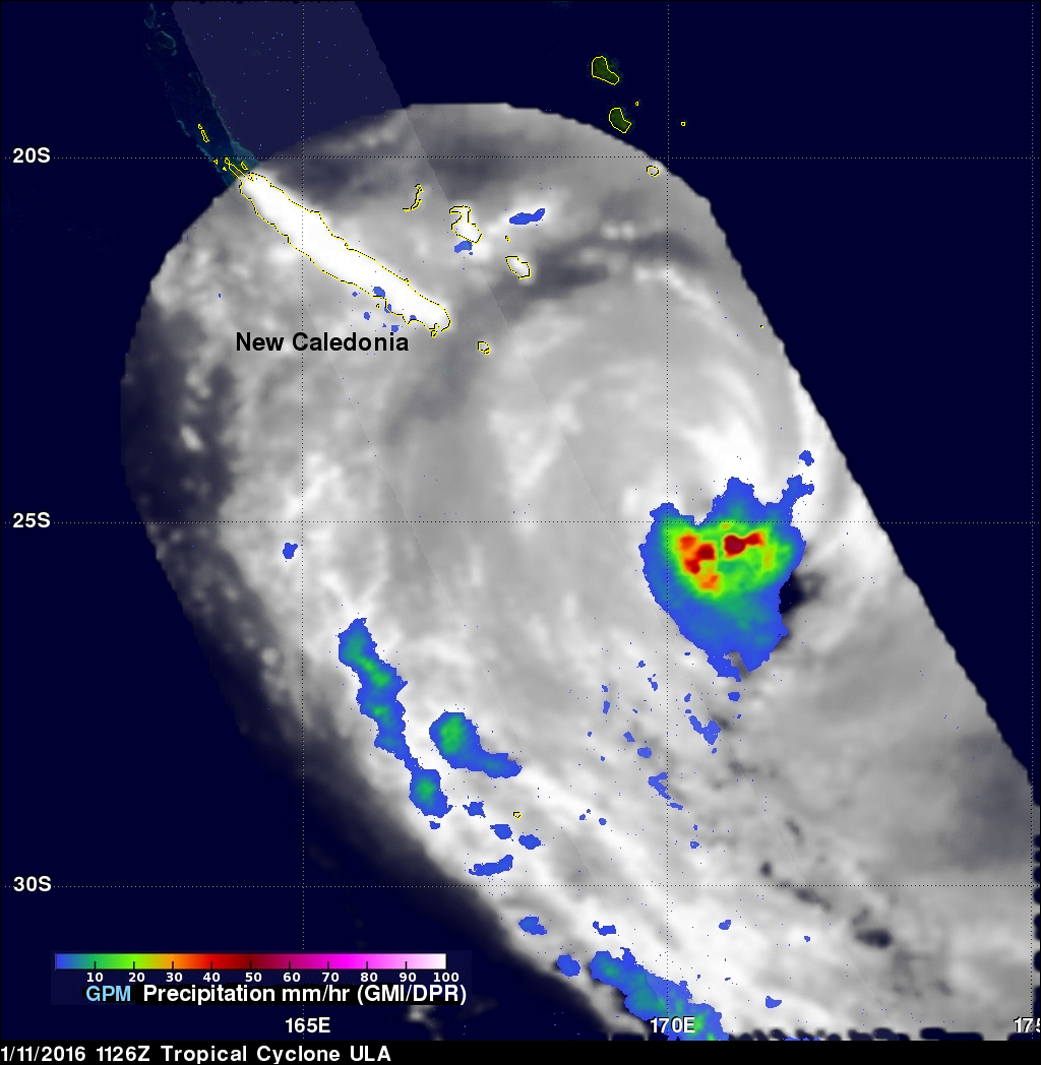
GPM also saw Ula on January 9 at 1136 UTC (6:36 a.m. EST) and on January 11 at 1126 UTC (6:26 a.m. EST). GPM’s Microwave Imager (GMI) revealed that heavy rain was falling around Ula’s eye on both dates.
On Jan. 11 at 1300 UTC (8 a.m. EST) NASA’s RapidScat instrument measured surface winds in Tropical Cyclone Ula and saw strongest sustained winds near 32 meters per second//71.5 mph/115.2 kph circled the storm’s center and extended south of the center.
Maximum sustained winds are not always equally distributed in a hurricane or tropical storm, and the RapidScat instrument helps forecasters find the strongest quadrants of a storm. RapidScat is an instrument that flies aboard the International Space Station.
By Jan. 12 at 0900 UTC (4 a.m. EST) Tropical Cyclone Ula’s maximum sustained winds dropped to 50 knots (57.5 mph/92.6 kph). It was centered near 28.3 degrees south latitude and 172.7 degrees east longitude, about 259 nautical miles (298 miles/479.7 km) northeast of Kingston Island. Ula was moving to the southeast at 13 knots (14.9 mph/24.0 kph).
The Joint Typhoon Warning Center (JTWC) predicts that Ula will continue weakening as it becomes extra-tropical and passes over the open waters of the South Pacific Ocean well to the north New Zealand.
Hal Pierce/Rob Gutro
NASA’s Goddard Space Flight Center
Jan. 11, 2016 – NASA Sees Tropical Cyclone Ula’s Eye Closing
NASA satellite imagery showed that Tropical Cyclone Ula’s eye appeared to be “closing” as clouds began filling it. Meanwhile New Caledonia remained on alert as the powerful storm continued moving away.
On Jan. 10 at 0900 UTC (4 a.m. EST) Tropical Cyclone Ula was a Category 4 Hurricane. Ula’s maximum sustained winds at that time were near 115 knots (132.3 mph/213 kph). Since then, the storm has weakened.
Despite Ula weakening Mare and Ile des Pins, New Caledonia remained under a Yellow Alert for high ocean swells on Jan. 11.
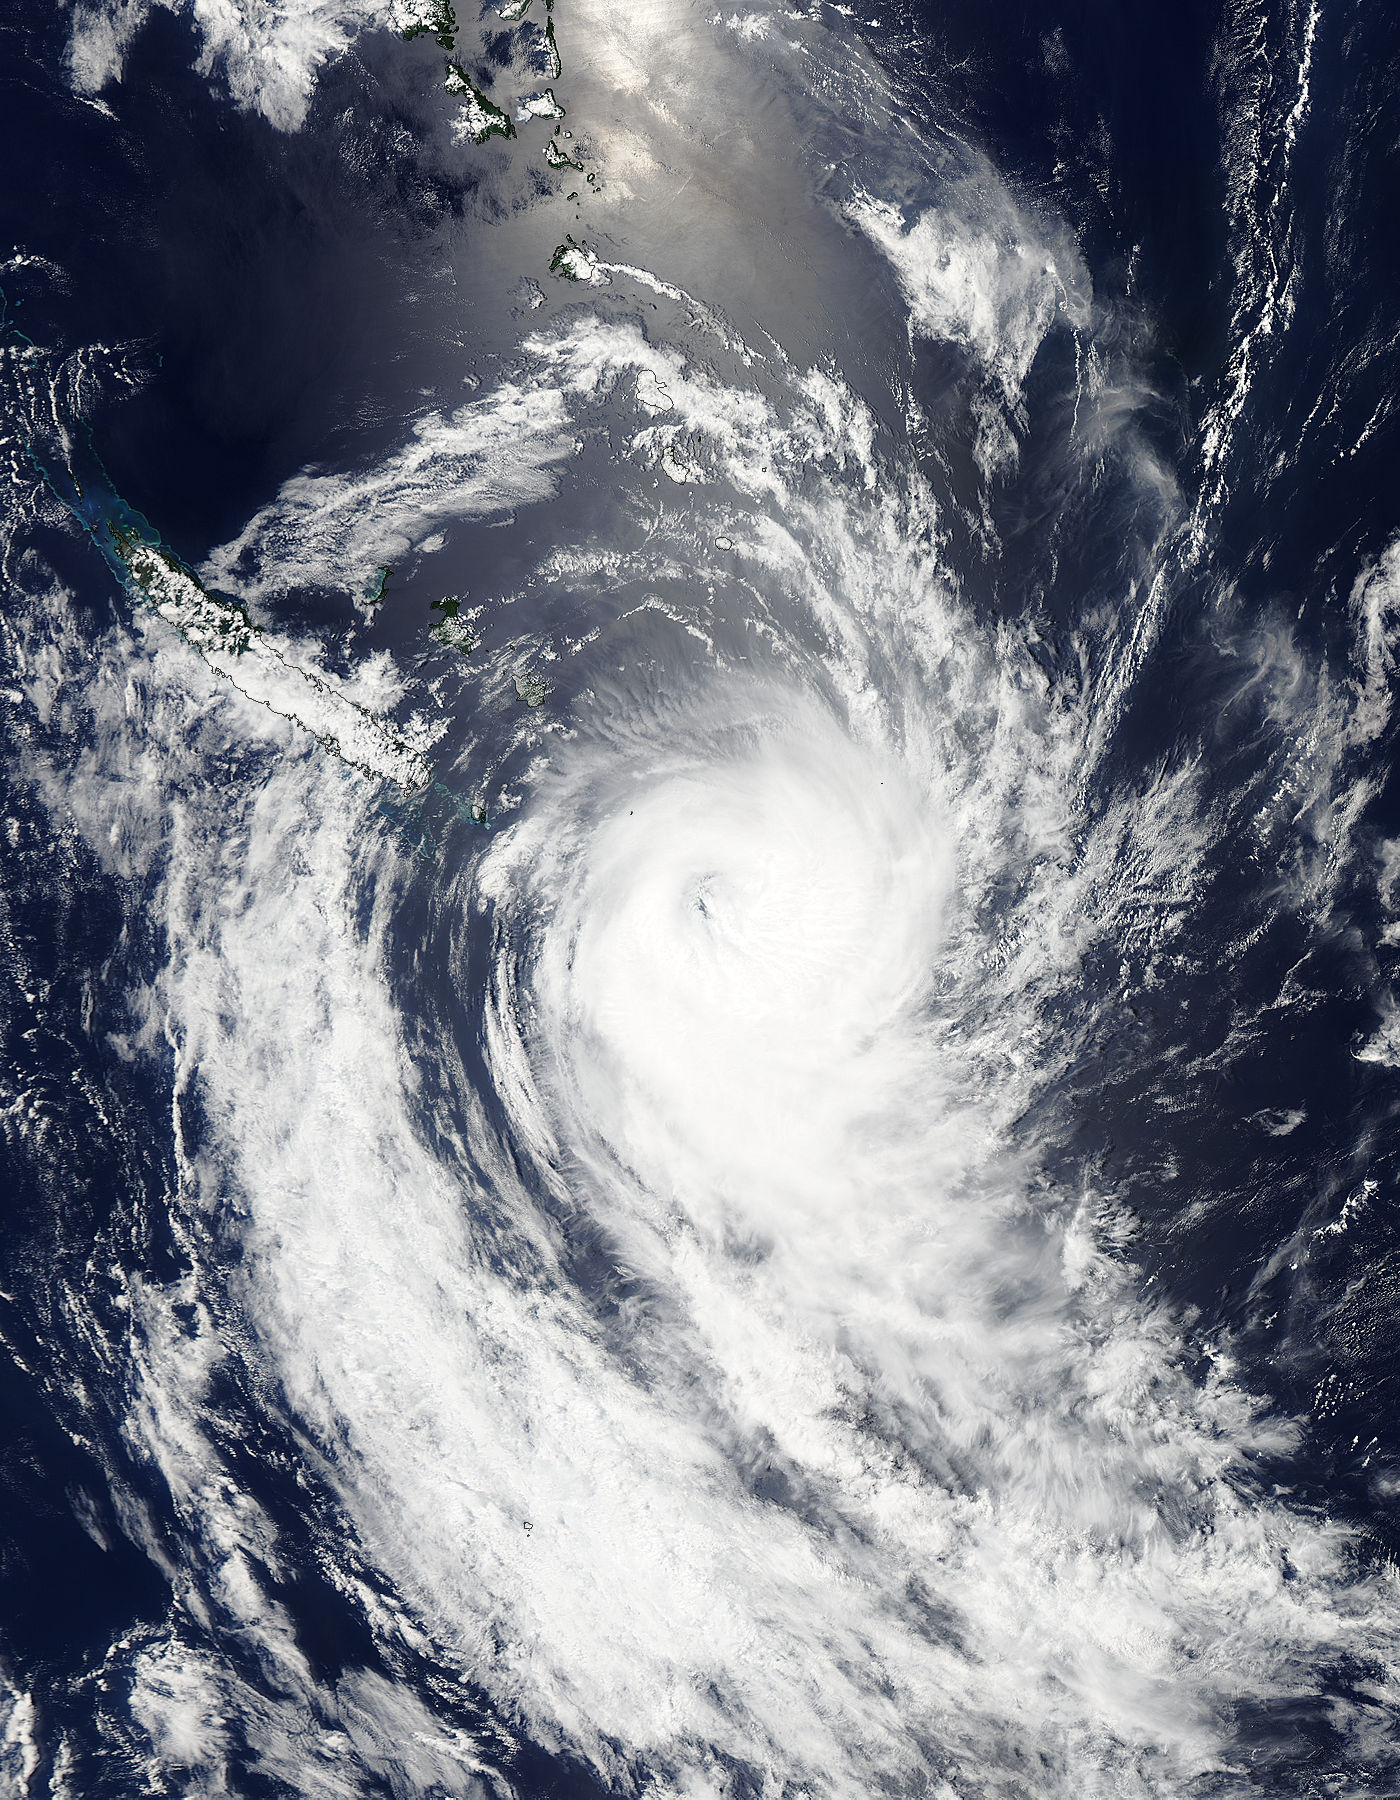
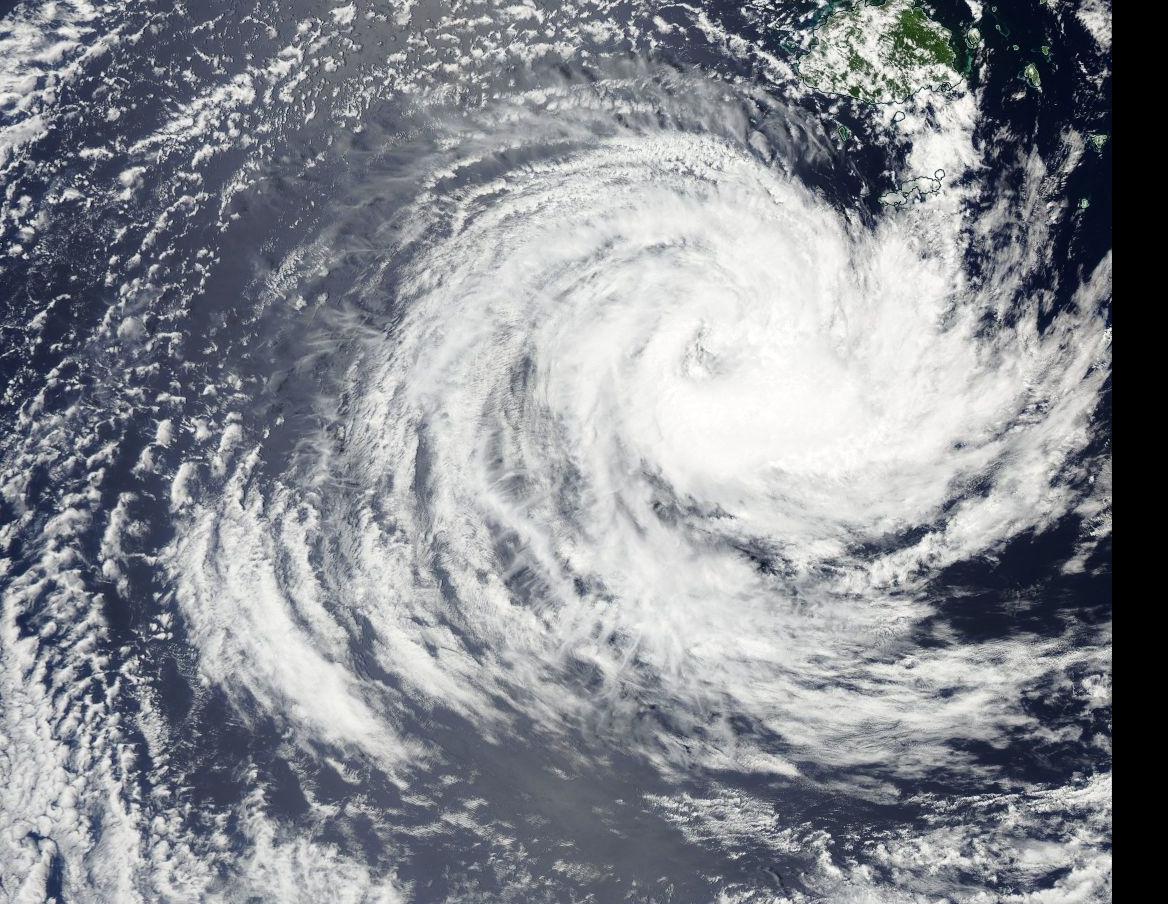
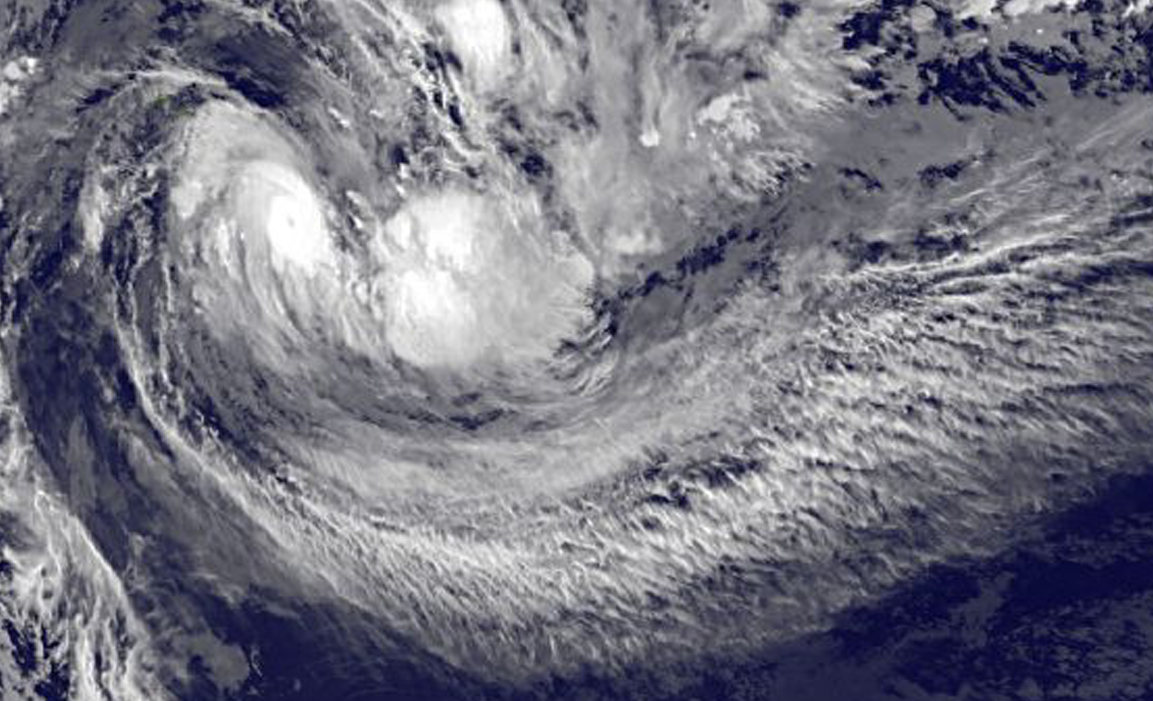
When NASA’s Aqua satellite passed over Tropical Cyclone Ula on Jan. 11 at 0215 UTC (Jan. 10 at 9:15 p.m. EST), the Moderate Resolution Imaging Spectroradiometer instrument known as MODIS took an image of the storm that revealed the eye had begun to fill with clouds. A band of powerful thunderstorms circled the eye but were more concentrated in the southern quadrant.
By 0900 UTC (4 a.m. EST) on Jan. 11, the Joint Typhoon Warning Center said that animated visible satellite imagery showed a deteriorating convective structure and the eye had become cloud-covered. A microwave satellite image showed the eye feature is weakening on the northern side, with all deep convection displaced to the southern side of the center.
Ula’s maximum sustained winds were near 90 knots (103.6 mph/166.7 kph) and weakening. It is currently a Category 2 hurricane on the Saffir-Simpson Scale. It was centered near 24.6 degrees south latitude and 170.4 degrees east longitude. Ula was about 249 nautical miles southeast of Noumea, New Caledonia and moving to the south at 11 knots (12.6 mph/20.3 kph). By 2200 UTC (5 p.m. EST) Ula is forecast to make its closest approach to Kingston Island, where its center will be 254 nautical miles (292.3 miles/470.4 km) away.
Ula is moving into a very unfavorable environment with moderate to high vertical wind shear and cooler sea surface temperatures which will further weaken the storm. Ula is forecast to move north of New Zealand by January 12 when it is expected to be at tropical-storm strength.
Rob Gutro
NASA’s Goddard Space Flight Center
Jan. 08, 2016 – NASA Sees Stubborn Tropical Cyclone Ula Kick Up
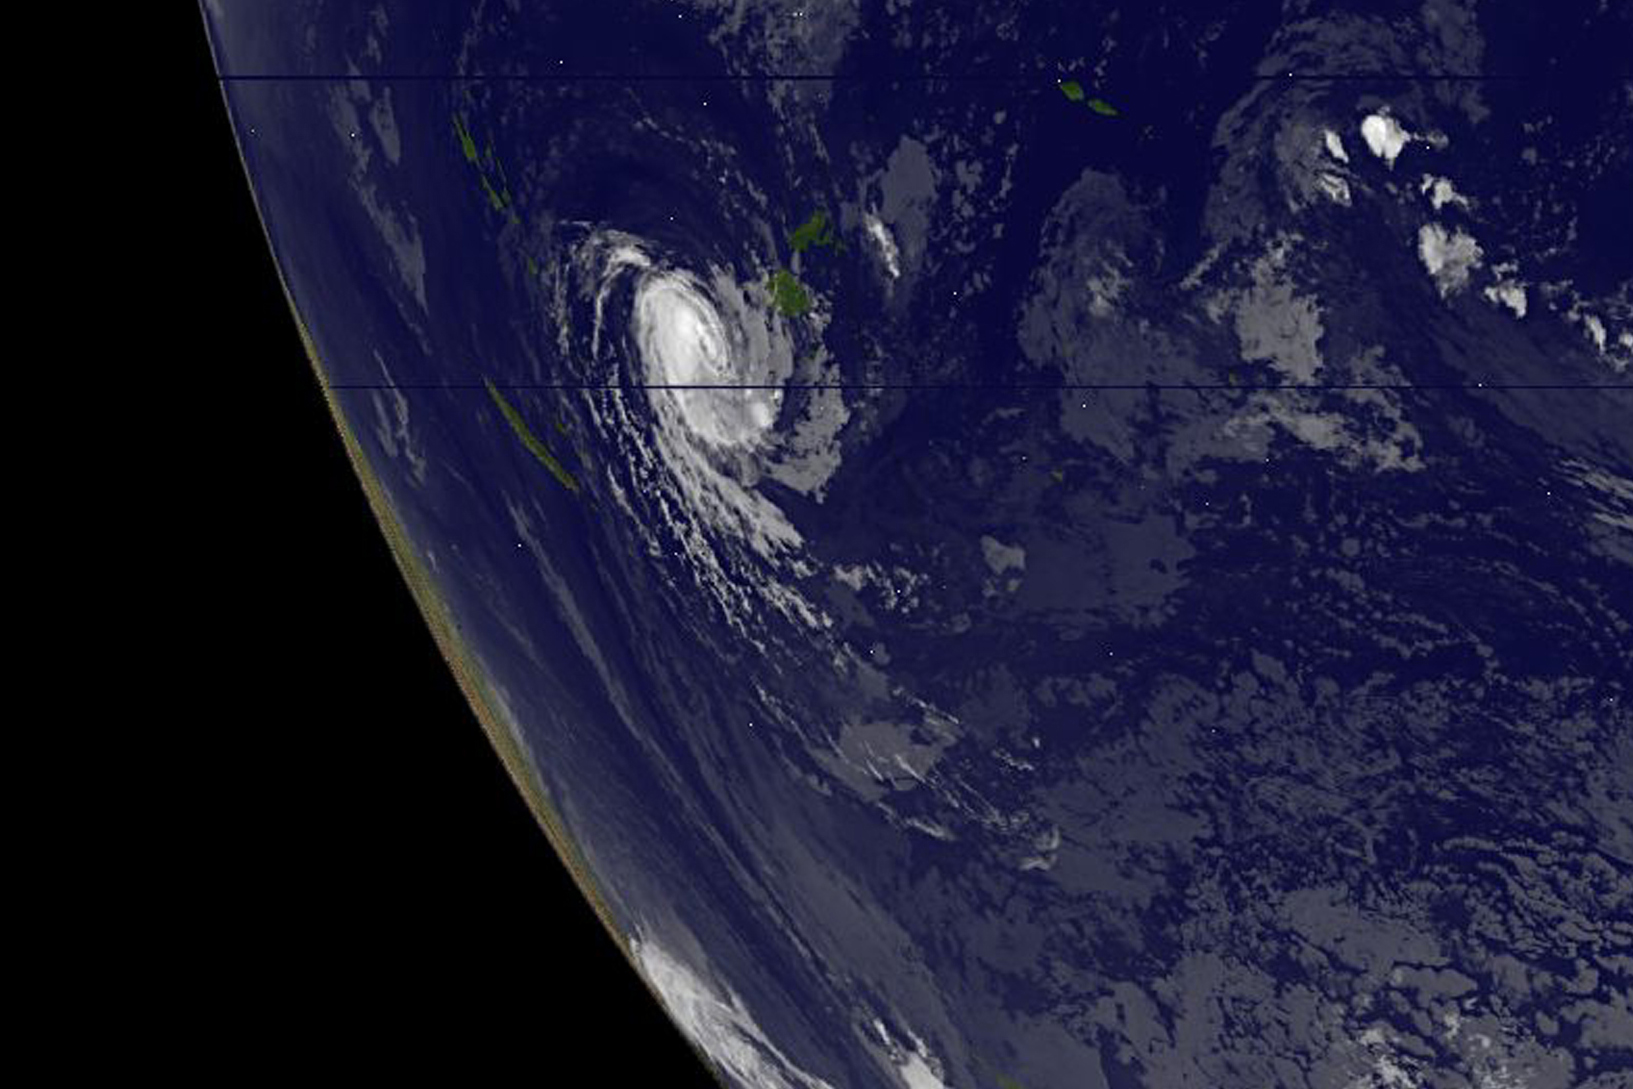
Tropical Storm Ula strengthened over the night-time hours of Jan. 6 to 7 and NOAA’s GOES-West satellite and NASA’s RapidScat instrument provided a look at the stubborn storm that is expected to continue to intensify and curve south.

Tropical Storm Ula strengthened over the night-time hours of Jan. 6 to 7 and NOAA’s GOES-West satellite and NASA’s RapidScat instrument provided a look at the stubborn storm that is expected to continue to intensify and curve south.
On Jan. 7 at 1400 UTC (9 a.m. EST) NASA’s RapidScat instrument saw Tropical Storm Ula’s strongest winds around the storm’s center at 27 meters per second (60.4 mph/97.2 kph). By 2100 UTC (4 p.m. EST) on Jan. 7, sustained winds had increased from 35 to 55 knots (40 to 63.2 mph/62 to 101.9 kph) around the system and it maintained that strength on Jan. 8 at 0900 UTC (4 a.m. EST).
Ula was 240 nautical miles (276.2 miles/444.5 km) west of Suva, Fiji, near 18.4 degrees south latitude and 174.2 east longitude. That puts Tropical cyclone Ula about 366.6 miles (590 kilometers) east-northeast of Tafea province of Vanuatu. Tafea is the southernmost of the six provinces of Vanuatu. Ula was crawling to the west-northwest at 2 knots (2.3 mph/3.7 kph).
The Joint Typhoon Warning Center (JTWC) expects the system will peak at 65 knots on Jan. 9 and begin weakening by Jan. 11.
Forecasters at JTWC expect Ula to curve to the south, staying east of Noumea, New Caledonia on Jan. 10 and 11 and head toward northern New Zealand. Over the next several days, Ula is also expected to transition to an extra-tropical cyclone. For updated forecasts, visit the JTWC page: http://www.usno.navy.mil/JTWC/ . For forecasts from the Vanuatu Meteorological Services, visit: http://www.meteo.gov.vu/.
Rob Gutro
NASA’s Goddard Space Flight Center
Jan. 07, 2016 – NASA Analyzes Tropical Storm Ula’s Winds
Tropical Storm Ula continued to weaken as it pulled farther away from Fiji in the Southern Pacific Ocean. NASA’s RapidScat instrument found that the strongest winds in the storm were south of the center. NOAA’s GOES-West satellite captured an infrared image of the storm that showed stronger thunderstorms had recently developed around its center.
On Jan. 7, NASA’s RapidScat instrument measured surface winds in Tropical Storm Ula and saw the strongest sustained winds near 29 meters per second//64.4 mph/104.4 kph south of the center. Maximum sustained winds are not always equally distributed in a hurricane or tropical storm, winds in the other quadrants were not as strong. RapidScat instrument helps forecasters find the strongest quadrants of a storm. RapidScat is an instrument that flies aboard the International Space Station.
NOAA’s GOES-West satellite captured an infrared image of Tropical Storm Ula at 1200 UTC (7 a.m. EST) on Jan. 7, 2016. The infrared image showed that stronger thunderstorms redeveloped in the center of circulation as wind shear relaxed and the storm moved over warmer sea surface temperatures.
At 0900 UTC (4 a.m. EST) on Jan. 6, Ula’s maximum sustained winds had dropped to 45 knots (51 mph/83 kph). Ula continues to track to the northwest at 4 knots (4.6 mph/7.4 kph) and into increasing vertical wind shear, which is expected to keep weakening the storm. Ula was centered near 19.0 degrees south latitude and 175.0 degrees east longitude, about 201 nautical miles (231.3 miles/372.3 km) west-southwest of Suva, Fiji.
The Joint Typhoon Warning Center forecast calls for Ula move toward the northwest and re-strengthen for a day or two before the storm turns to the southwest where it will run into increasing vertical wind shear and move back over cooler waters. Both of those factors are expected to weaken the storm and lead to dissipation by January 10.
Rob Gutro
NASA’s Goddard Space Flight Center
Jan. 06, 2016 – NASA Sees Tropical Cyclone Ula Weakening
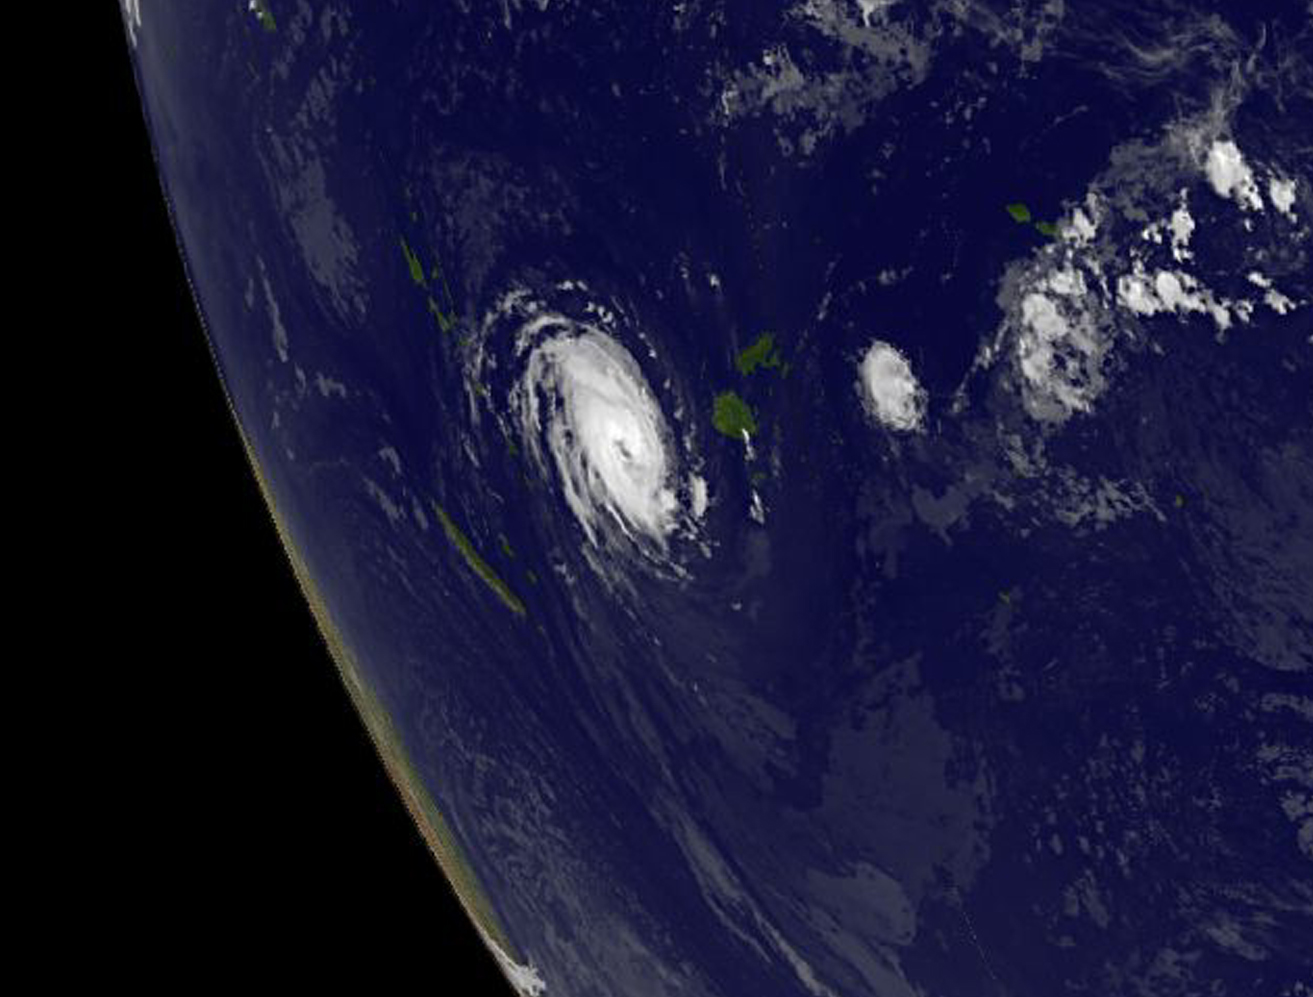
Tropical Cyclone Ula continued to move west, passing south of Fiji when NASA’s Aqua satellite passed overhead and captured an image of the weakening storm.
The Moderate Resolution Imaging Spectroradiometer or MODIS instrument that flies aboard NASA’s Aqua satellite captured a visible image of Tropical Cyclone Ula on Jan. 5, 2015 as it continued to move west, past Fiji in the South Pacific Ocean. The image showed bands of thunderstorms wrapping into the low-level center from the northeast and around the southern quadrant of the storm.
Infrared satellite imagery on Jan. 6 revealed that the thunderstorm development has “shrunk and become more shallow,” according to the Joint Typhoon Warning Center. In the low levels of the atmosphere, dry air from the southwest of the storm is wrapping into the core and sapping evaporation and thunderstorm development.
At 0900 UTC (4 a.m. EST) on Jan. 6, Tropical Cyclone Ula’s maximum sustained winds had dropped to 35 knots (40 mph/62 kph) making it a minimal tropical storm. Ula was centered near 20.3 degrees south latitude and 176.3 east longitude, about 178 nautical miles (204 miles/329.7 km) south-southwest of Suva, Fiji. It was moving to the northwest at 5 knots (5.7 mph/9.2 kph).
The Joint Typhoon Warning Center forecast calls for Ula to move northwest and continue to weaken. The system is expected to dissipate soon, but could regenerate.
Rob Gutro
NASA’s Goddard Space Flight Center
Jan. 05, 2016 – Tropical Storm Ula Weakens, Moves South
Former hurricane Ula has weakened to a tropical storm in the Southern Pacific Ocean. NOAA’s GOES-West satellite captured an infrared image of the storm on Jan. 5 that showed it moved further south of Fiji.
NOAA’s GOES-West satellite captured an infrared image of Tropical Storm Ula at 1500 UTC (10 a.m. EST) is it continued moving west in the South Pacific Ocean, while remaining a couple hundred miles south of Fiji. The infrared image showed stronger thunderstorms on the western side of circulation.
At 0900 UTC (4 a.m. EST) on Jan. 5, Ula’s maximum sustained winds had dropped to 55 knots (63.2 mph/101.9 kph). Ula continues to track to the west at 3 knots (3.4 mph/5.5 kph) and into increasing vertical wind shear, which is expected to keep weakening the storm. Ula was centered near 21.8 degrees south latitude and 177.6 degrees east longitude, about 227 nautical miles (261.2 miles/420.4 km) south of Suva, Fiji.
Ula is tracking west under the influence of a low to mid-level subtropical ridge (elongated area) of high pressure to the south of the system.
The Joint Typhoon Warning Center forecast calls for Ula to continue moving in a westerly direction and gradually weaken and dissipate within a couple of days.
Rob Gutro
NASA’s Goddard Space Flight Center
Jan. 04, 2016 – NASA-NOAA’s Suomi NPP Satellite Sees Ula Moving Away from Fiji
Tropical Cyclone Ula affected the Fiji group of islands over the weekend of January 2 and 3. Early on January 4, NASA-NOAA’s Suomi NPP satellite showed the storm moved south as all Fiji warnings were dropped.
The Visible Infrared Imaging Radiometer Suite (VIIRS) instrument aboard NASA-NOAA’s Suomi NPP satellite captured an image of Tropical Cyclone Ula moving away from Fiji on January 4, 2016. All warnings and watches for Fiji have been dropped. The visible-light image showed that the eye was no longer visible. Bands of thunderstorms continued to circle the center of the storm.
VIIRS collects visible and infrared imagery and global observations of land, atmosphere, cryosphere and oceans.
At 0900 UTC (4 a.m. EST) on Jan. 4, the Joint Typhoon Warning Center (JWTC) noted that animated enhanced infrared satellite imagery showed thunderstorm development had diminished over the northern quadrant of the storm as moderate vertical wind shear between 20 and 25 knots (23 to 28.7 mph/37 kph to 46.3 kph) was affecting the storm.
Tropical cyclone Ula was centered near 22.3 degrees south latitude and 179.2 degrees east longitude, about 256 nautical miles (294 miles/474 km) south of Suva, Fiji. Ula’s maximum sustained winds dropped to 70 knots (80.5 mph/129.6 kph), making it a category 1 hurricane on the Saffir-Simpson Wind Scale. Ula was moving to the southwest at 4 knots (4.6 mph/7.4 kph).
Although all tropical cyclone watches and warnings have been canceled for Fiji, a trough of low pressure remains slowing moving over Fiji generated a weather bulletin from the National Weather Forecasting Centre, Nadi, Fiji at 7:46 p.m. Fiji local time (1:46 a.m. EST) on January 4, 2016. The bulletin noted that a strong wind warning remains in force for land areas of Lau Group, Yasawa and Mamanuca Group, Northern and Southern Viti Levu, the Lomaiviti group, Kadavu, Vanua Levu, Taveuni and the nearby smaller islands. For updated forecasts, visit the Fiji Meteorological Service website: http://www.met.gov.fj/
Ula is expected to turn west and continue to gradually weaken as it runs into cooler waters, drier air, and increasing vertical wind shear. Ula is expected to dissipate within three days.
Rob Gutro
NASA’s Goddard Space Flight Center
Dec. 31, 2015 – NASA Sees Tropical Cyclone Ula’s Eye and Rainfall
Tropical Cyclone Ula formed on Dec. 30 and continued tracking south of Pago Pago as NASA observed rainfall rates and saw an eye form the next day. Warnings were in effect in Fiji as Ula approaches.
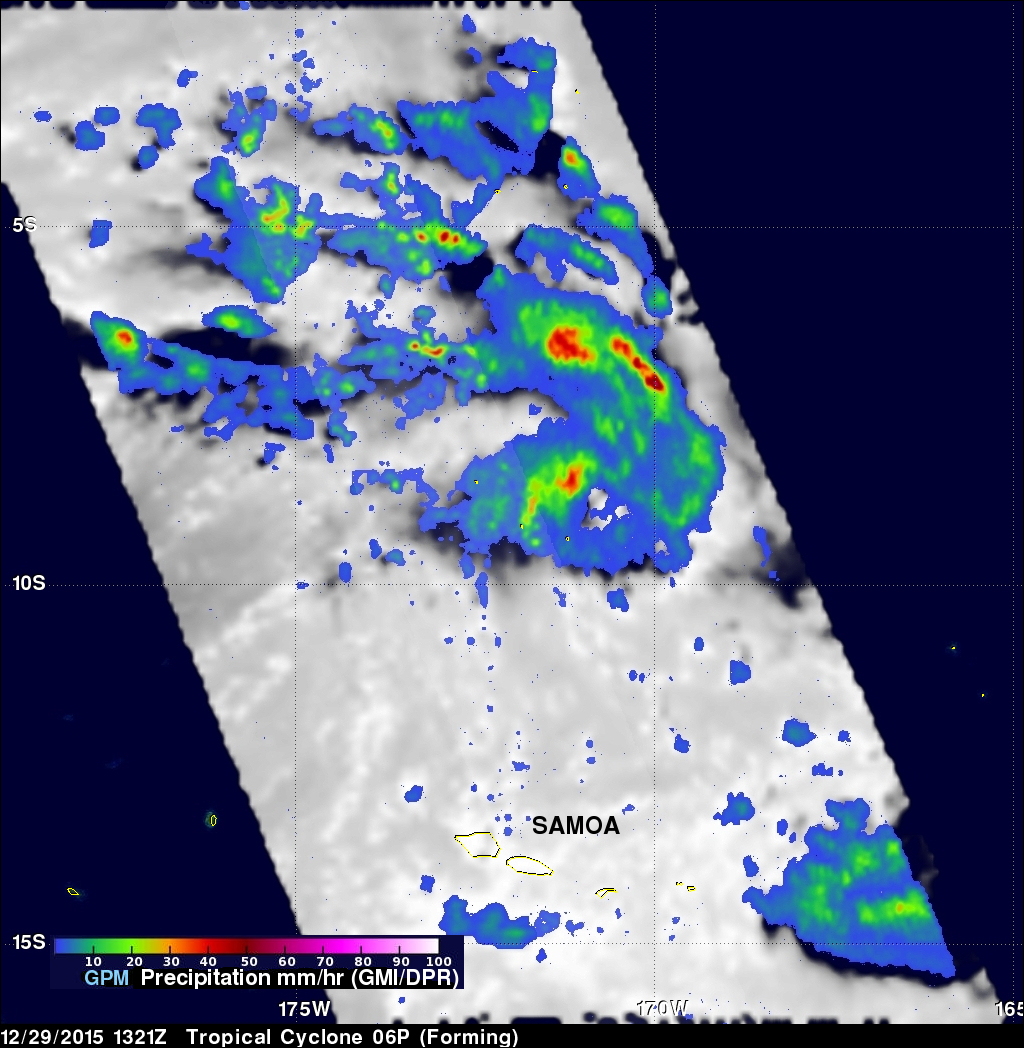
The Global Precipitation Measurement or GPM core observatory satellite passed above Tropical Cyclone Ula when it was forming in the South Pacific Ocean north of Samoa on December 29, 2015 at 1321 UTC (8:21 a.m. EST). A rainfall analysis was performed using data collected at that time by GPM’s Microwave Imager (GMI) and Dual-Frequency Precipitation Radar (DPR) instruments. Data from GMI were used to calculate that rain was falling at a rate of over 83.6 mm (3.29 inches) per in a feeder band (of thunderstorms) northeast of the low pressure area’s center.
At NASA’s Goddard Space Flight Center in Greenbelt, Maryland, data from GPM’s DPR Ku band radar were used to create a 3-D structure of precipitation within the forming tropical cyclone. Some storm top heights in the 3-D radar cross section showed storm top heights of over 15 km (9.3 miles).
Credits: NASA/JAXA/SSAI, Hal Pierce
At 0900 GMT (4 a.m. EST) on Dec. 31, Ula’s maximum sustained winds were near 55 knots (63.2 mph/101.9 kph) and strengthening. Ula is expected to peak at 80 knots (92 mph/148 kph) on January 2. Ula was centered near 15.5 south latitude and 169.0 west longitude, about 122 nautical miles southeast of Pago Pago, American Samoa. Ula was moving to the west-southwest at 6 knots (6.9 mph/11.1 kph). The storm is also generating high seas with wave heights to 22 feet (6.7 meters), so Pago Pago and Fiji can expect rough surf and dangerous coastal conditions.
Ula’s center is forecast to remain south of Fiji. However, Fiji will feel the effects of rough surf, strong winds, heavy rainfall and the potential for inland flooding. On Dec. 31, the Fiji Meteorological Service issued a heavy rain warning for eastern and northern Viti Levu, Vanua Levu, Taveuni And Nearby Smaller Islands, Yasawa And Mamanuca Group. For updated forecasts from Fiji, visit: www.met.gov.fj/.
NOAA’s GOES-West satellite captured an image on Dec. 31 at 1200 UTC (7 a.m. EST) that showed a small eye had formed in Tropical Cyclone Ula when it was just south of Pago Pago in the Southern Pacific Ocean. The image also showed a thick band of thunderstorms around the center of circulation. The image was created by the NASA/NOAA GOES Project at NASA Goddard.
The Joint Typhoon Warning Center noted that Ula is tracking westward along the northern edge of a strengthening sub-tropical ridge (elongated area of high pressure), located to the south. That ridge will remain the main steering mechanism for the storm over the next couple of days.
Ula is expected to continue intensifying over the next two days until it runs into an approaching mid-latitude trough (elongated area) of low pressure, which will increase vertical wind shear and begin weakening the storm.
Rob Gutro / Hal Pierce
NASA’s Goddard Space Flight Center
Dec. 30, 2015 – Satellite Captures Birth of South Pacific Tropical Cyclone Ula
As Tropical Cyclone Ula was coming together, NOAA’s GOES-West satellite captured an image of the consolidating storm in the Southern Pacific Ocean.
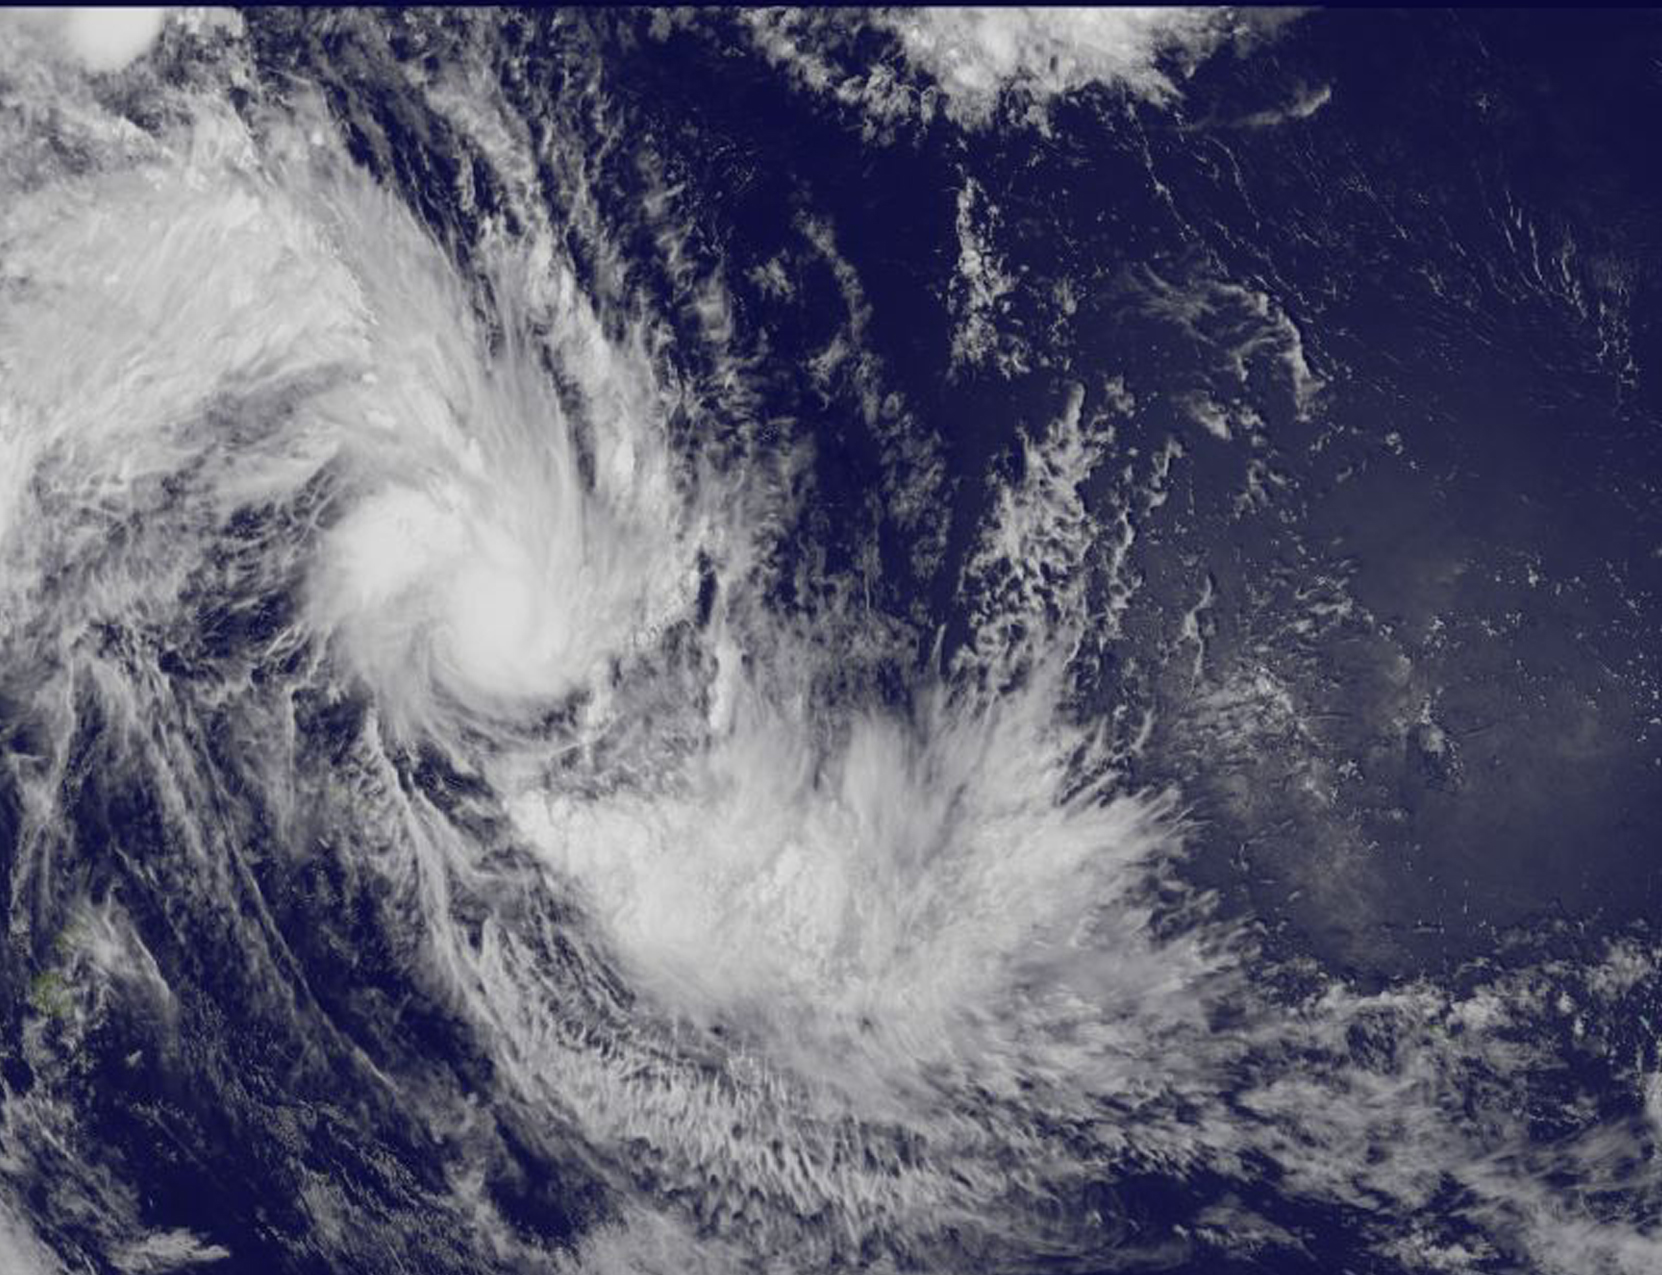
NOAA’s GOES-West satellite captured an image of the tropical low pressure areas designated as System 92P in the South Pacific Ocean on Dec. 29 at 2322 UTC (6:22 p.m. EST). The low pressure area continued to consolidate and organize and was designated Tropical Cyclone Ula on Dec. 30 at 0900 UTC (4 a.m. EST), east of American Samoa.
At that time, Ula’s maximum sustained winds were near 45 knots (53.7 mph/83.3 kph). It was located near 12.0 degrees south latitude and 166.5 west longitude, about 282 nautical miles (324.5 miles/522.3 km) east-northeast of Pago Pago, American Samoa. Ula was moving to the south-southeast at 13 knots (14.9 mph/24.0 kph).
Animated multispectral satellite imagery shows a rapidly-consolidating, compact low-level circulation center with tightly-curved convective banding of thunderstorms wrapping into a central dense overcast. Microwave satellite data shows an eye in that central dense overcast.
Forecasters at the Joint Typhoon Warning Center expect Ula to curve to the southwest, remaining south of Pago Pago while intensifying to hurricane-force on Dec. 31.
By January 2, Ula is expected to slow begin curving to the southwest as it approaches Fiji. Ula is expected to track along the western edge of a sub-tropical ridge (elongated area) of high pressure where it will encounter increasing vertical wind shear associated with a shortwave trough (elongated area of low pressure). For updated forecasts, visit the Joint Typhoon Warning Center website: http://www.usno.navy.mil/JTWC/ and Fiji’s Meteorological Service: http://www.met.gov.fj/.