


![Request for Information – Potential [Placeholder for Prize]](https://assets.science.nasa.gov/dynamicimage/assets/science/missions/a-step/FFR_Earth_Background_20251120%20.png?w=1024)


As people across the Midwestern U.S. take stock of the devastation from a Dec. 10 trail of tornados that blew across the region, data and images from NASA Earth-observing satellites aid first responders and recovery agencies in assessing the damage and help researchers understand the nature of these unusually powerful storms.
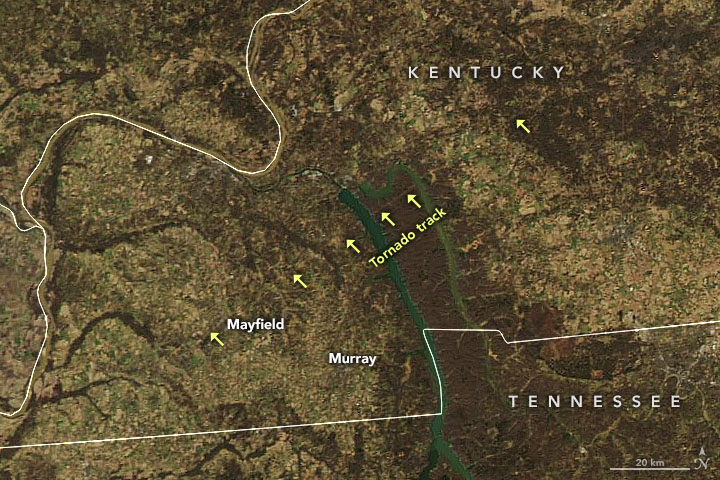
The natural-color image above that shows the tornado track across western Kentucky, which suffered some of the worst damage. The image was captured Dec. 12 by the Moderate Resolution Imaging Spectroradiometer on NASA’s Aqua satellite. Researchers also are using satellite data to study the supercell thunderstorms that spawned these tornados.
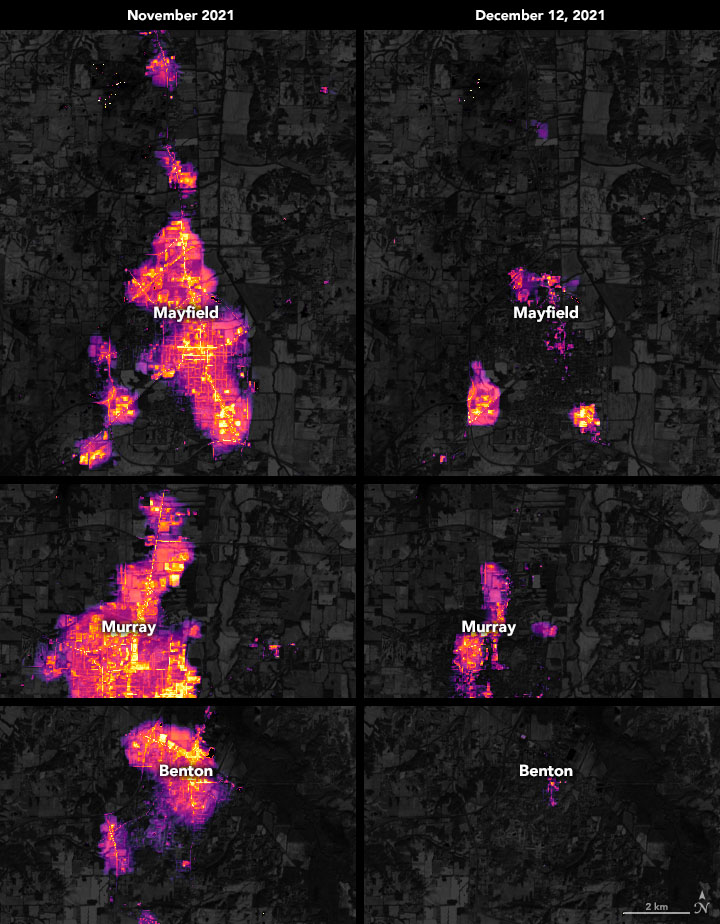
The scale of power outages in the region is also evident from images as seen here, comparing lights seen from space before and after the storm.
Scientists from the Universities Space Research Association (USRA) and NASA’s Goddard Space Flight Center (GSFC) in Greenbelt, Maryland, processed night lights data from the Visible Infrared Imaging Radiometer Suite (VIIRS) on the NASA-National Oceanic and Atmospheric Administration (NOAA) Suomi-NPP satellite. Those data were overlaid on base maps derived the NASA-U.S. Geological Survey Landsat 8 satellite.
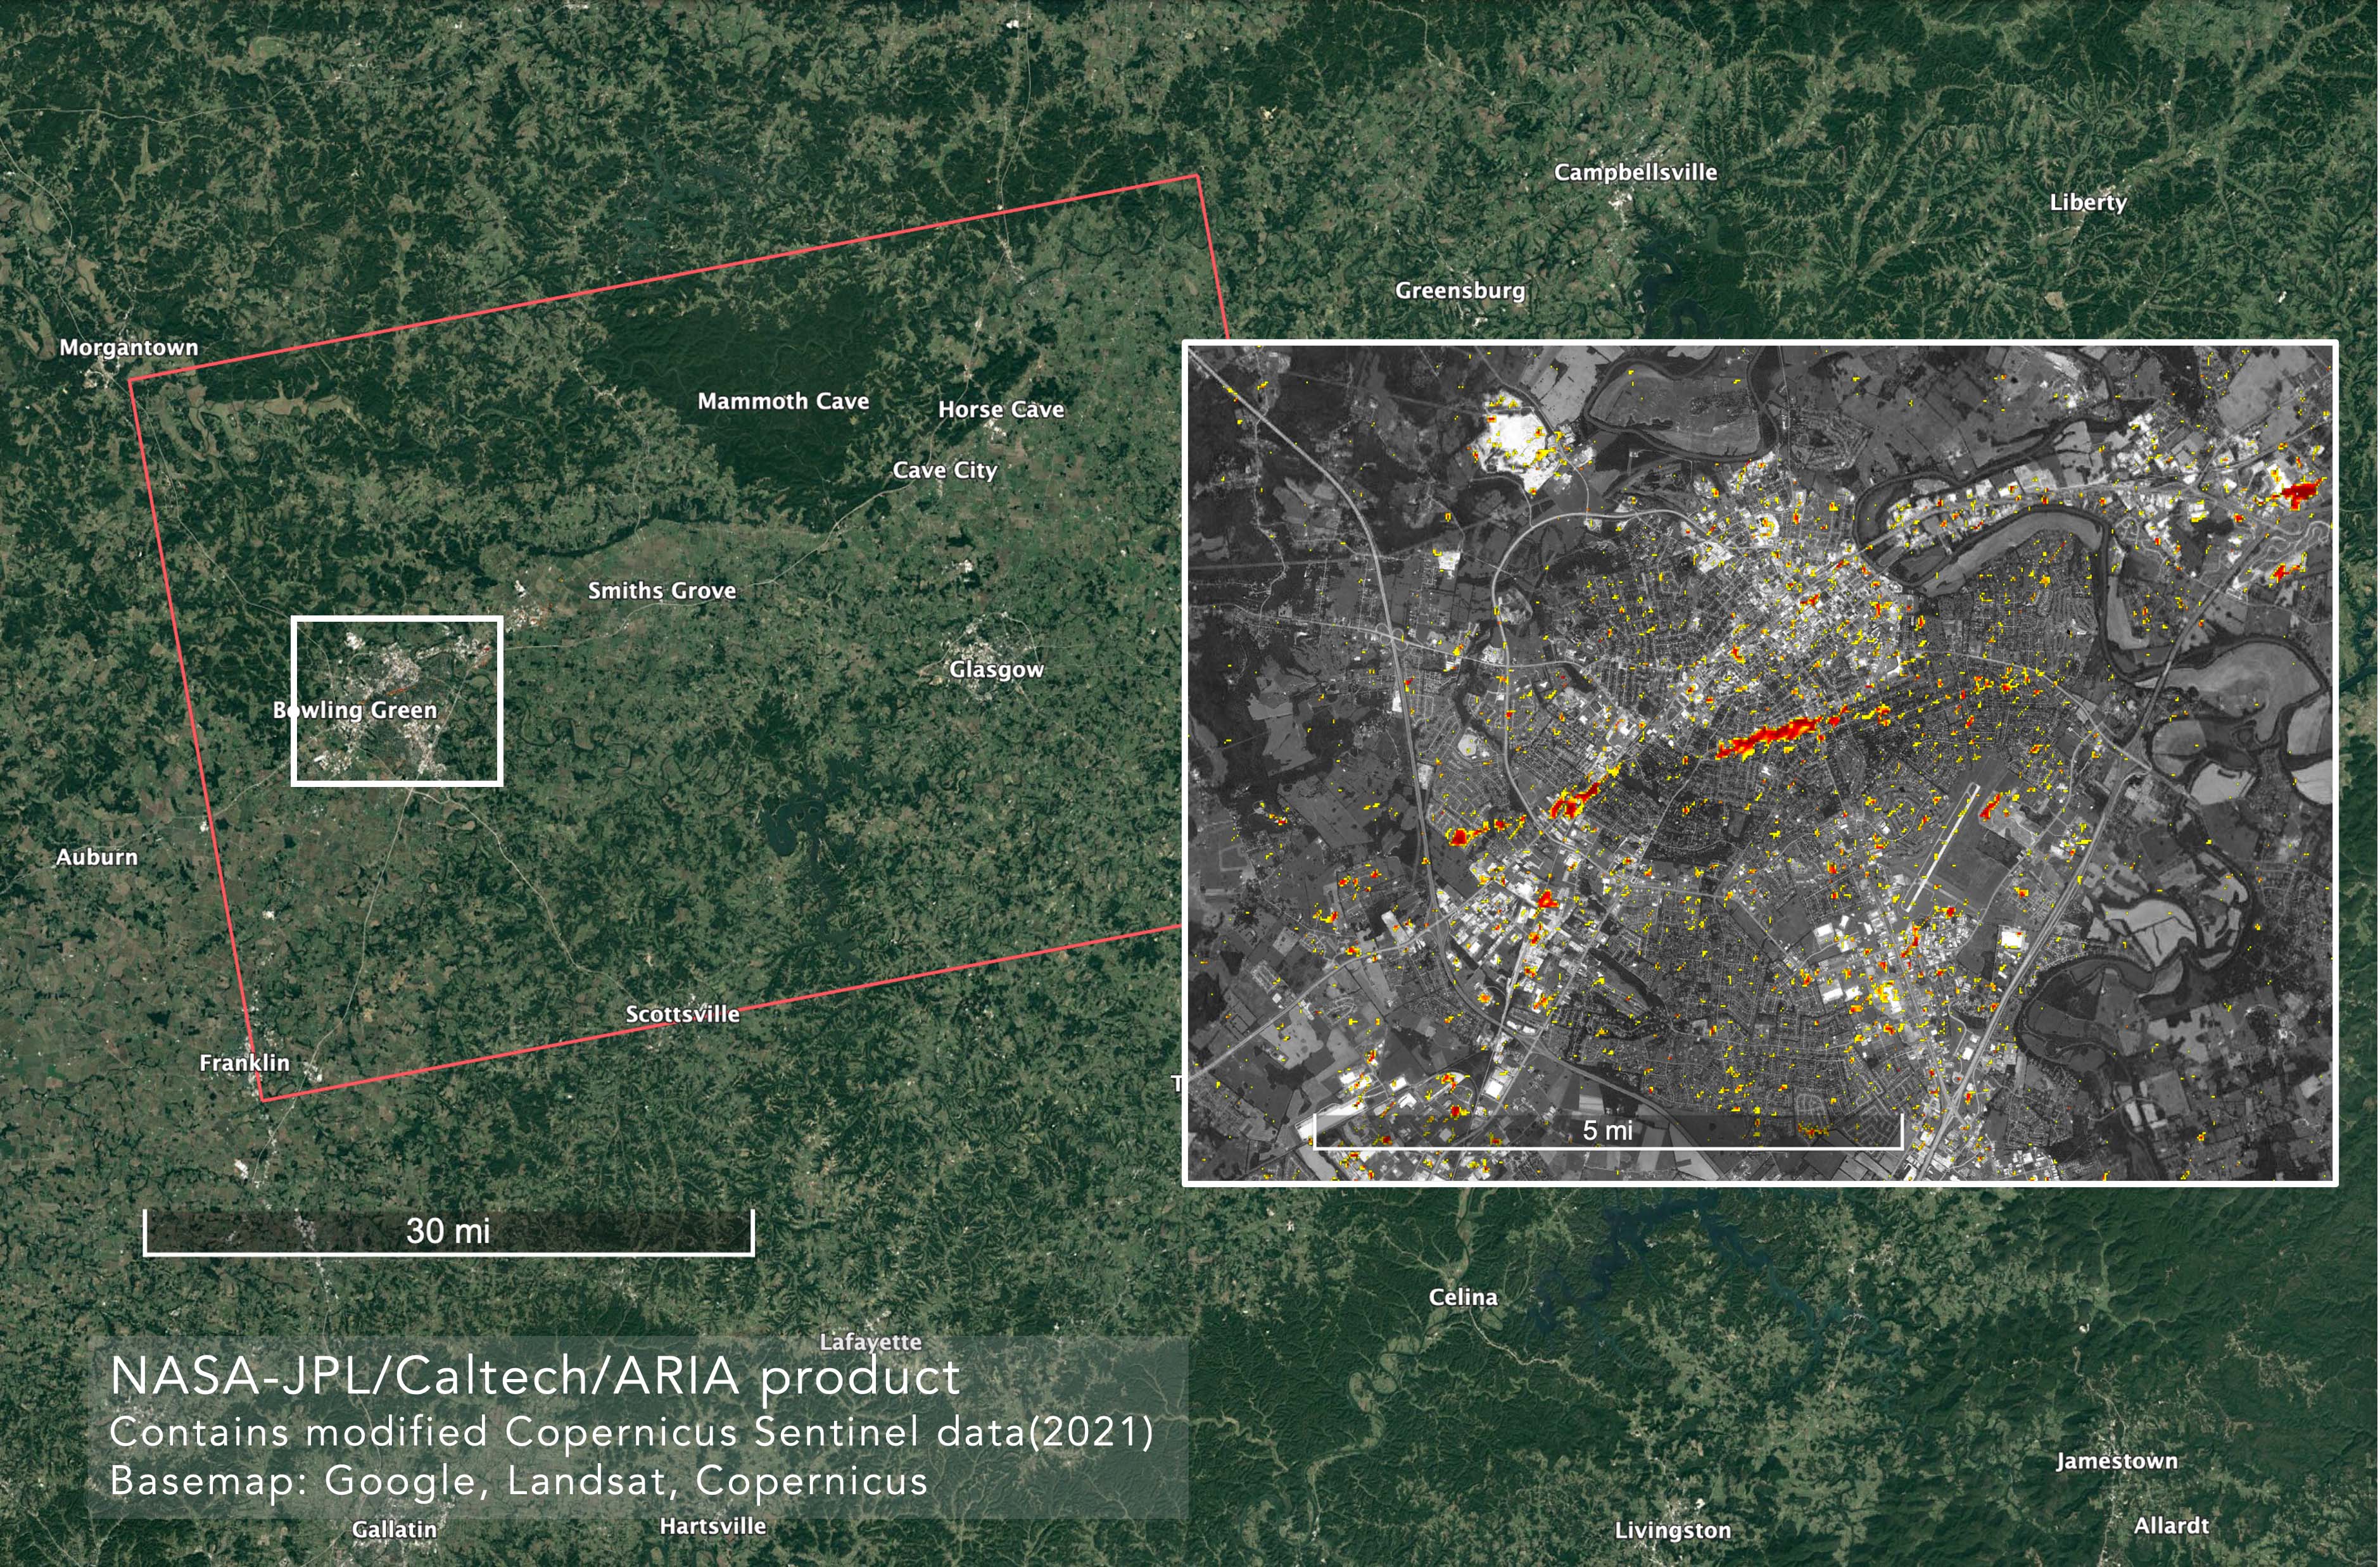
NASA researchers also are using satellite data to map damage in the affected areas. The Advanced Rapid Imaging and Analysis team at NASA’s Jet Propulsion Laboratory (JPL) in Southern California, has created damage proxy maps, such as the one above of Bowling Green, Kentucky. The team processes and analyzes synthetic aperture radar data from ESA’s (European Space Agency) Copernicus-1 satellite and interprets the changes in the landscape to estimate the severity of damage — indicated from yellow to red.
These images and similar data are openly available to disaster response teams and the public on the NASA Disasters Mapping Portal and the ARIA Share website.
To learn more about NASA’s coverage of extreme weather, visit: https://earthobservatory.nasa.gov/images/event/149210/extreme-winter-weather-in-north-america-2021
To learn more about NASA’s Disasters program, visit: https://appliedsciences.nasa.gov/what-we-do/disasters
Media Contact: Tylar Greene, NASA Headquarters