


Satellite Sees Wind Shear Battering Tropical Depression Nora
An infrared satellite image of Tropical Depression Nora taken early on October 15 showed the storm was still holding together south of Hawaii, despite strong wind shear.
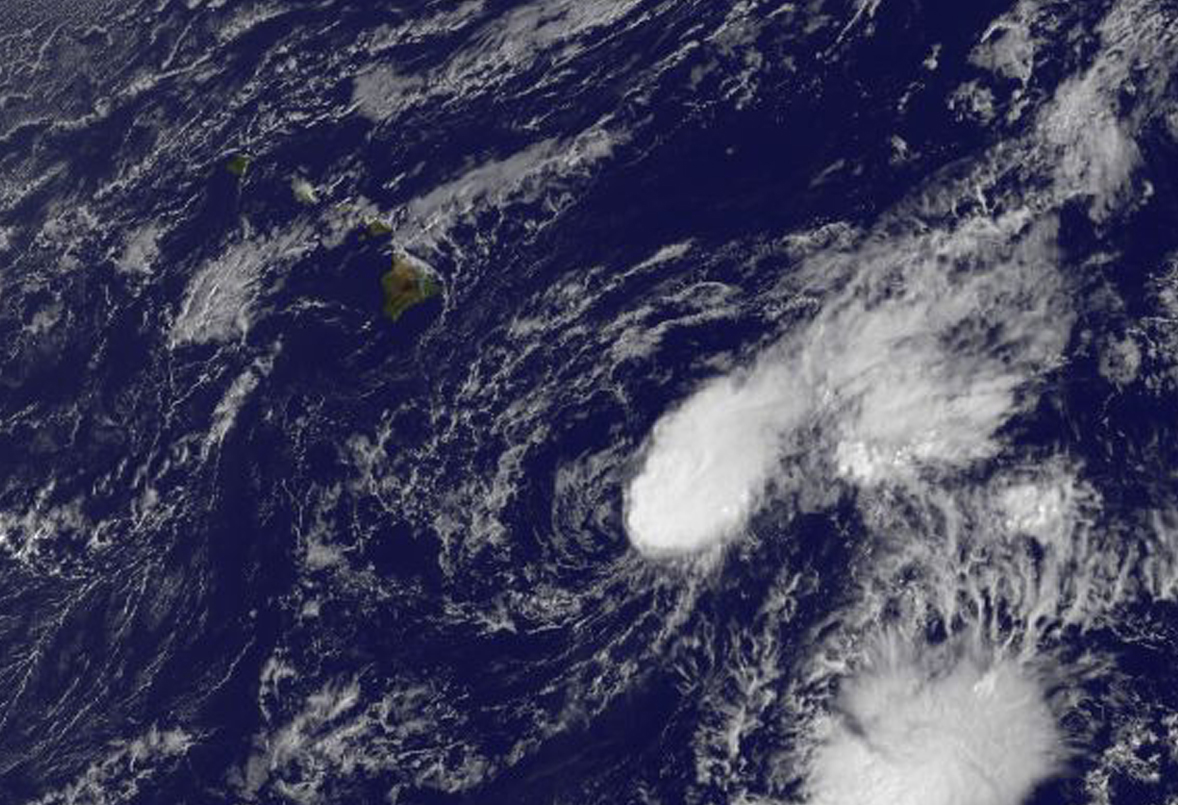
NOAA’s GOES-West satellite captured an infrared image of Tropical Depression Nora at 1800 UTC (10 a.m. EDT) that showed strong vertical wind shear from the southwest continued pushing the clouds and showers east of the center. The wind shear was blowing at a speed between 30 and 40 knots (34 to 46 mph /55 to 74 kph). The GOES image, created by the NASA-NOAA GOES Project at NASA’s Goddard Space Flight Center in Greenbelt, Maryland showed the thunderstorms were in a band east of the center of circulation.
At 5 a.m. EDT (0900 UTC) on October 15, 2015, Nora’s maximum sustained winds were near 30 mph (45 kph). It was centered near latitude 16.1 north and longitude 151.9 west. That’s about 325 miles (525 km) southeast of Hilo, Hawaii. The depression was moving toward the northwest near 7 mph (11 kph) and is expected to continue in that direction until later in the day when Nora is forecast to take a more westerly track.
NOAA’s Central Pacific Hurricane Center expects Nora to become a remnant low pressure area later in the day today, October 15, 2015.
Rob Gutro
NASA’s Goddard Space Flight Center
Oct. 14, 2015 – NASA-NOAA’s Suomi NPP Satellite Sees Strong Wind Shear Affecting Depression
NASA-NOAA’s Suomi NPP satellite passed over Tropical Depression Nora on October 14 and saw strong wind shear pushing the bulk of clouds and showers northeast of the center.
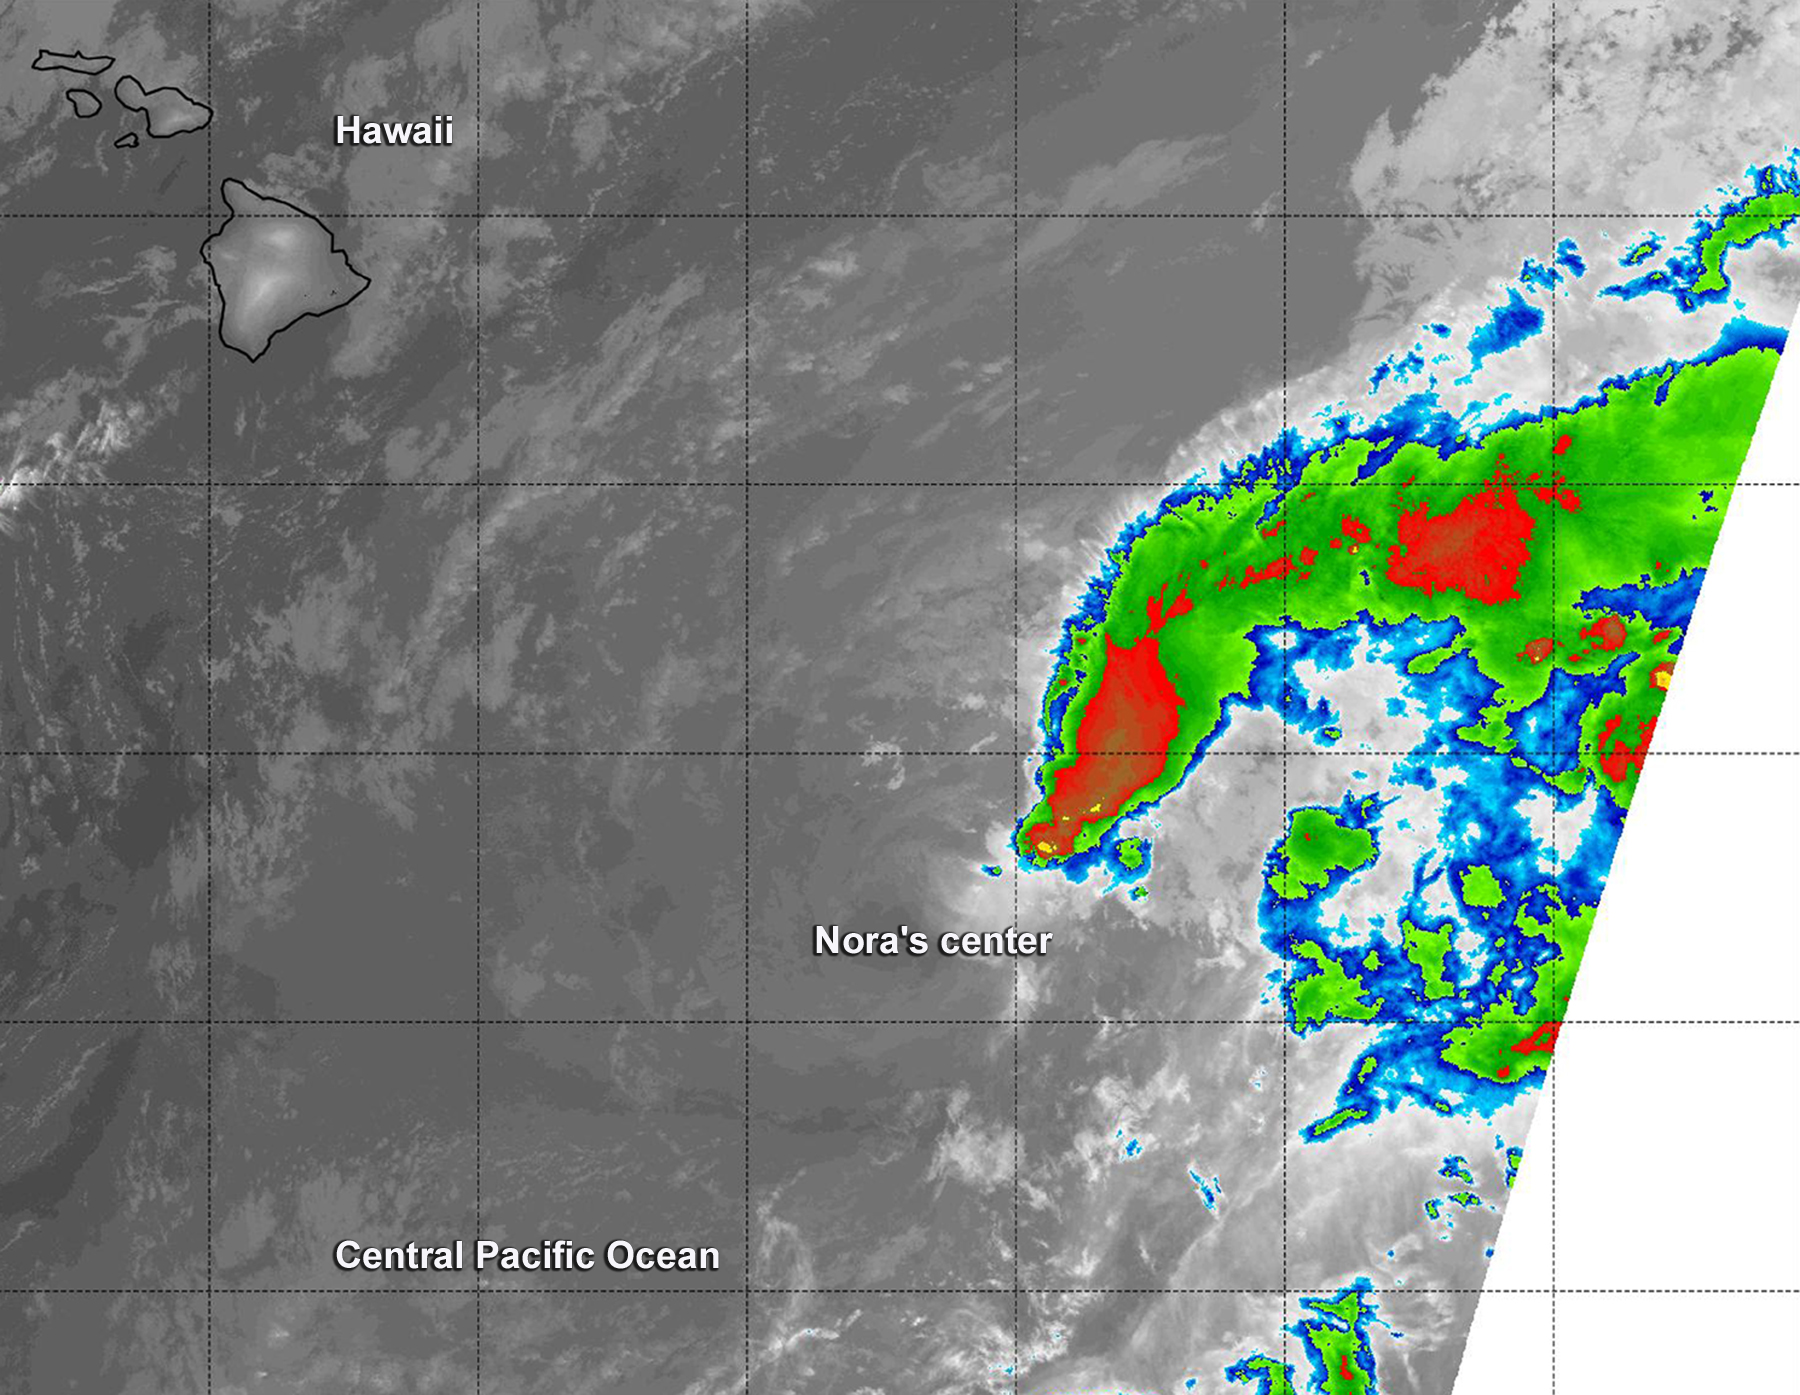
At 12:15 UTC (8:15 a.m. EDT) on Oct. 14 infrared data from the Visible Infrared Imaging Radiometer Suite or VIIRS instrument that flies aboard Suomi NPP revealed most of the depression’s thunderstorms were being pushed northeast of the center from strong southwesterly vertical wind shear.
The latest University of Wisconsin- Cooperative Institute for Meteorological Satellite Studies vertical wind shear analysis showed 44 knots (50.6 mph/ 81.4 kph) of wind shear from the southwest and ships guidance showed 34 knots (39.1 mph/62.9 kph) of shear from the same direction.
VIIRS is a scanning radiometer that collects visible and infrared imagery and “radiometric” measurements. Basically it means that VIIRS data is used to measure cloud and aerosol properties, ocean color, and ocean and land surface temperatures. The Suomi NPP satellite is co-managed by both NASA and NOAA.
On October 14, 2015 at 11 a.m. EDT (5 a.m. HST/1500 UTC) Nora was a tropical depression with maximum sustained winds near 35 mph (55 kph). It was centered near 14.9 North latitude and 151.1 West longitude, about 425 miles (680 km) southeast of Hilo, Hawaii. The depression was moving toward the west near 5 mph (7 kph) and is expected to turn northwest then west by October 15.
NOAA’s Central Pacific Hurricane Center (CPHC) said that swells generated by Nora will produce hazardous surf along the southeast facing shores of the big island of Hawaii through Thursday evening, October 15.
CPHC expects the depression to weaken to a post-tropical remnant low pressure area late on October 14.
Rob Gutro
NASA’s Goddard Space Flight Center
Oct. 13, 2015 – NASA-NOAA’s Suomi NPP Gets an Infrared Look at Tropical Storm Nora
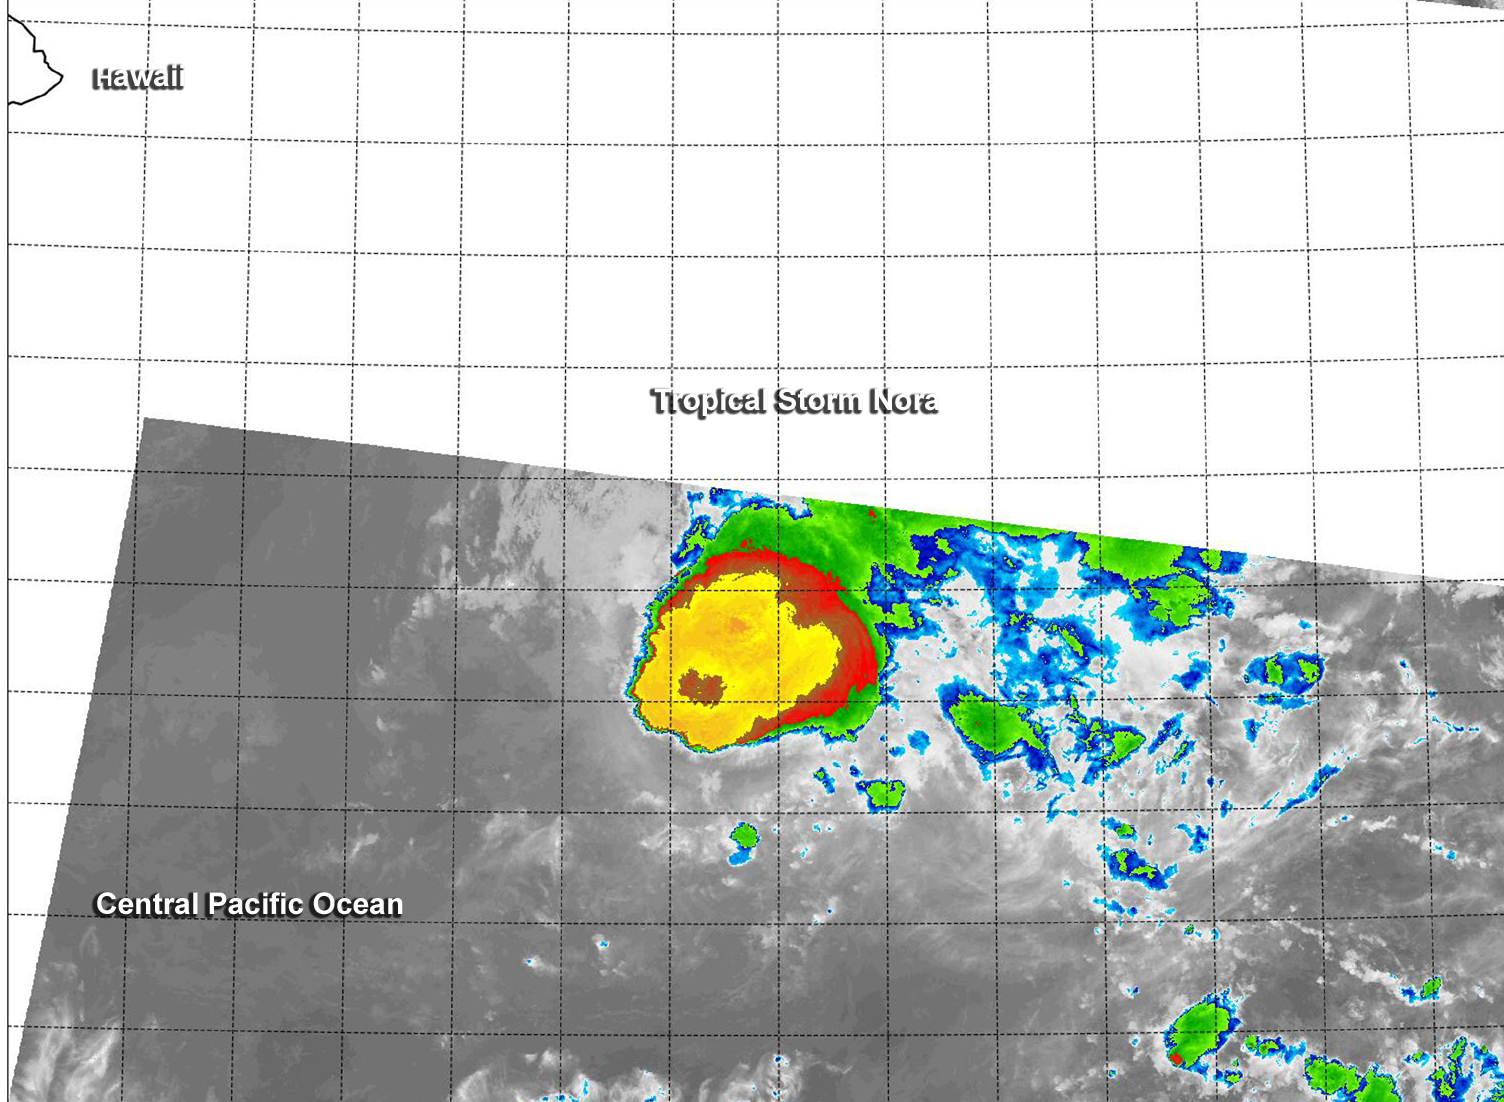
Tropical Storm Nora’s cloud top temperatures appeared to be warming up on infrared imagery from NASA-NOAA’s Suomi NPP satellite. Warming cloud top temperatures means less uplift in the air and a weaker storm. Nora is on a weakening trend according to NOAA’s Central Pacific Hurricane Center as wind shear continues to batter the storm.
Nora started out on October 9 as Tropical Depression 18E in the Eastern Pacific. At 5 p.m. EDT (2100 UTC) on October 10, Tropical Depression 18E strengthened into Tropical Storm Nora. At that time, Nora was located near latitude 11.8 North, longitude 138.5 West. On Oct. 11, Tropical Storm Nora crossed the 140 degree longitude line moving from the Eastern Pacific to the Central Pacific Ocean.
Infrared data from the Visible Infrared Imaging Radiometer Suite (VIIRS) instrument aboard NASA-NOAA’s Suomi NPP satellite saw Tropical Storm Nora on October 13 at 10:53 UTC (6:53 a.m. EDT).The VIIRS image showed thunderstorms wrapped around the low-level center of circulation and pushed to the east-northeast as a result of strong west-southwesterly wind shear. According to NOAA’s Central Pacific Hurricane Center, the latest University of Wisconsin- Cooperative Institute for Meteorological Satellite Studies and ships wind shear analysis both show around 30 knots (34.5 mph/55.5 kph) of shear from the west-southwest.
At 5 a.m. HST/11 a.m. EDT/1500 UTC on Tuesday, October 13, 2015 the center of Tropical Storm Nora was located near latitude 14.2 north and longitude 148.6 west. That’s about 575 miles (920 km) southeast of Hilo, Hawaii. Nora was moving toward the northwest near 7 mph (11 kph) and is expected to continue in that direction for the next couple days. Maximum sustained winds were near 45 mph (75 kph) and slow weakening is expected over the next couple of days.
NOAA’s Central Pacific Hurricane Center expects Nora to become a tropical depression by sometime on Wednesday, October 15.
Rob Gutro
NASA’s Goddard Space Flight Center
Oct. 09, 2015 – Satellite Spots New Depression Exactly Between Baja California and Hawaii
It’s a rare thing when a tropical depression develops the same exact distance between two landforms, and newborn Tropical Depression 18E has done that in the Eastern Pacific Ocean. In a visible image created at NASA using NOAA’s GOES-West satellite, the depression sits directly between Hawaii and Baja California, Mexico.
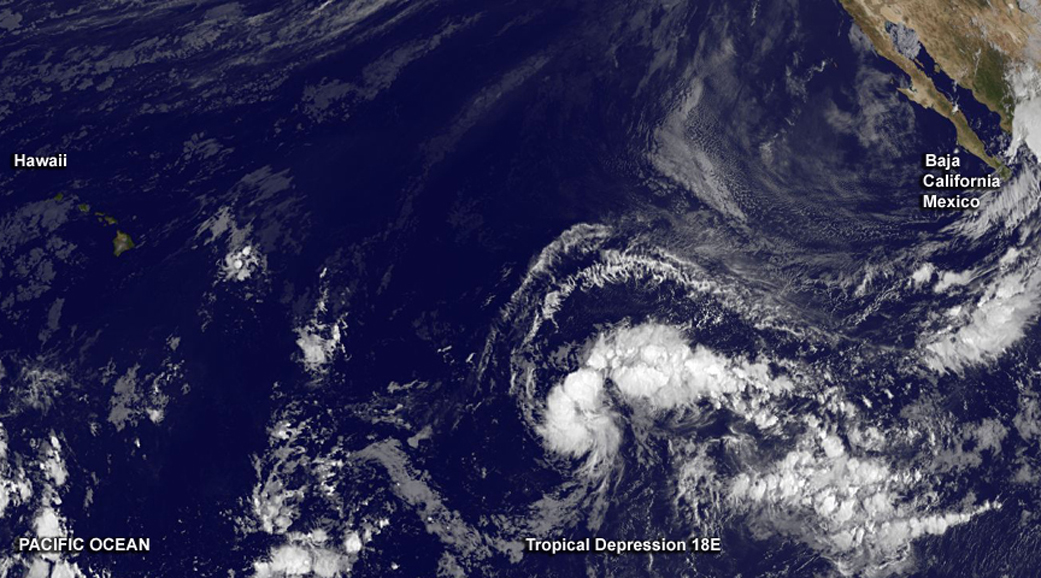
At 11 a.m. EDT/8 a.m. PDT (1500 UTC), the center of Tropical Depression Eighteen-E was located near latitude 11.1 North, longitude 132.0 West. That’s about 1,670 miles (2,685 km) west-southwest of the southern tip of Baja California, Mexico and the same distance but east-southeast of South Point, Hawaii!
An image of the depression was captured by NOAA’s GOES-West satellite that showed the storm directly between the two land forms. The image was created by the NASA/NOAA GOES Project at the NASA Goddard Space Flight Center, Greenbelt, Maryland.
Forecaster Blake at the National Hurricane Center said in a discussion, “Satellite images indicate that the area of low pressure in the far southwestern portion of the eastern Pacific has become better organized. Curved banding features have increased, along with a growing area of deep convection near the center. Thus the system is declared a tropical depression, the 18th of the season.”
The depression is moving toward the west near 14 mph (22 kph) and this general motion is expected to continue for the next couple of days. Maximum sustained winds are near 35 mph (55 kph) with higher gusts. Strengthening is forecast during the next 48 hours and the depression could become a hurricane on Sunday, October 11.
For updated forecasts on the depression, visit: www.nhc.noaa.gov.