


Former Hurricane Pali Peters Out Near Equator
Imagery from NOAA’s GOES-West satellite has shown that former Hurricane Pali has petered out near the Equator.
The NASA/NOAA GOES Project at NASA’s Goddard Space Flight Center in Greenbelt, Maryland created an image of the remnant clouds of former Hurricane Pali from NOAA’s GOES-West satellite data. The image was taken on Jan. 15 at 1200 UTC (7 a.m. EST) and showed the elongated former tropical cyclone just north of the Equator.
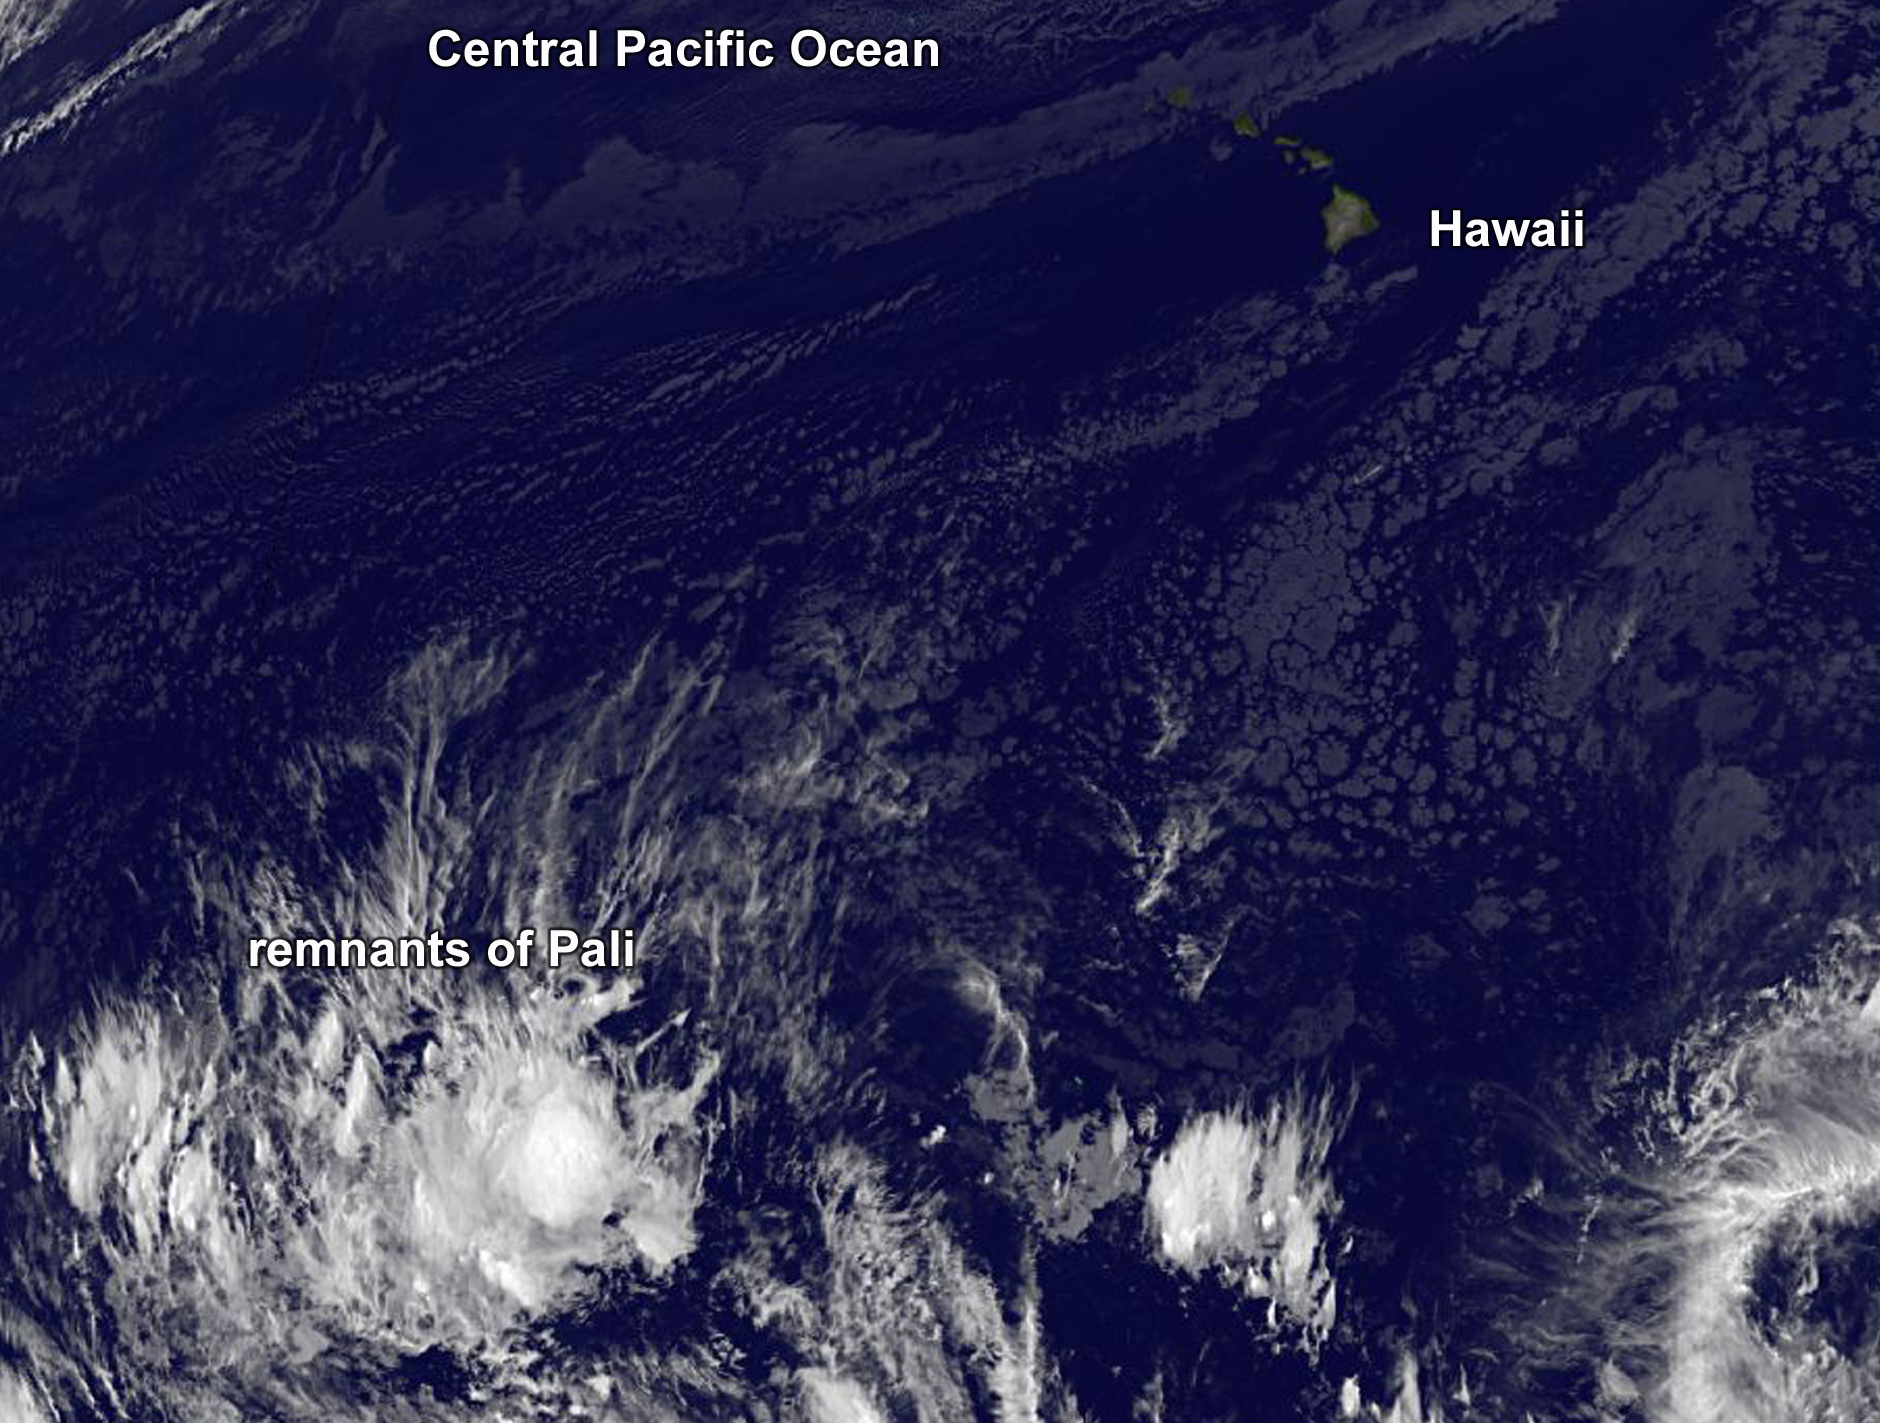
At 10 a.m. EST (1500 UTC) Pali’s remnants were dissipating near the Equator far southwest of Hawaii. Maximum sustained winds were near 30 mph (45 kph) and weakening. Vertical wind shear of about 30 knots (34.5 mph/55.5 kph) continued to blow over the area which helped elongate the former tropical depression. NOAA’s Central Pacific Hurricane Center noted “microwave satellite data showed the circulation associated with Pali had become highly disrupted and elongated…and it is no longer possible to definitively locate a closed center.”
At that time Pali’s remnants were about 1,700 miles (2,735 km) southwest of Honolulu, Hawaii and about 1,065 miles (1,715 km) south-southwest of Johnston Island, near latitude 1.7 north and longitude 173.2 west. Pali’s remnants were moving toward the southwest near 3 mph (6 kph).
The remnants of Pali are expected to continue tracking slowly southwest for the next couple of days.
Rob Gutro
NASA’s Goddard Space Flight Center
Jan. 14, 2016 – NASA Sees Tropical Depression Pali Headed Toward Equator
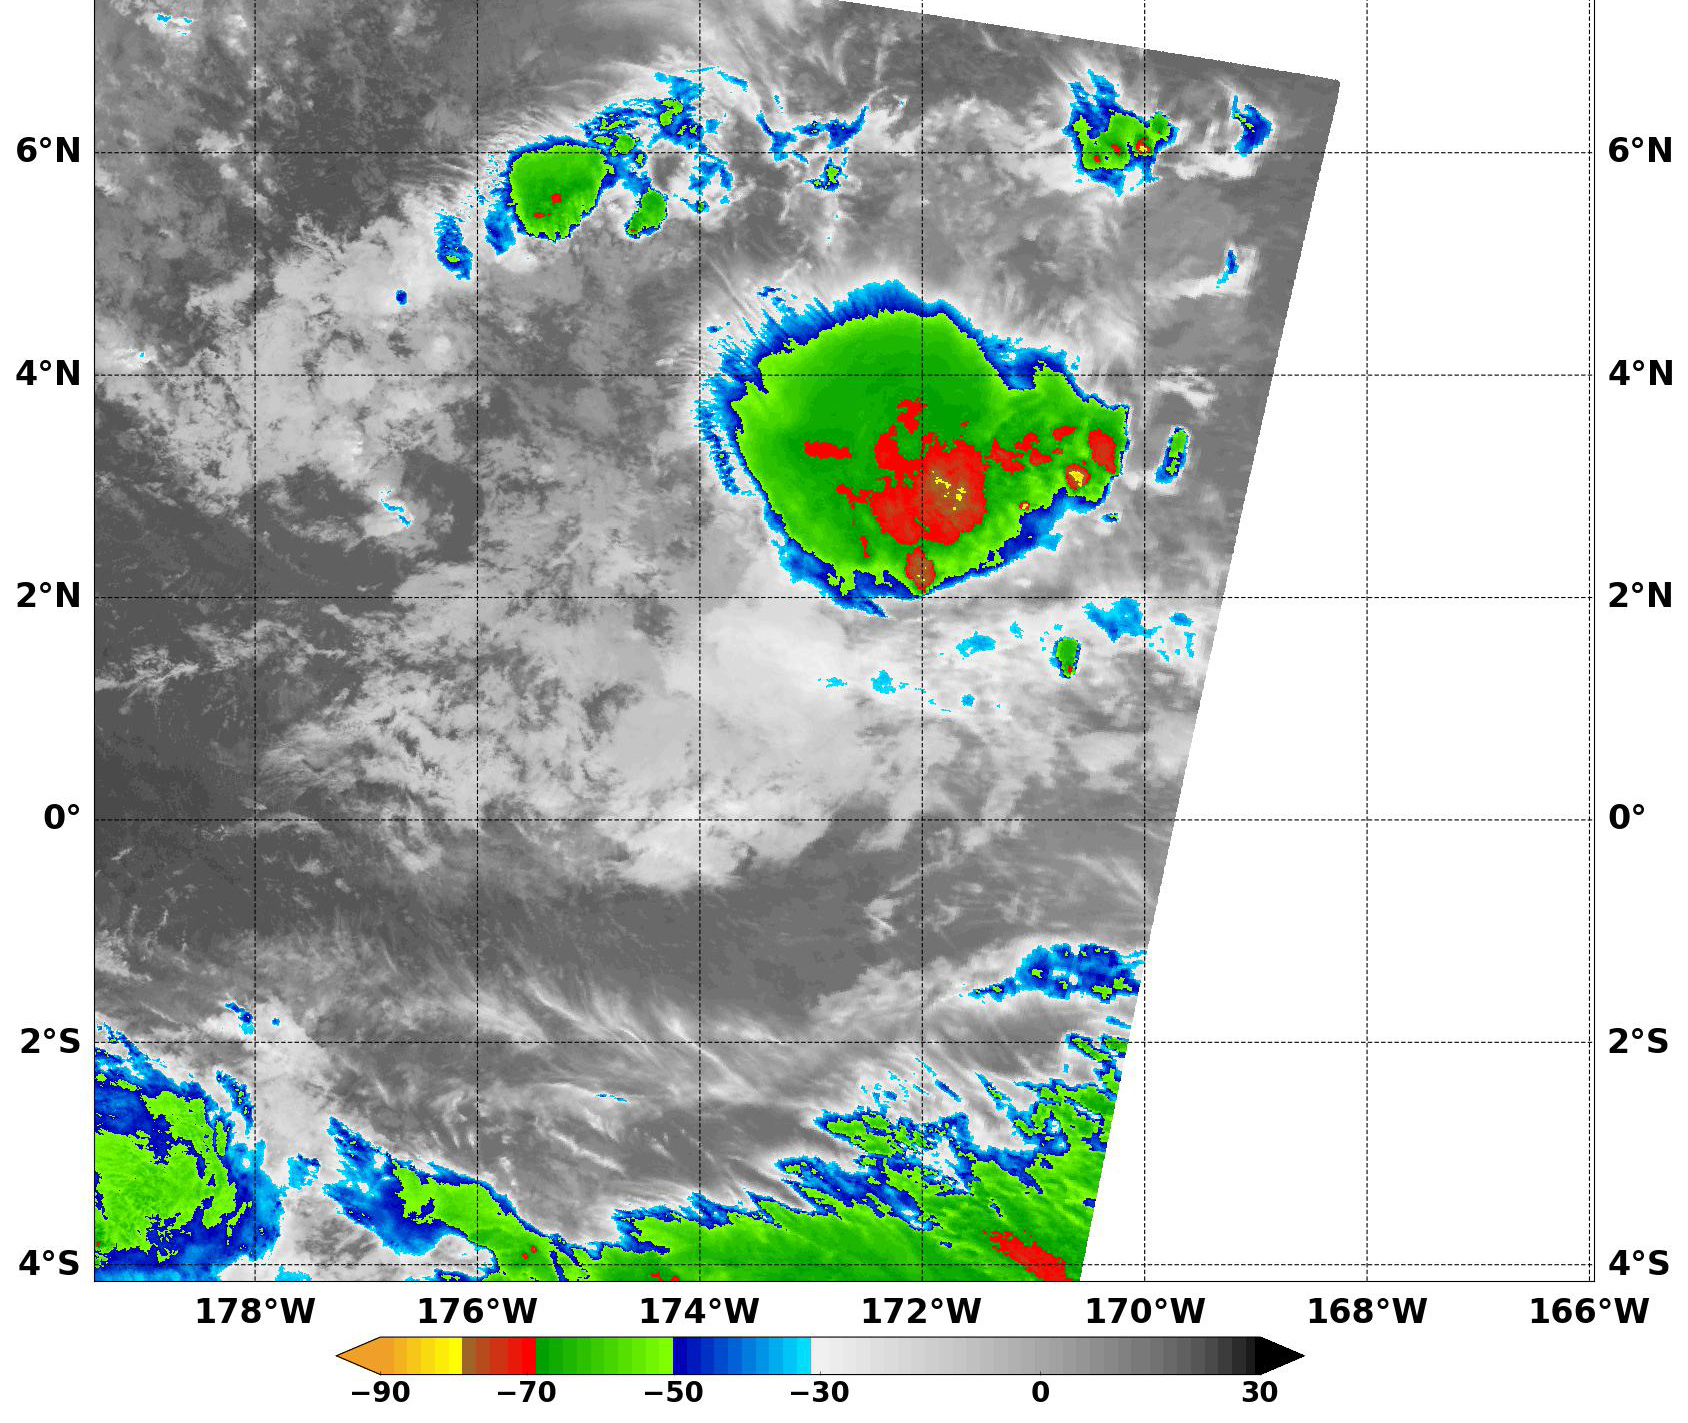
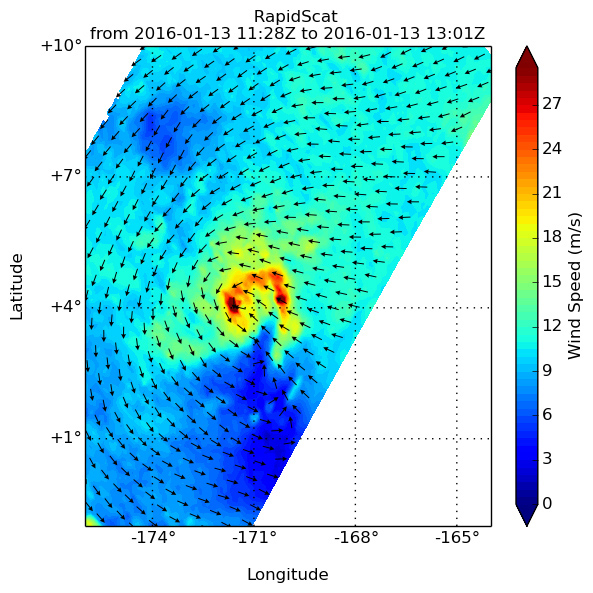
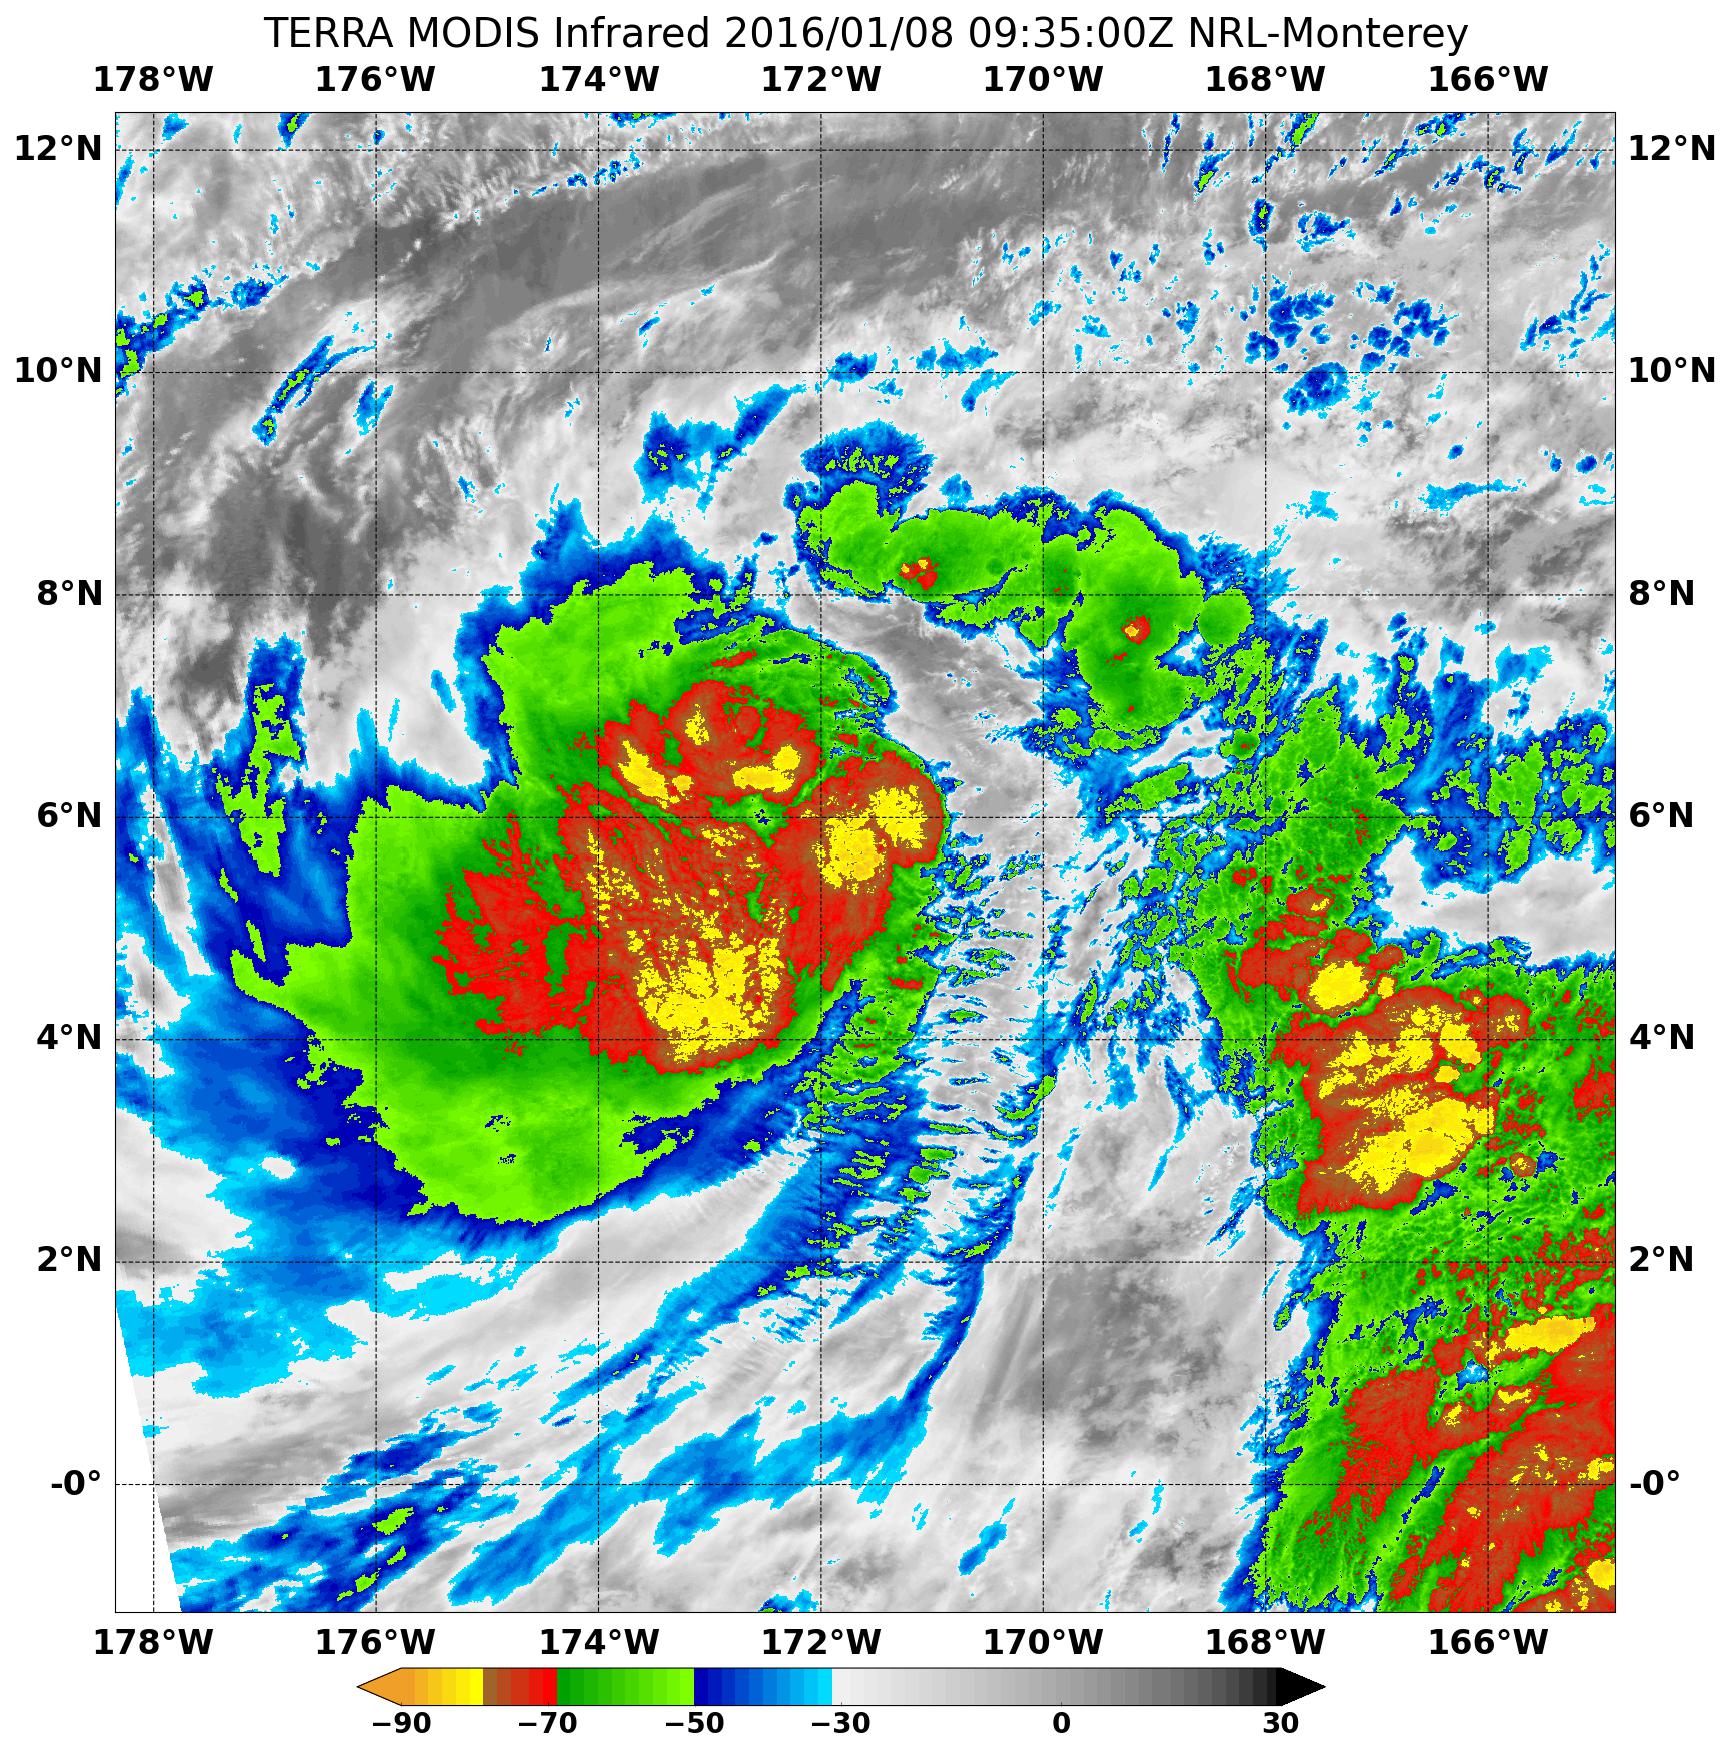
NASA’s Aqua satellite imagery showed just a small area of strong thunderstorms remained in the now weaker Tropical Depression Pali as it moved closer to the Equator. NASA’s RapidScat instrument measured surface winds in the storm as it was weakening to a depression.
When Pali was still a tropical storm on Jan. 13 at 1200 UTC (7 a.m. EST), NASA’s RapidScat instrument measured strongest sustained winds near 27 meters per second (60.4 mph/97.2 kph) both east and west of center. Within a day, increased vertical wind shear weakened the storm to a depression. Maximum sustained winds are not always equally distributed in a hurricane or tropical storm, and the RapidScat instrument helps forecasters find the strongest quadrants of a storm. RapidScat is an instrument that flies aboard the International Space Station.
Thunderstorms development appeared to be limited to a small area north or northeast of Pali’s center. That’s what a false-colored infrared image showed on Jan. 14 at 1335 UTC (8:35 a.m. EST) that was taken by the Moderate Resolution Imaging Spectroradiometer (MODIS) instrument that flies aboard NASA’s Aqua satellite. The MODIS data showed the small area of thunderstorms had cloud top temperatures near minus 80 Fahrenheit (minus 62.2 Celsius). NASA research has shown that thunderstorms with cloud top temperatures that high have the ability to generate heavy rain.
On Thursday, January 14, 2016 at 10 a.m. EST (5 a.m. HST/1500 UTC) the center Of Tropical Depression Pali was located near latitude 2.5 north and longitude 173.0 west. That’s about 1,650 miles (2,650 km) southwest of Honolulu, Hawaii and about 1,010 miles (1,625 km) south-southwest of Johnston Island.
Maximum sustained winds were near 35 mph (55 kph) and continued weakening is expected. The estimated minimum central pressure is 1003 millibars. The depression was moving toward the southwest near 6 mph (9 kph) and that general motion is expected to continue until Pali dissipates sometime on Jan. 15.
It is south to southwesterly vertical shear between 20 and 25 knots and Pali’s proximity to the equator are expected to lead to the demise of the storm. In addition, forecaster Brichard of NOAA’s Central Pacific Hurricane Center said “strong westerly winds along the equator which aided in the development of Pali a week ago are no longer present…with the flow now headed toward an expansive area of deep convection in the southern hemisphere.”
Pali is expected to dissipate sometime on Friday, January 15, 2016.
Rob Gutro
NASA’s Goddard Space Flight Center
Jan. 13, 2016 – NASA Analyzes Hurricane Pali’s Rainfall Rates
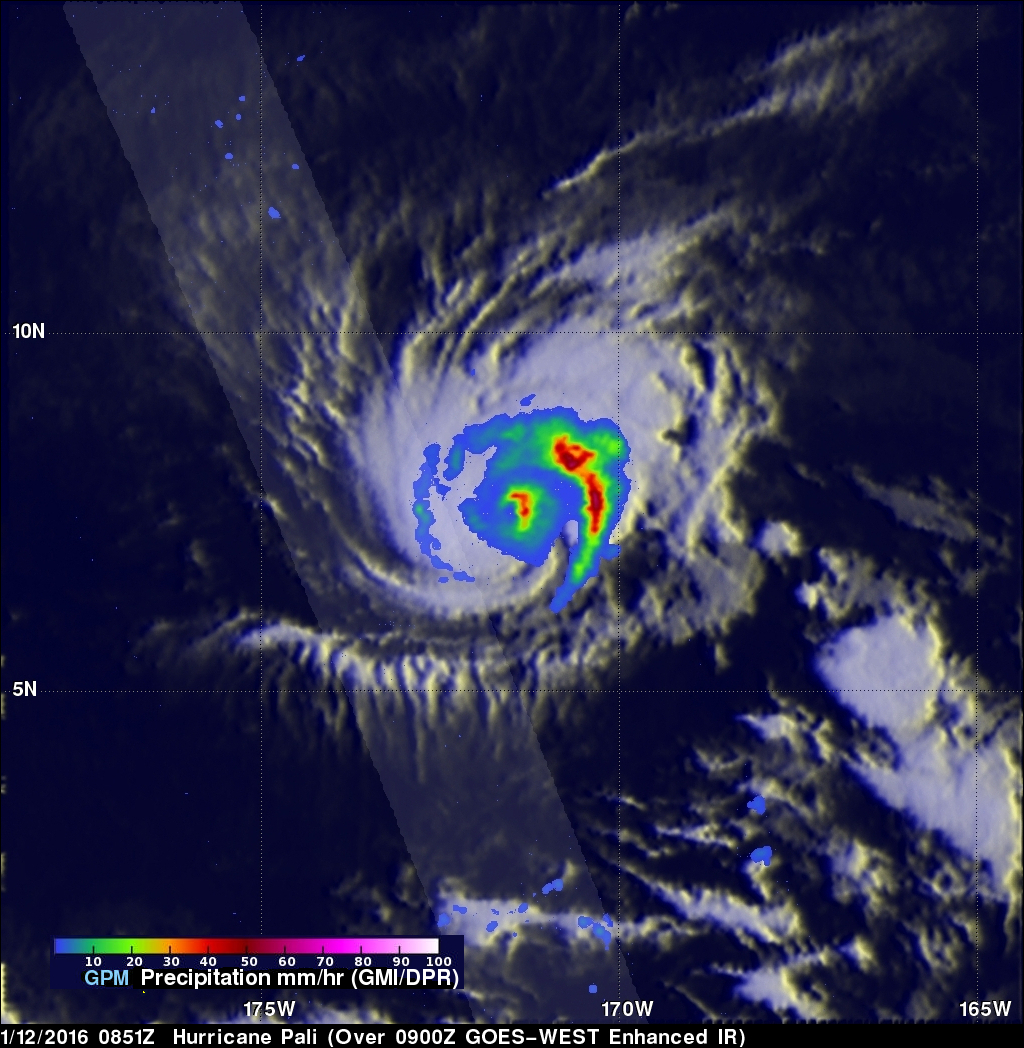
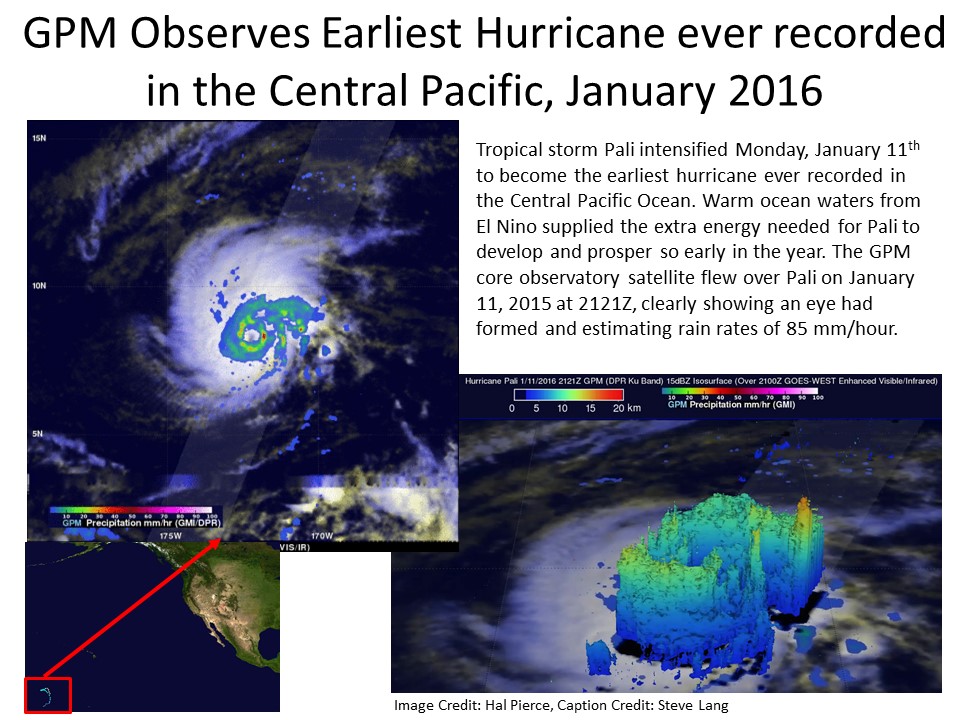
Tropical storm Pali intensified late on Jan. 11 to become the earliest hurricane ever recorded in the Central Pacific Ocean. Warm ocean waters from El Nino supplied the extra energy needed for Pali to develop and prosper so early in the year. NASA’s GPM core observatory got an inside look at the record-breaking hurricane while the Suomi NPP satellite captured a visible-light look at the storm from above.
The GPM core observatory satellite flew over Pali on January 11 at 2121 UTC (4:21 p.m. EST). GPM’s Dual-Frequency Precipitation Radar (DPR) data sliced through Pali clearly showing that an eye had formed. GPM’s DPR measured rain falling at a rate of 84.5 mm (3.3 inches) per hour on the eastern side of Pali’s forming eye. On Jan. 12, GPM saw heaviest rainfall occurring on in the eastern eyewall and in a band of thunderstorms in the eastern quadrant at 50 mm (~2 inches) per hour.
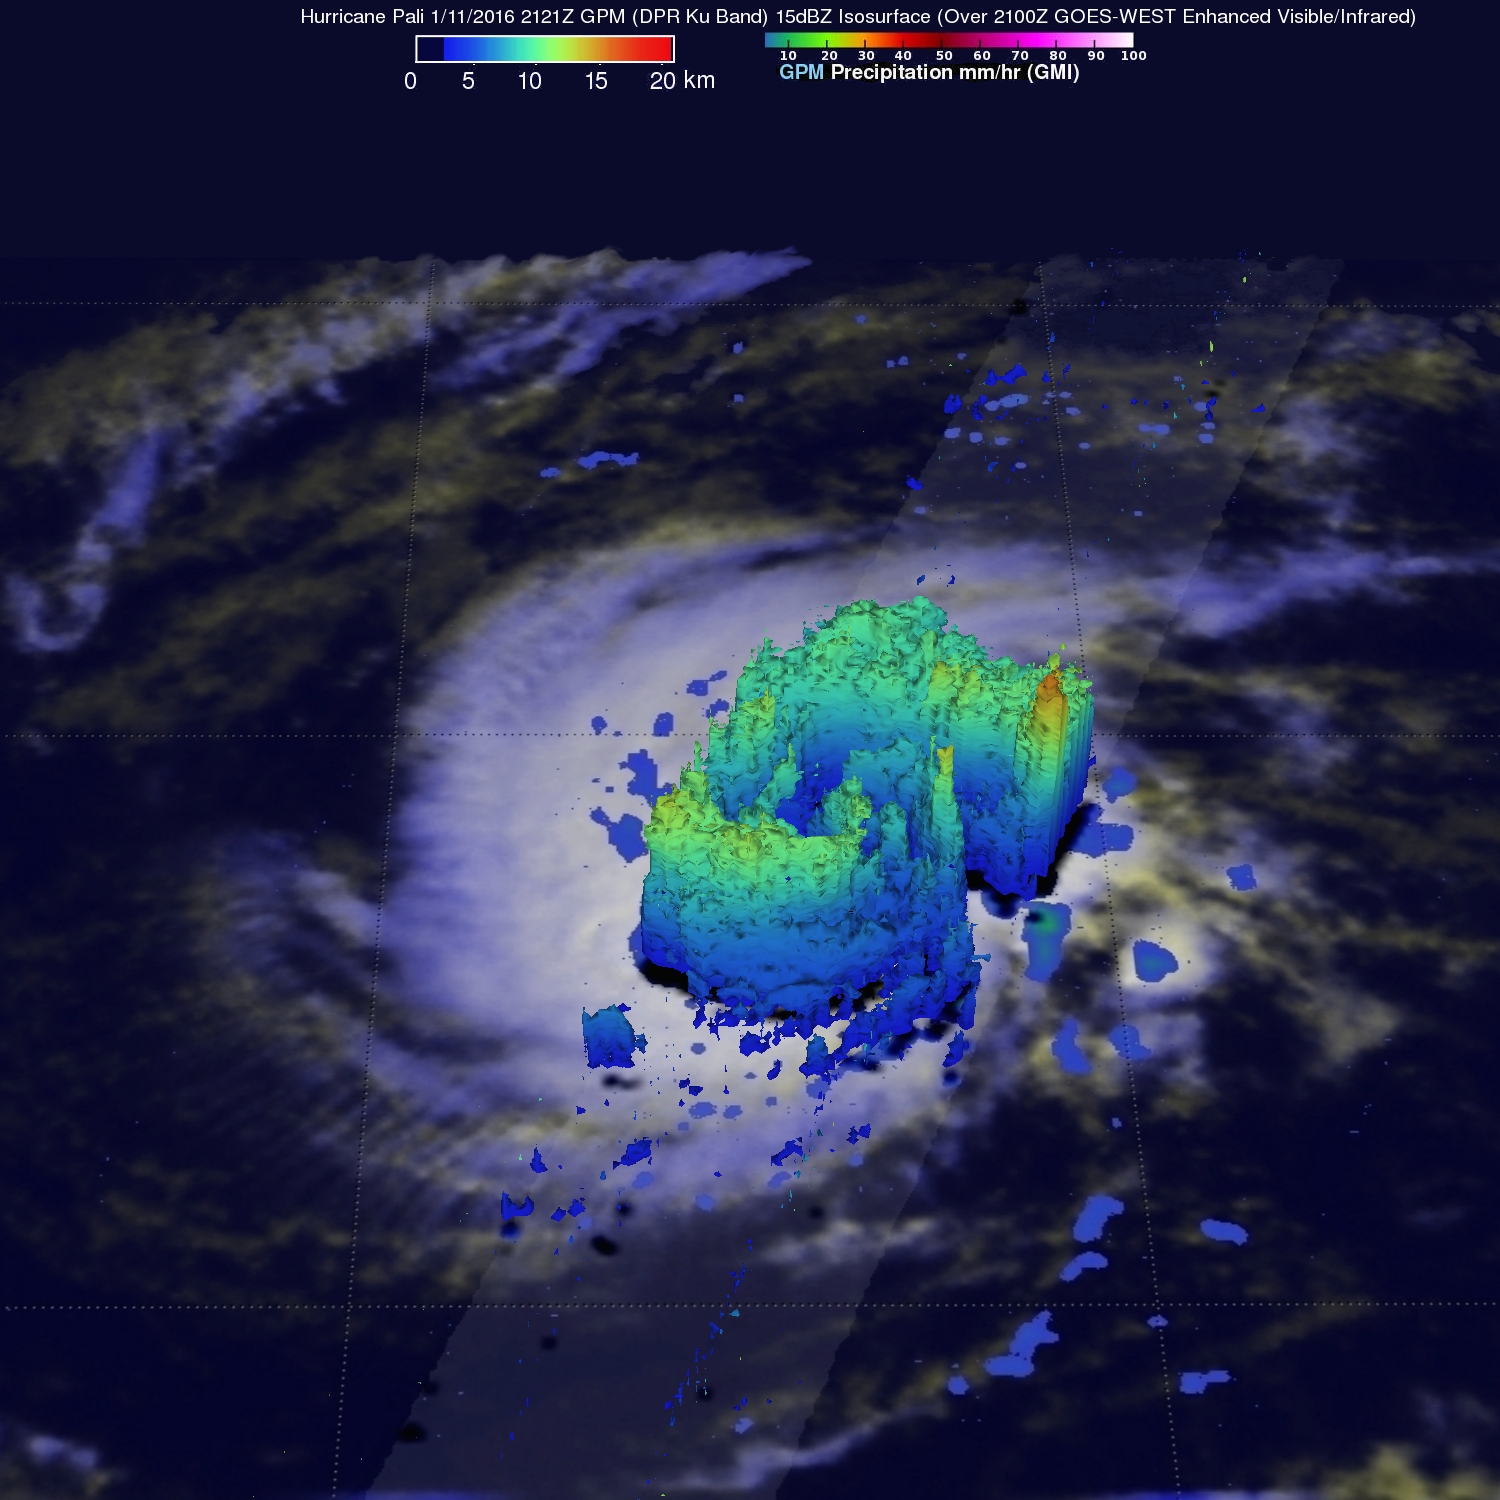
GPM’s radar (DPR Ku Band) peered through Pali’s clouds and discovered that powerful convective storms south of the eye were reaching heights of about 12.5 km (7.8 miles). GPM measured the tallest storm top heights of 16.6 km (10.3 miles) in a strong feeder band wrapping around Pali’s eastern side.
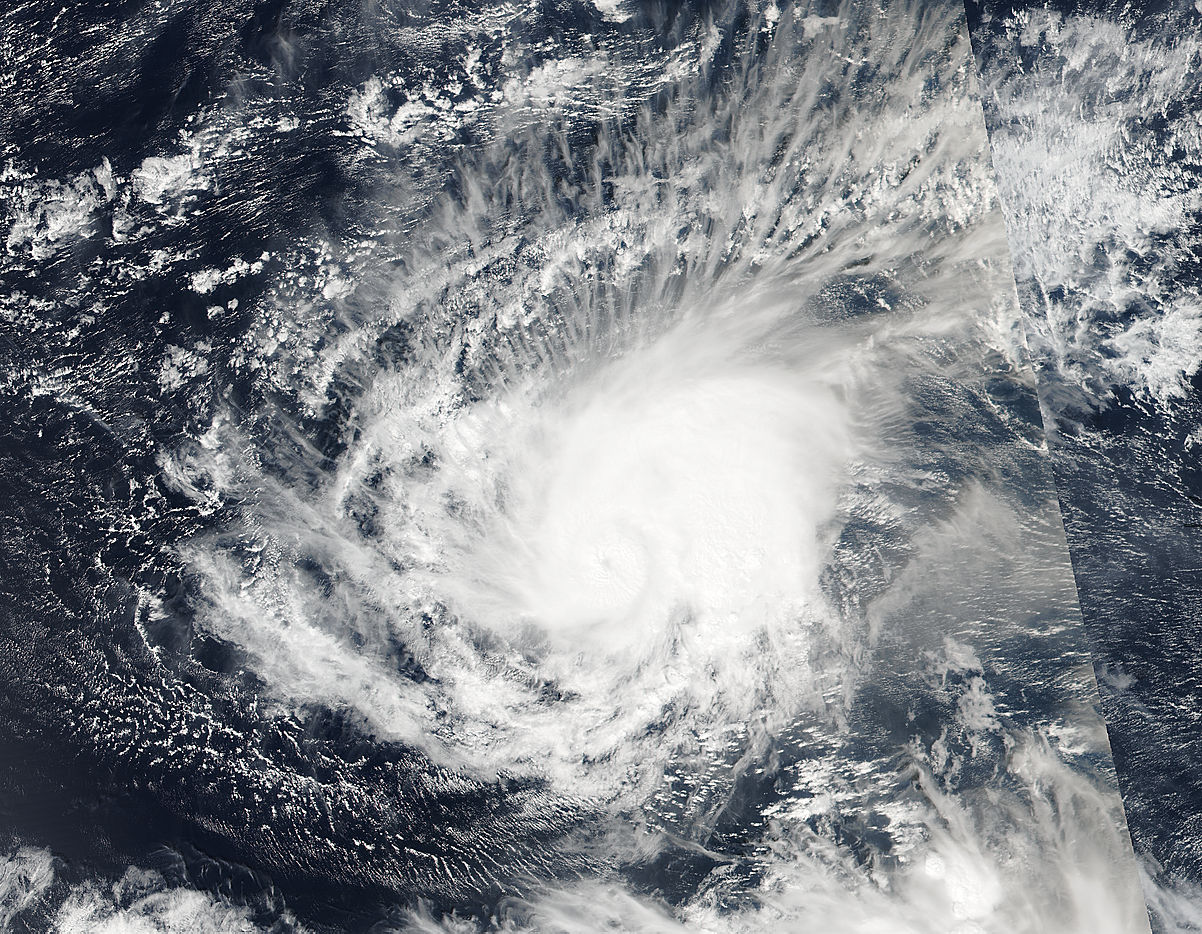
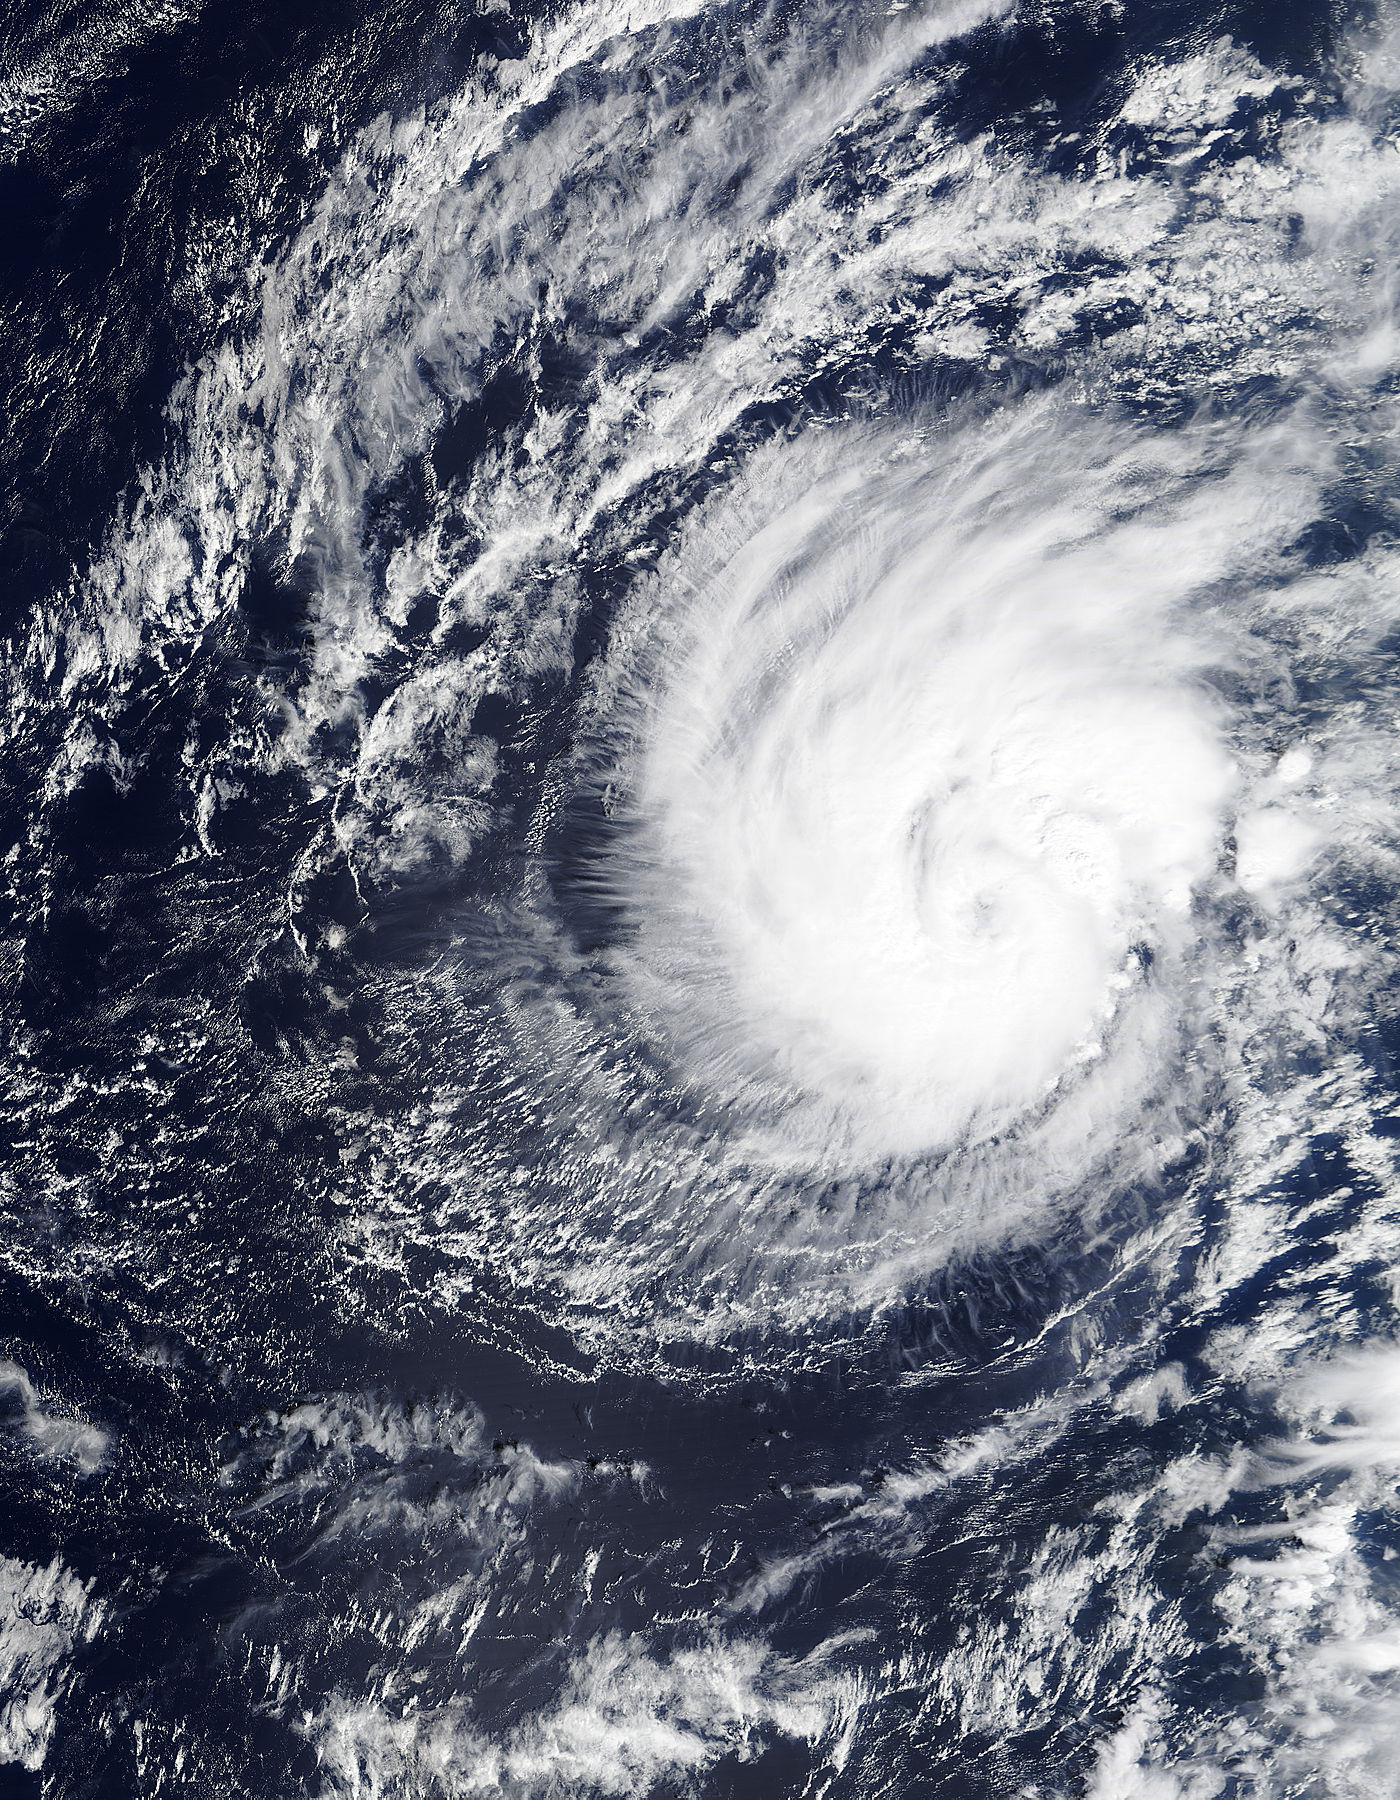
On Jan. 13, at 01:15 UTC (Jan. 12 at 9:15 p.m. EST) the Visible Infrared Imaging Radiometer Suite (VIIRS) instrument aboard NASA-NOAA’s Suomi NPP satellite captured a visible light image of Hurricane Pali in the central Pacific Ocean. The image showed that the eye had become cloud-filled and bands of thunderstorms continued to circle the center of the storm. VIIRS collects visible and infrared imagery and global observations of land, atmosphere, cryosphere and oceans.
On Jan. 13 at 10 a.m. EST (5 a.m. HST/1500 UTC) NOAA’s Central Pacific Hurricane Center (CPHC) reported the center of Hurricane Pali was located near latitude 4.2 north and longitude 171.8 west. That’s about 875 miles (1,410 km) south of Johnston Island and 1,505 miles (2,420 km) southwest of Honolulu, Hawaii. Maximum sustained winds are near 80 mph (130 kph) and weakening is forecast over the next couple of days. Pali’s hurricane force winds were concentrated and extended outward up to 10 miles (20 km) from the center. Tropical storm force winds extend outward up to 105 miles (165 km).
Pali was moving toward the south-southwest near 8 mph (13 kph) and a turn toward the southwest later today will be followed by a turn toward the west by Friday, Jan. 15. For updated forecasts, visit NOAA’s CPHC: http://www.prh.noaa.gov/hnl/cphc/.
Harold F. Pierce / Rob Gutro
NASA’s Goddard Space Flight Center
Jan. 12, 2016 – NASA’s Terra Satellite Spots Record-Breaking Hurricane Pali
Shortly after NASA’s Terra satellite passed over Tropical Storm Pali it strengthened into a record-breaking hurricane.
On Jan. 11 at 22:30 UTC (5:30 p.m. EST) the MODIS instrument aboard NASA’s Terra satellite captured a visible image of strengthening Tropical Storm Pali in the Central Pacific Ocean. On Jan. 11 at 10 p.m. EST (5 p.m. HST/Jan 12 at 0300 UTC) Pali became the earliest hurricane on record in the central Pacific basin far to the southwest of Hawaii. In the MODIS image, Pali’s eye was visible surrounded by a strong circle of thunderstorms and a thick band of thunderstorms spiraled into the low level center from the western quadrant.
NOAA’s Central Pacific Hurricane Center forecaster Wroe noted “after exhibiting a rather well defined eye through the evening…a recent burst of deep convection around the center of Hurricane Pali has caused the eye to become cloud filled…likely due to southwesterly vertical wind shear of around 15 knots.”
On Jan. 12 at 10 a.m. EST (5 a.m. HST/1500 UTC) the center of Hurricane Pali was located near latitude 6.8 north and longitude 171.4 west. That’s about 695 miles (1,120 km) south of Johnston Island and 1,345 miles (2,170 km) southwest of Honolulu, Hawaii. Maximum sustained winds are near 90 mph (150 kph). Slow weakening is expected through Thursday morning, Jan. 14. The estimated minimum central pressure is 979 millibars. Pali was moving toward the south near 7 mph and is expected to gradually turn to the southwest.
CPHC said that although Pali will remain over warm sea surface temperatures of 28 to 29 Celsius (82.4 to 84.2 Fahrenheit) along the forecast track…ships indicates a modest Increase in wind shear that could produce some weakening during the next couple of days as it moves toward the equator. For updated forecasts, visit: http://www.prh.noaa.gov/cphc.
Rob Gutro
NASA’s Goddard Space Flight Center
Jan. 11, 2016 – (Update #2) GPM Observers Earliest Hurricane Ever Recorded in North Central Pacific Ocean
Jan. 11, 2016 – Unusual Tropical Storm Pali Still Thriving Far from Hawaii
Tropical Storm Pali, an out-of-season storm for the Central Pacific Ocean, continues to thrive about 8 degrees latitude north of the Equator. A recent infrared image from the GOES-West satellite showed that Pali a small cyclone.
NOAA’s GOES-West satellite provided an infrared image of Pali on Jan. 11 at 1500 UTC (10 a.m. EST) that showed the storm far to the southwest of Hawaii in the Central Pacific Ocean. Strongest thunderstorms appeared to be around the center of circulation and south and east of the center. The image was created at NASA/NOAA’s GOES Project at NASA’s Goddard Space Flight Center in Greenbelt, Maryland.
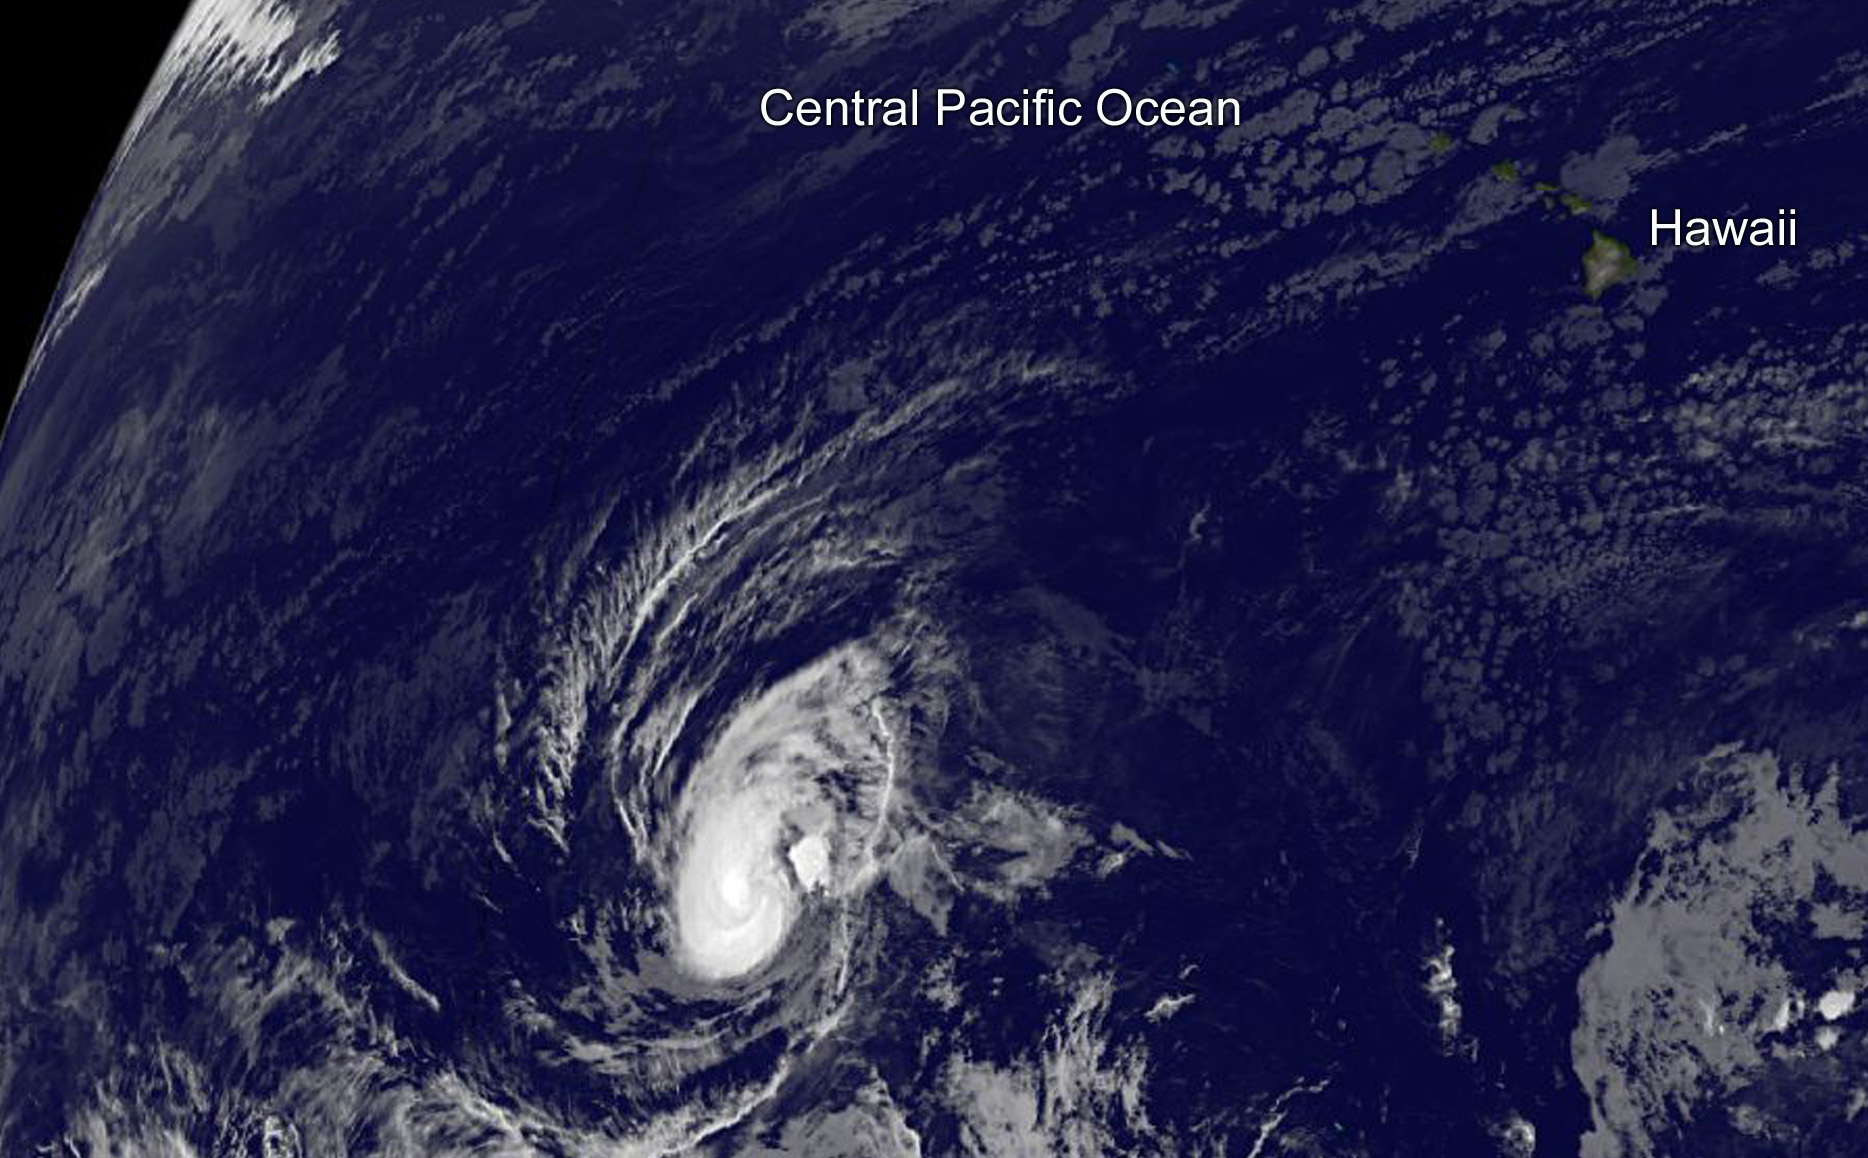
On Jan. 11 at 10 a.m. EST (5 a.m. HST/1500 UTC) the center of Tropical Storm Pali was located near latitude 8.3 north and longitude 172.9 west. That’s about 625 miles (1005 km) south-southwest of Johnston Island, and about 1,345 miles (2,160 km) southwest of Honolulu, Hawaii. Pali is no threat to land.
Maximum sustained winds were near 60 mph (95 kph). NOAA’s Central Pacific Hurricane Center expects some slight intensification over the next couple of days. The estimated minimum central pressure is 993 millibars.
Pali was moving toward the east-northeast near 5 mph (7 kph) and that general motion is expected to continue today…followed by a turn toward the southeast and then to the south from tonight through Tuesday evening, Jan. 12. Pali is headed toward the Equator and is currently expected to maintain tropical storm strength as far out as Saturday, Jan. 16.
For updated forecasts on Pali, visit: http://www.prh.noaa.gov/cphc
Rob Gutro
NASA’s Goddard Space Flight Center
Jan. 08, 2016 – NASA Investigates Tropical Storm Pali’s Temperatures, Winds
The Central Pacific Ocean’s out-of-season tropical depression has strengthened into a tropical storm and has been renamed Pali. NASA’s RapidScat instrument and Terra satellite gathered wind and temperature data on the unusual storm far to the southwest of Hawaii.
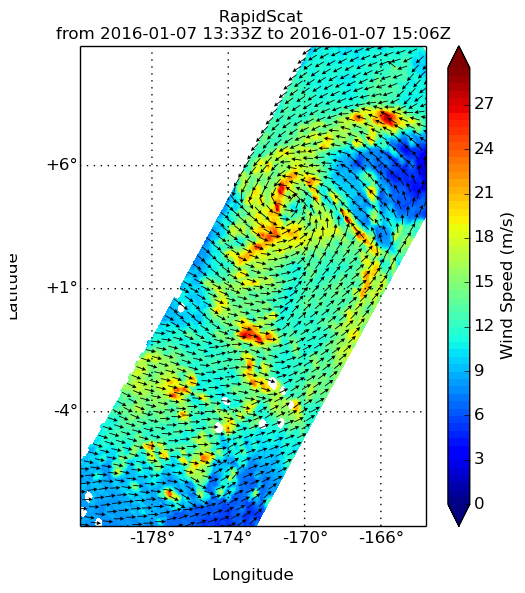
On January 7, the RapidScat instrument that flies aboard the International Space Station measured the surface winds in the then tropical depression 1C. RapidScat measures wind speed at the surface which is always lower than speeds at higher altitude. Maximum sustained winds are not always equally distributed in a hurricane or tropical storm, and the RapidScat instrument helps forecasters find the strongest quadrants of a storm.
Tropical Depression 1C’s strongest winds appeared in the southwestern quadrant of the storm at 30 meters per second (67.1 mph/ 108 kph). Winds around the rest of the depression were less intense. By Jan. 8, the depression strengthened into a tropical storm.
On Jan. 8 at 09:35 UTC (4:35 a.m. EST) the Moderate Resolution Imaging Spectroradiometer or MODIS instrument aboard NASA’s Terra satellite measured temperatures of Pali’s cloud tops. MODIS data was false-colored at the U.S. Naval Research Laboratory in Washington, D.C. and showed powerful thunderstorms with cloud top temperatures between minus 70 and minus 80 degrees Fahrenheit (minus 56.6 and minus 62.2 Celsius) circled the center.
On Jan. 8 at 0900 UTC (4 a.m. EST/ 11 p.m. HST Jan. 7) the center of Tropical Storm Pali was located near latitude 5.9 north and longitude 171.8 west. That’s about 1,410 miles (2,275 km southwest of Honolulu, Hawaii and 760 miles (1,255 km) south-southwest of Johnston Island. Pali was moving toward the northwest near 8 mph (13 kph) and a turn toward the west-northwest is forecast by late Saturday.
Maximum sustained winds were near 50 mph (85 kph) and little change in intensity is expected for the next 36 hours with slow weakening expected thereafter. The estimated minimum central pressure is 997 millibars. The storm is not a threat to any land areas.
Forecaster Wroe of NOAA’s Central Pacific Hurricane Center said that since Pali is located in the deep tropics “ocean temperatures are sufficiently warm for additional intensification.” However with easterly vertical winds shear around 25 knots (28.7 mph/46.3 kph), some data indicating some westward tilt with height to the cyclone and continued interaction with the low level trough (elongated area of low pressure) the potential for intensification is limited over the next few days.
For updated forecasts on Pali, visit: http://www.prh.noaa.gov/cphc.
Rob Gutro
NASA’s Goddard Space Flight Center
Jan. 07, 2016 – NASA Sees Out-of-Season Central Pacific Tropical Depression Form
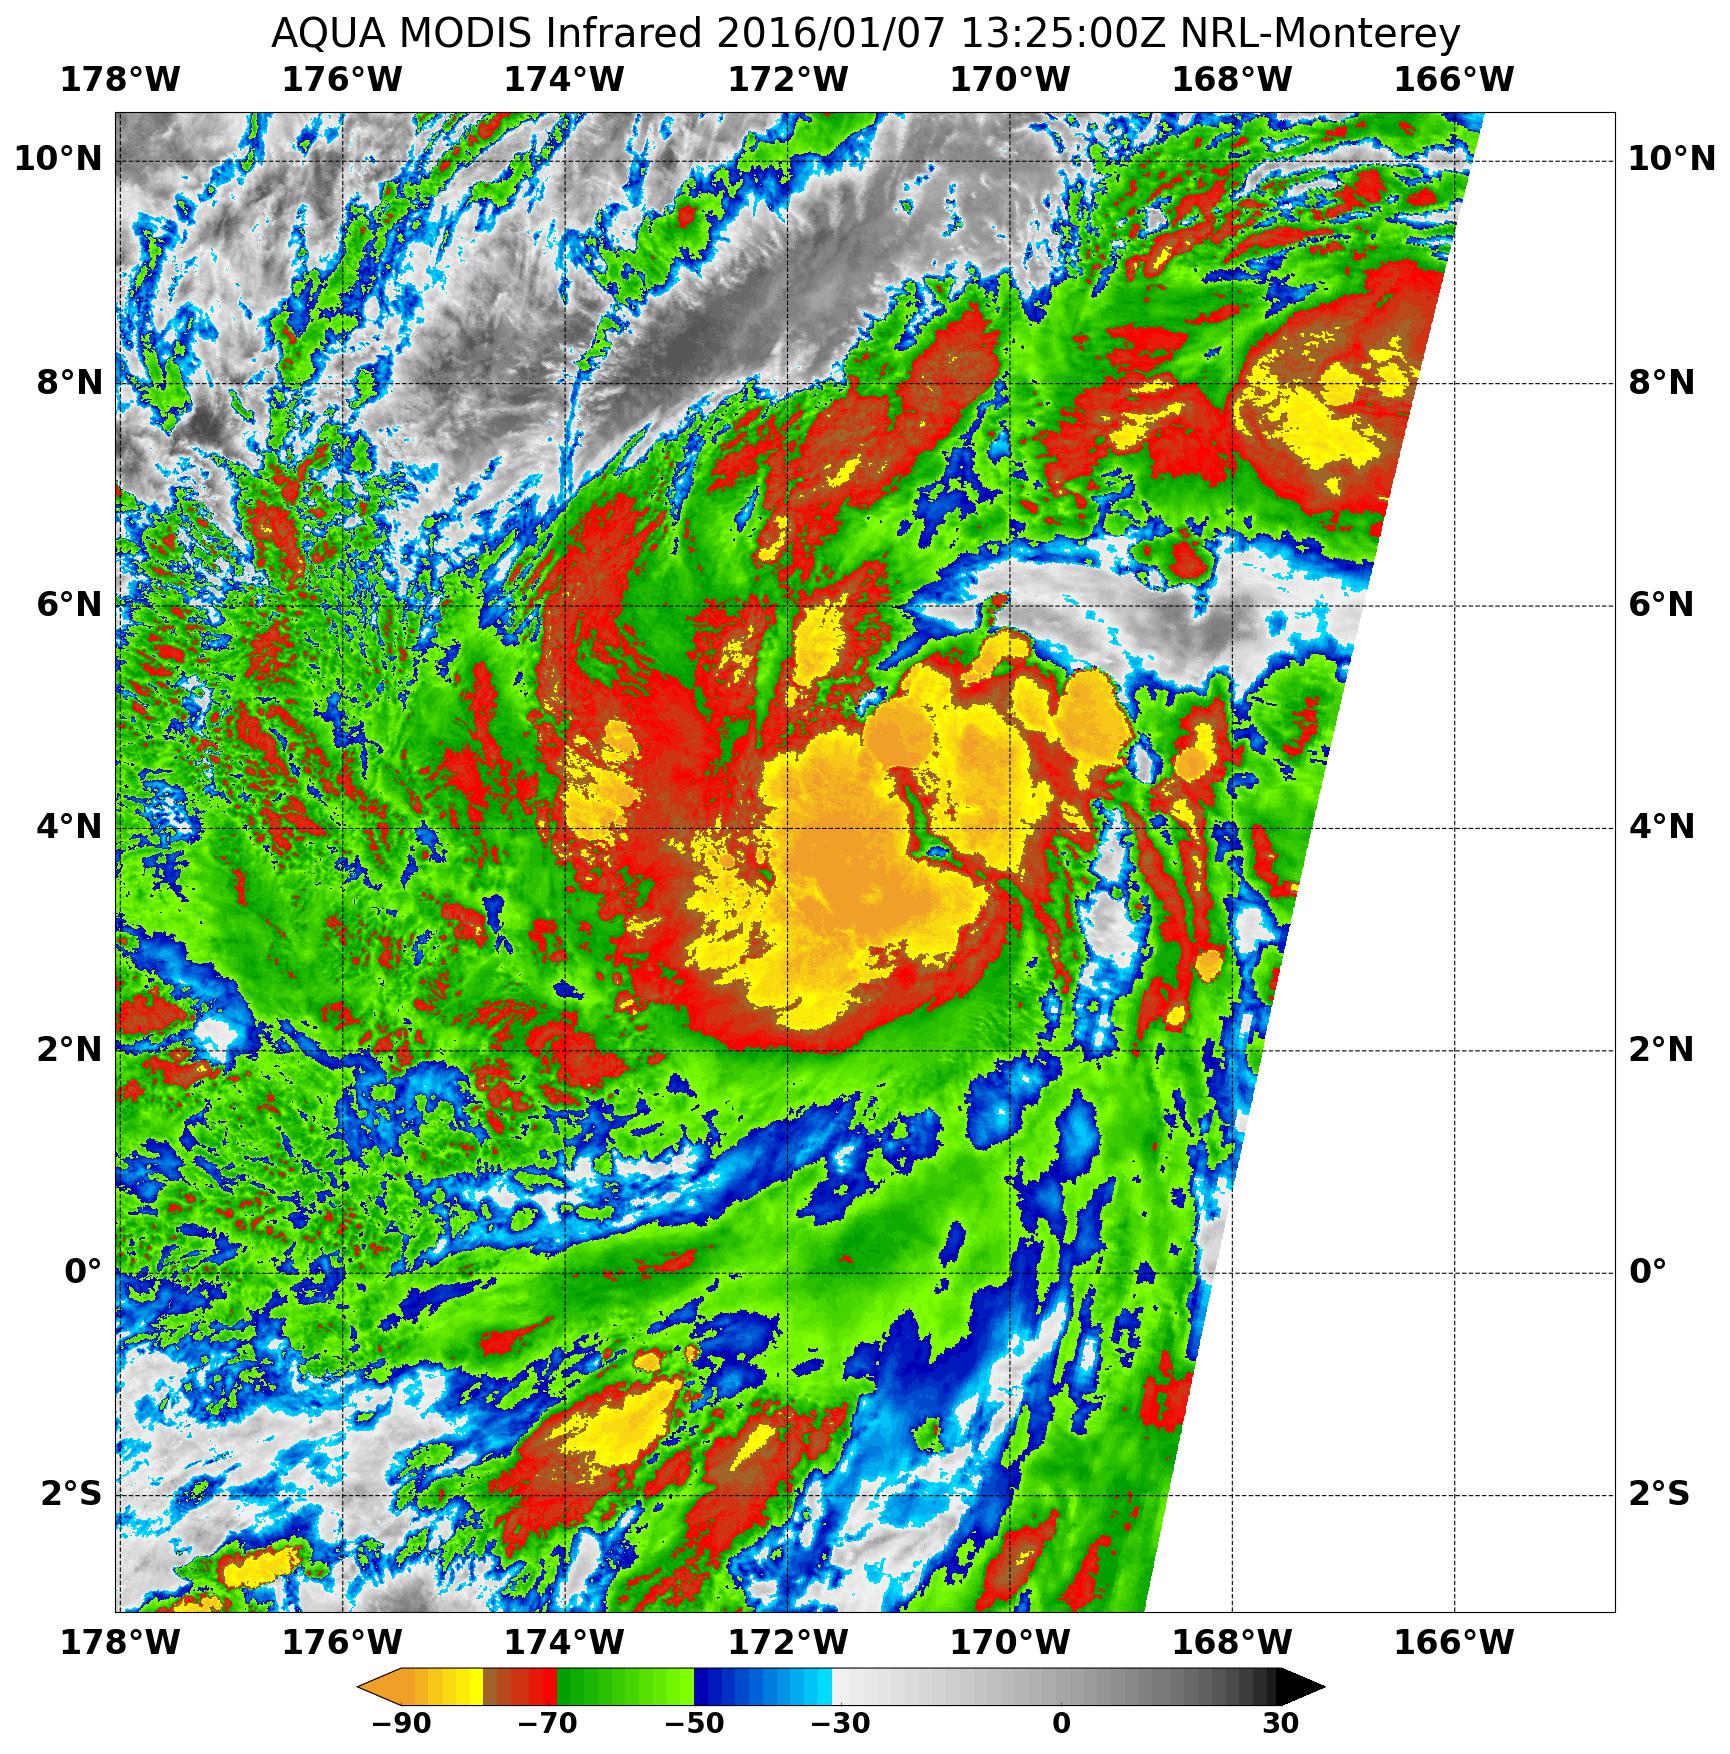
Infrared data from NASA’s Aqua satellite showed powerful thunderstorms persisting in the center of a newly developed out-of-season tropical depression in the Central Pacific Ocean.
The first Tropical Depression of the 2016 hurricane season formed about five months early in the 2016 hurricane season, or two months late after the 2015 Central Pacific Hurricane Season ended. NOAA’s Central Pacific Hurricane Center or CPHC considers the depression the first of the 2016 season since it formed in the 2016 calendar year.
The Moderate Resolution Imaging Spectroradiometer or MODIS instrument that flies aboard NASA’s Aqua satellite captured infrared temperature data of the newly developed depression on Jan. 7 at 13:25 UTC (8:25 a.m. EST). The MODIS data showed cloud top temperatures of strong thunderstorms around the center of circulation as cold as -80 degrees Fahrenheit (-62.2 Celsius). Temperatures that cold indicate strong uplift in the storm and cloud tops high into the troposphere. NASA research has shown that storms with cloud tops that cold have the ability to generate heavy rain.
Forecaster Prichard of NOAA’s CPHC noted in the Jan. 7 discussion “Thunderstorms associated with an area of low pressure in the far southwest corner of the central pacific hurricane area of responsibility have persisted sufficiently long to classify the system as a tropical cyclone.”
Further, he noted “this low-latitude out-of-season system has tapped into significant directional (wind) shear of the low-level winds…with an El-Nino related westerly wind burst south of the
system…and prevailing easterly trade winds to the north providing the large scale conditions [and the spin] conducive for development.”
On Jan. 7 at 10 a.m. EST (5 a.m. HST/1500 UTC) the center of Tropical Depression one-C (TD1C) was located near latitude 4.0 north and longitude 171.4 west. That’s about 885 miles (1,425 km) south of Johnston Island. The depression is moving toward the north near 5 mph (7 kph) and that general motion is expected to continue the next day. Maximum sustained winds are near 35 mph (55 kph) and it is expected to become a tropical depression later in the day. The estimated minimum central pressure is 1004 millibars.
For updated forecasts on Tropical Depression 1C, visit NOAA’s CPHC: http://www.prh.noaa.gov/hnl/cphc/.