


Update #8 – Jan. 25, 2016 – 12:07 PM EST
NASA Provides a Look at Post-Blizzard Snowfall and Winds
NASA satellites obtained a number of different views of the great winter storm that left many snowfall records from Virginia to New York City from January 22 to 24, 2016. RapidScat provided a look at the strong winds that led to flooding in southern New Jersey, while NASA’s Aqua satellite and NASA/USGS’s Landsat satellite provided images of the post-storm snowy blanket.
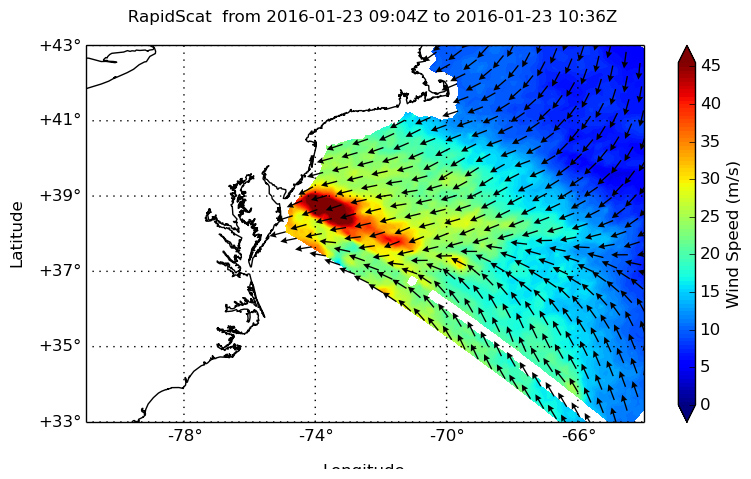
The RapidScat instrument flies aboard the International Space Station and measures surface winds over the ocean. On Jan. 23 at 5 a.m. EST, RapidScat showed sustained winds as strong as 45 meters per second (100 mph/162 kph) along the coast of southern New Jersey, which included areas from Cape May to Atlantic City. Those winds led to flooding along coastal areas.
Some areas along the New Jersey coastline were flooded as winds pushed the ocean waters inland, and serious beach erosion was reported. Philadelphia’s NBC Channel 10 interviewed the mayor of North Wildwood, New Jersey who said the flooding on the morning of Saturday, January 23 was half a foot higher than what the town experienced during Superstorm Sandy in 2012.
RapidScat is an important tool for meteorologists, because maximum sustained winds are not always equally distributed in a storm. RapidScat shows forecasters the location of the strongest winds in different quadrants of a storm, indicating locations facing greatest impacts.
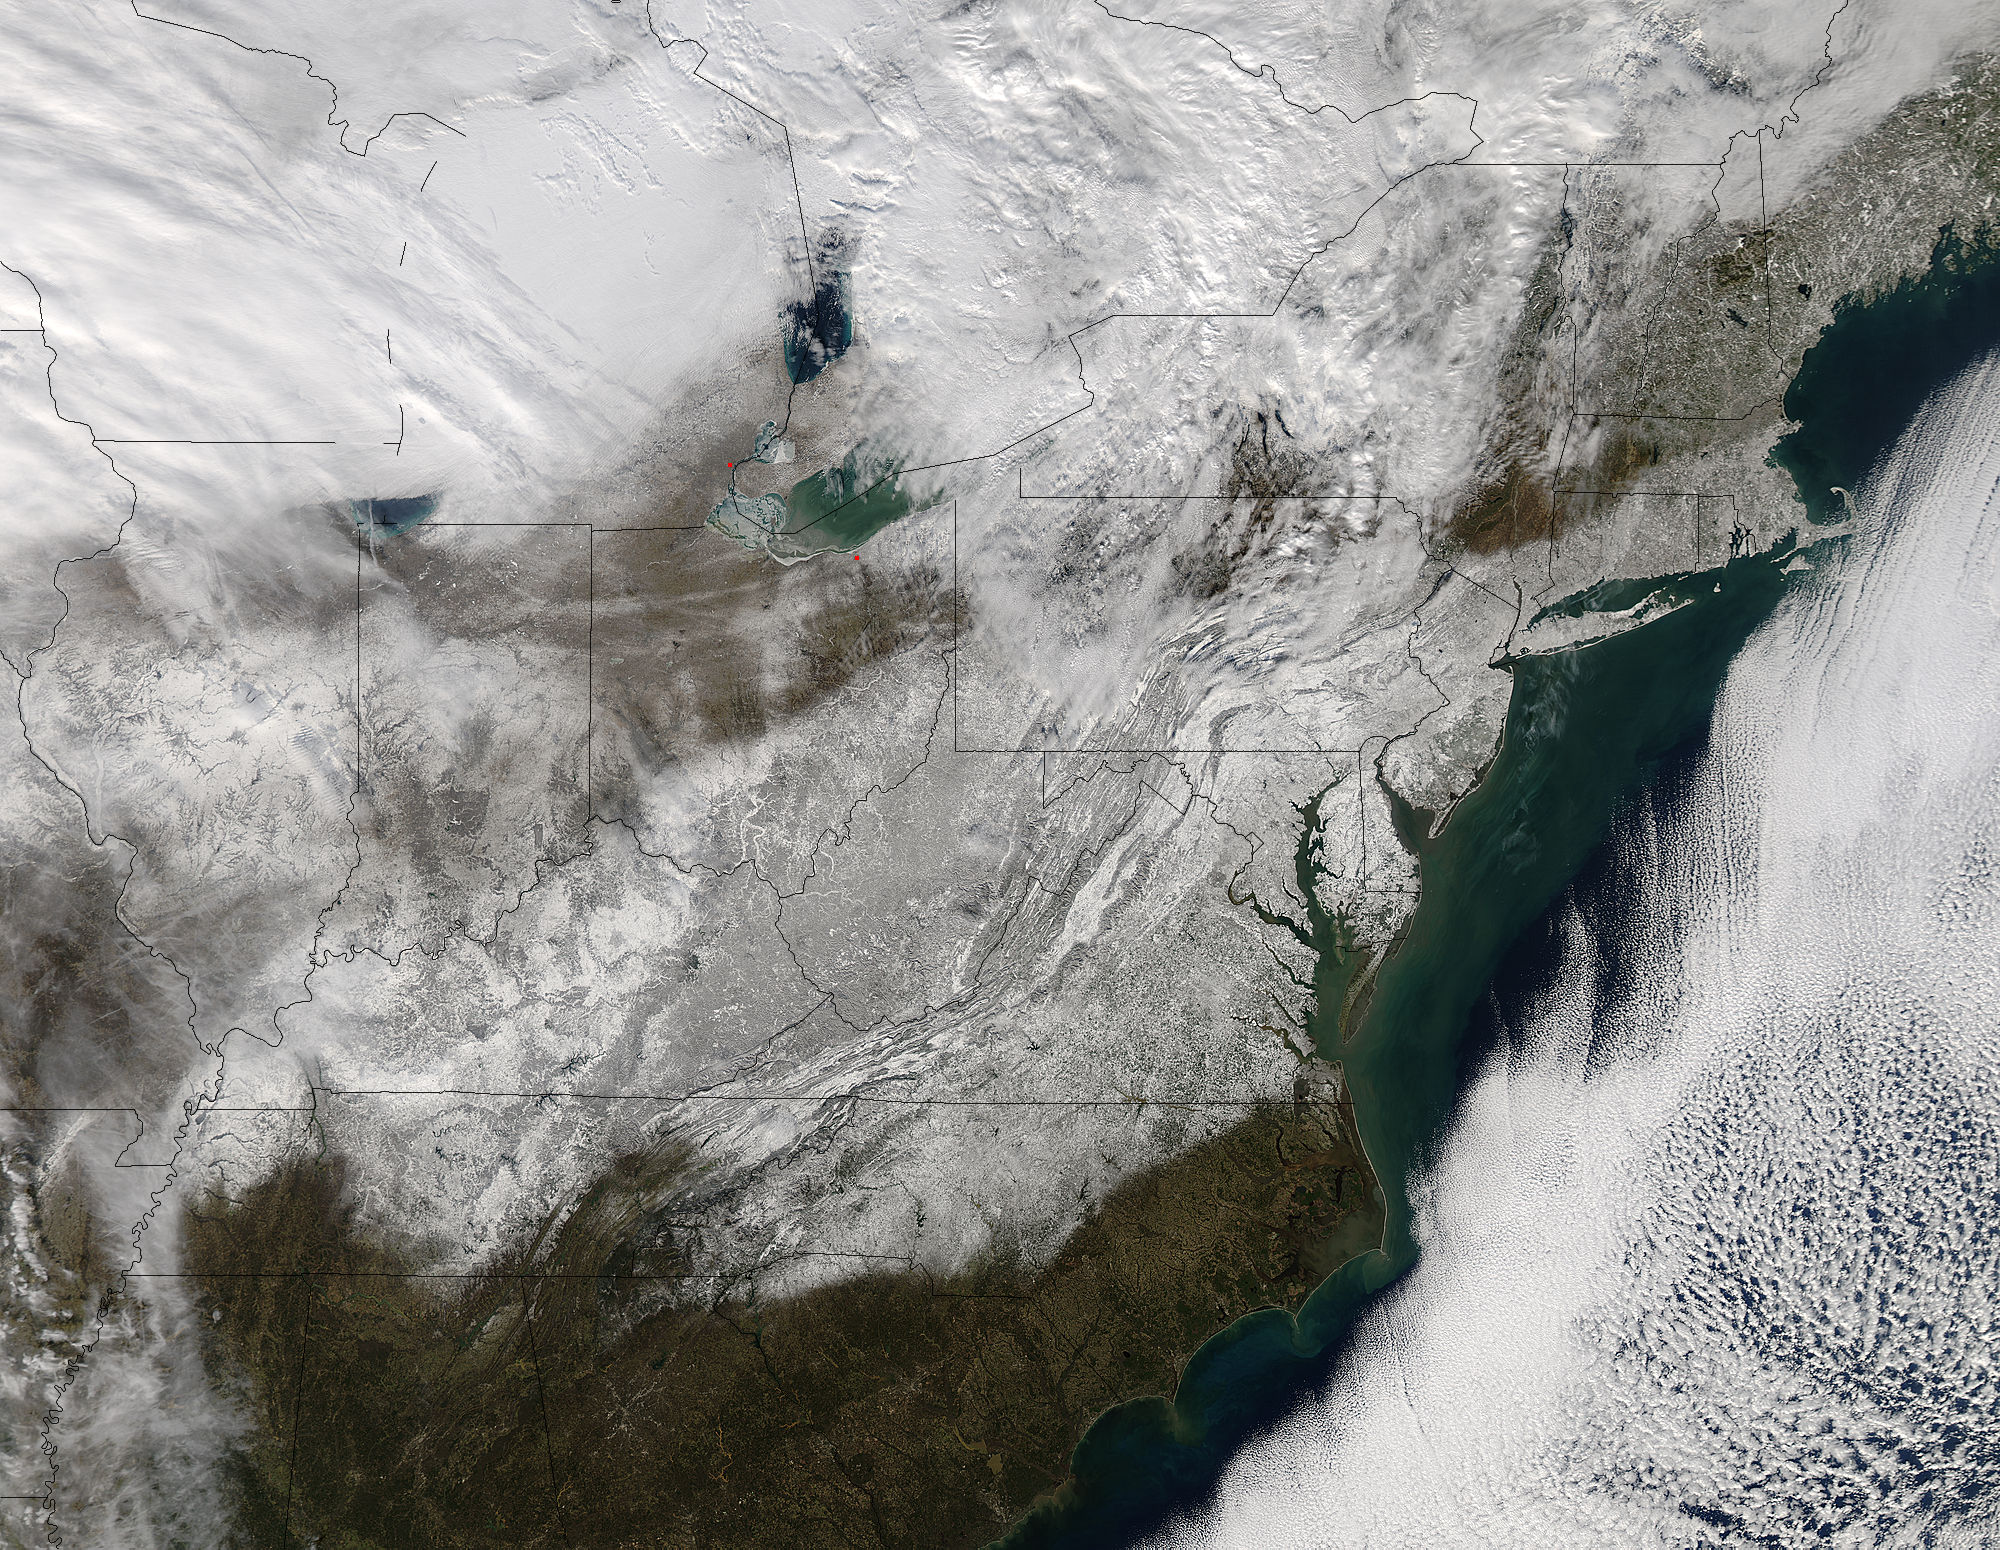
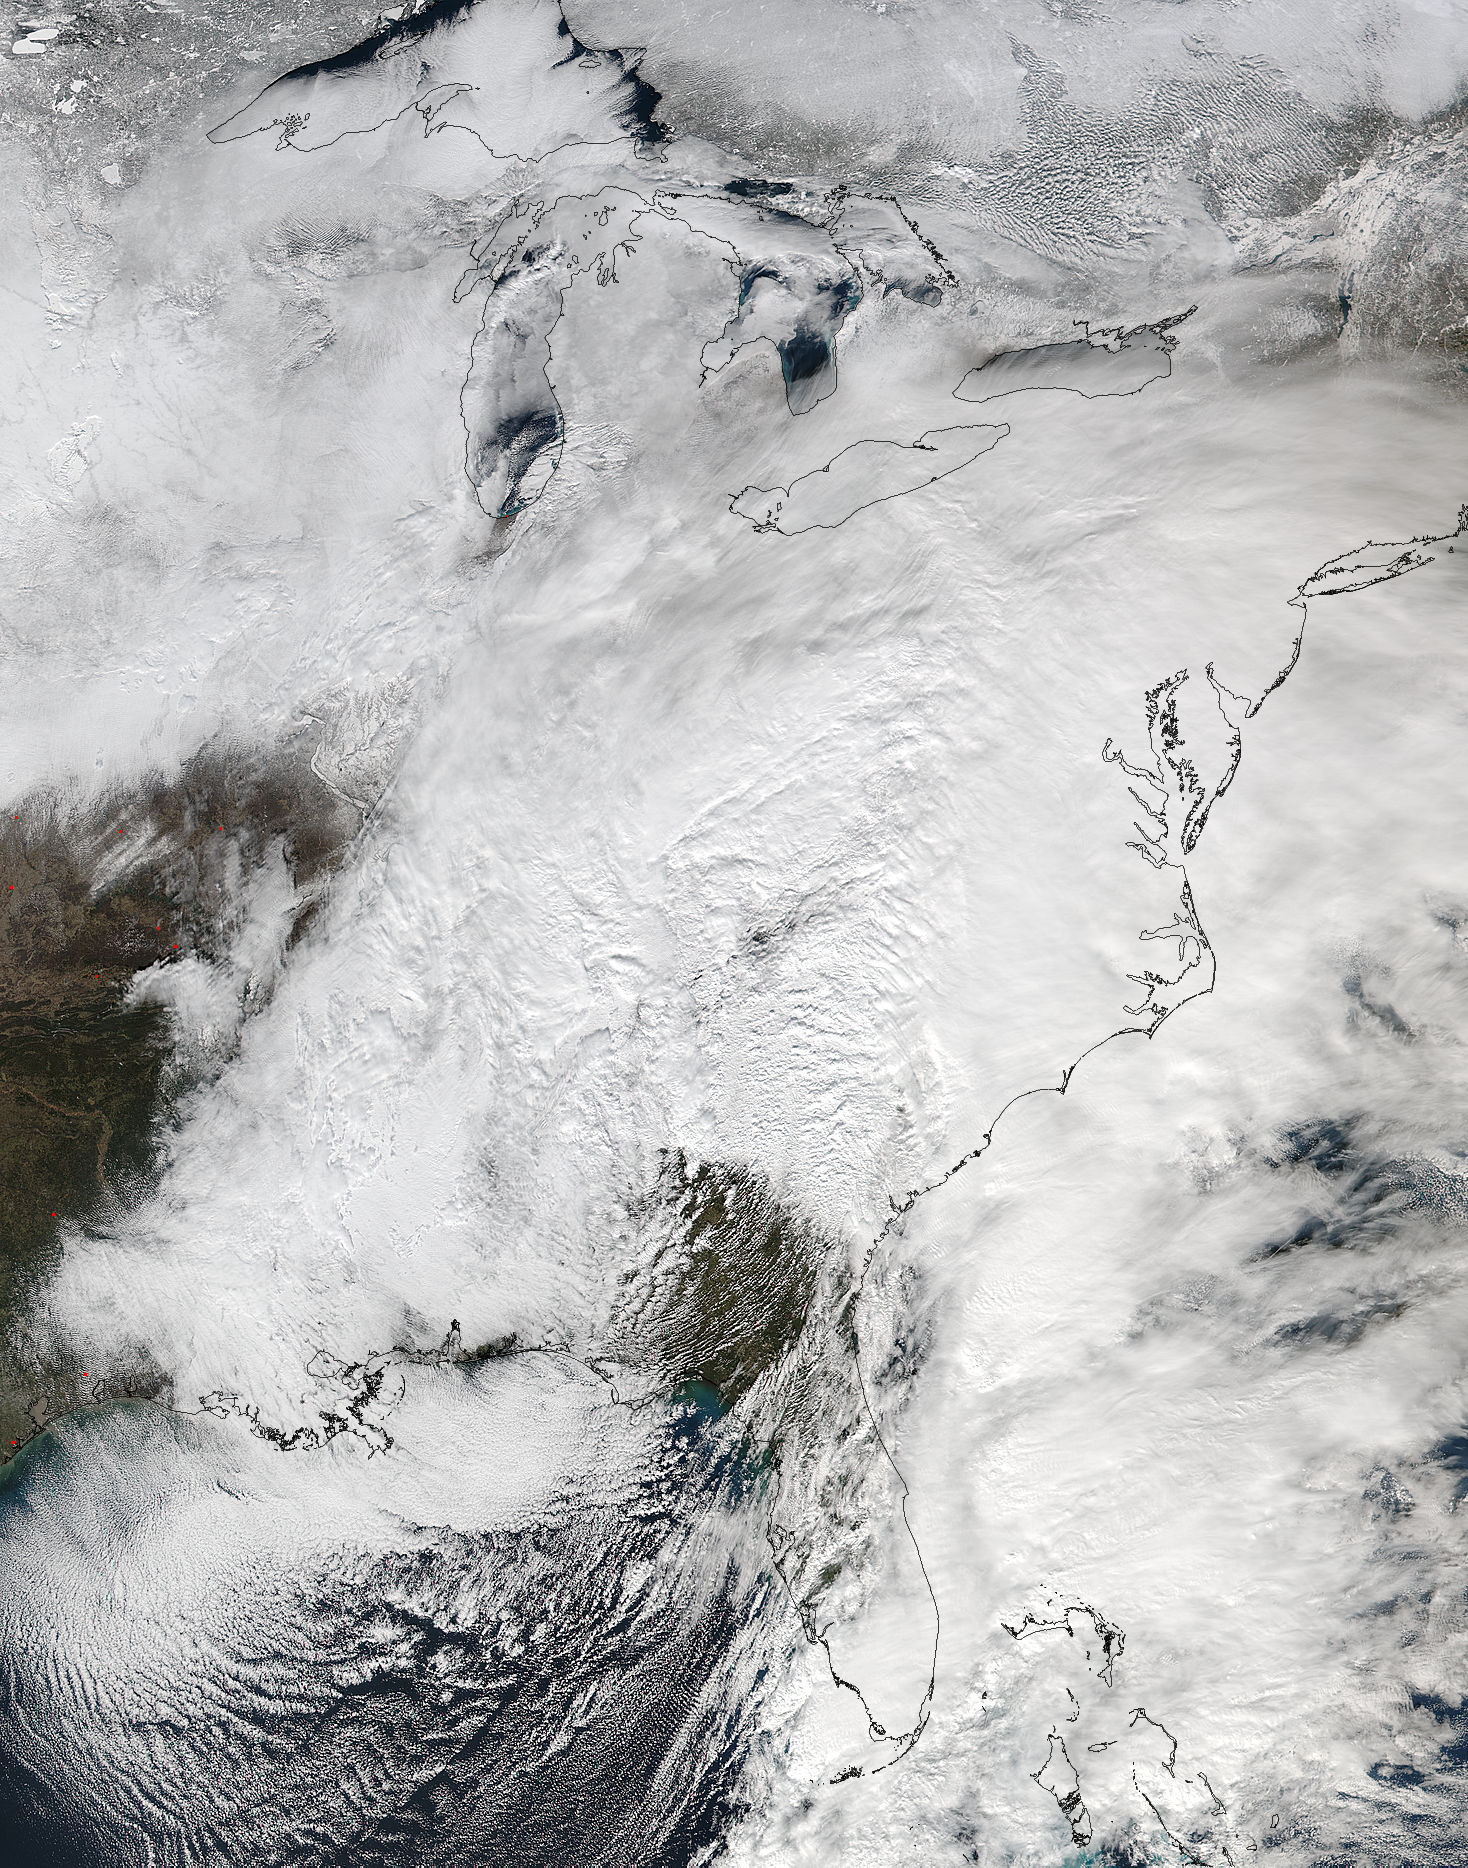
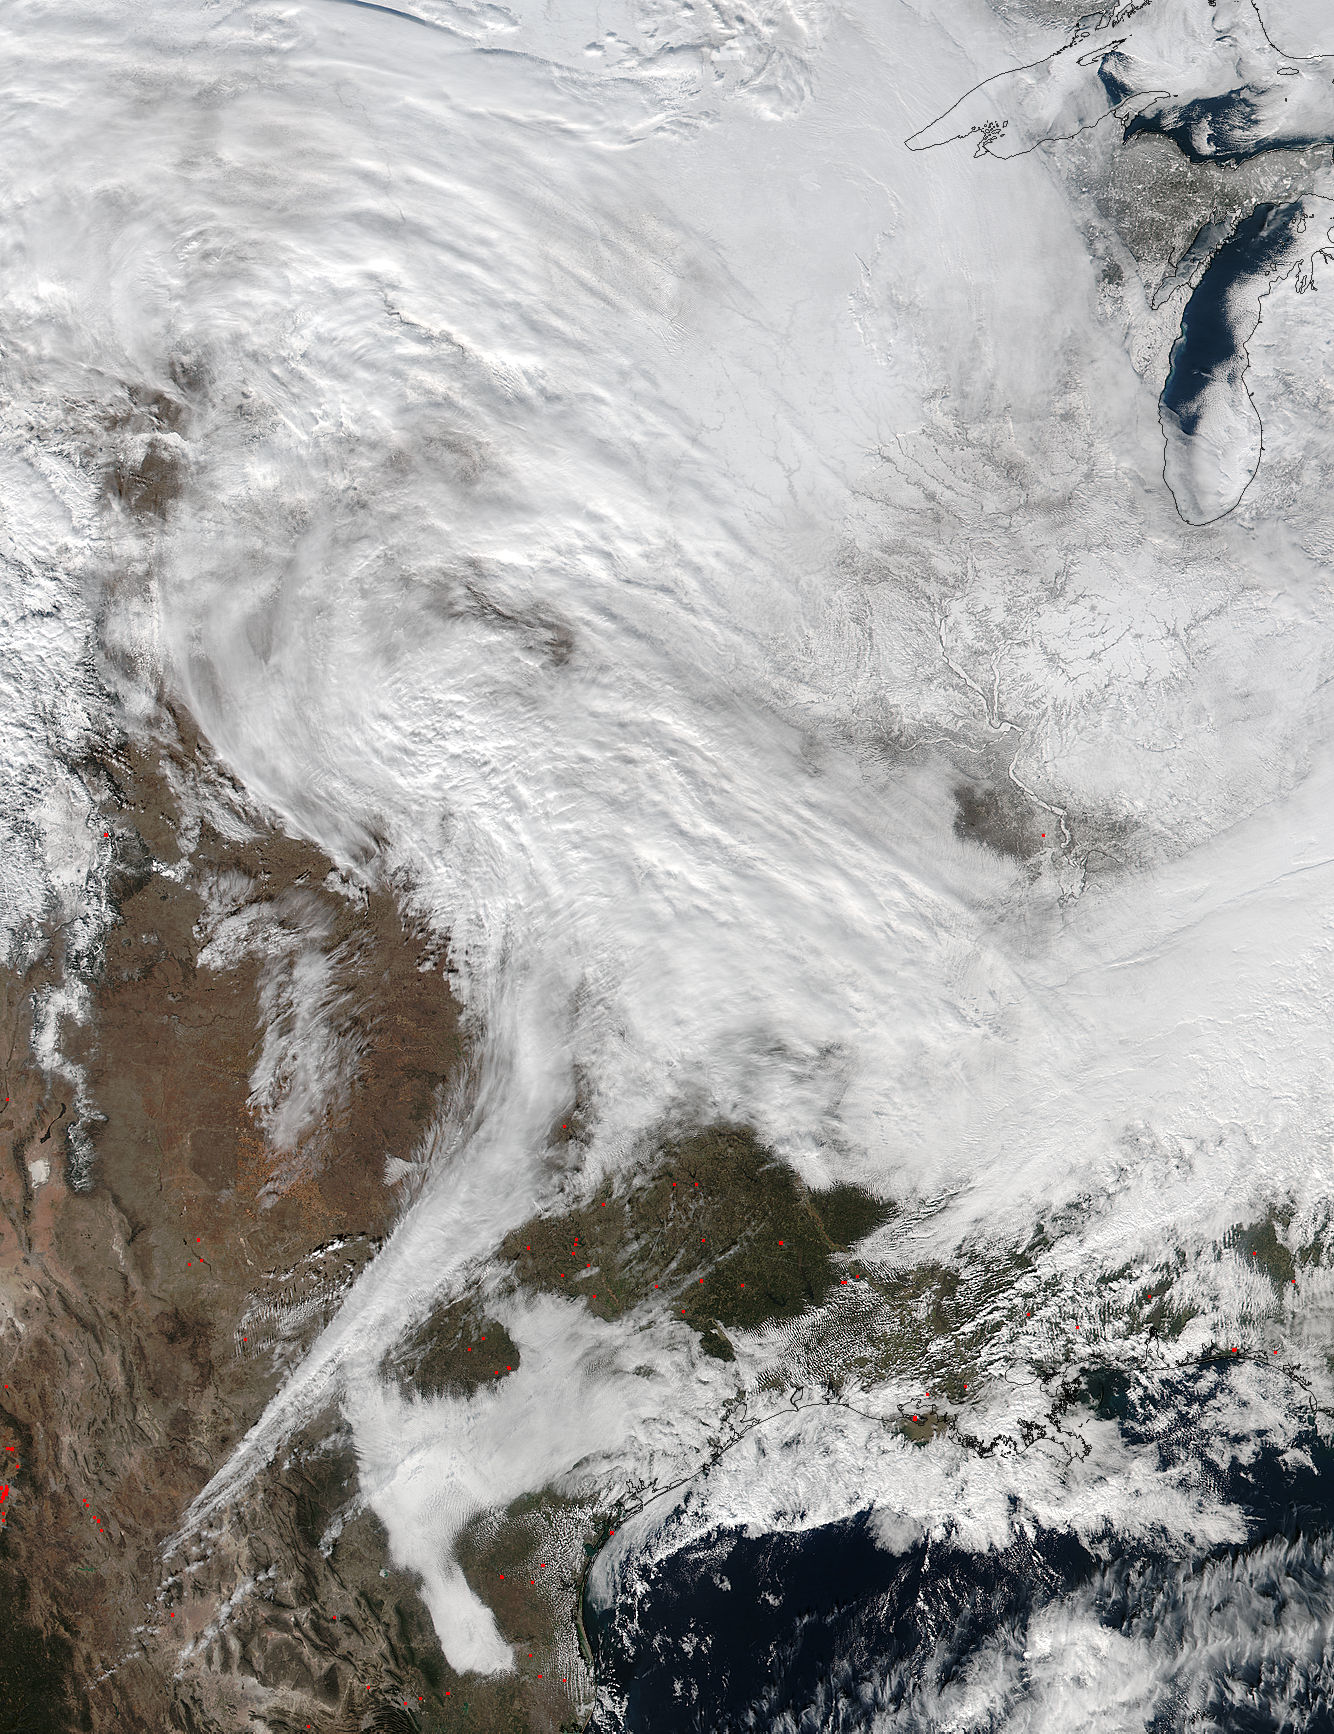
After the storm had moved off into the Atlantic Ocean, NASA’s Aqua satellite passed over the eastern U.S. The Moderate Resolution Imaging Spectroradiometer or MODIS instrument aboard captured a visible-light image on Jan. 24 at 1830 UTC (1:30 p.m. EST) that showed a blanket of snow on the ground stretching from southeastern Massachusetts to southeastern Missouri.
The Operational Land Imager (OLI) on Landsat 8 captured a natural-color image of Virginia, Maryland, and Washington, D.C. on January 24, 2016. Most neighborhoods in the image received at least 18 to 24 inches (46 to 61 centimeters) of snowfall from the nor’easter that pounded the region from January 22 to 24.

Landsat 8 (formerly the Landsat Data Continuity Mission, LDCM) is a joint mission between NASA and the U.S. Geological Survey. It is collecting valuable data and imagery to be used in agriculture, education, business, science, and government. The Landsat Program provides repetitive acquisition of high resolution multispectral data of the Earth’s surface on a global basis.
For NASA coverage of this historic storm, visit: https://www.nasa.gov/feature/goddard/2016/nasa-sees-major-winter-storm-headed-for-eastern-us
Update #7 – Jan. 24, 2016 – 10:33 AM EST
NASA Sees Dawn and Records Breaking as Major Winter Storm Departs
NASA and NOAA gathered night-time and daytime views of the Blizzard of 2016 from the Suomi NPP and the GOES-East satellites. NASA’s GPM satellite provided a look at the moisture wrapping into the storm from the Atlantic Ocean. The 2016 blizzard occurred just 4 days before 2015’s major northeast blizzard.
GPM’s 3-D View of Storm’s Moisture From the Atlantic Ocean
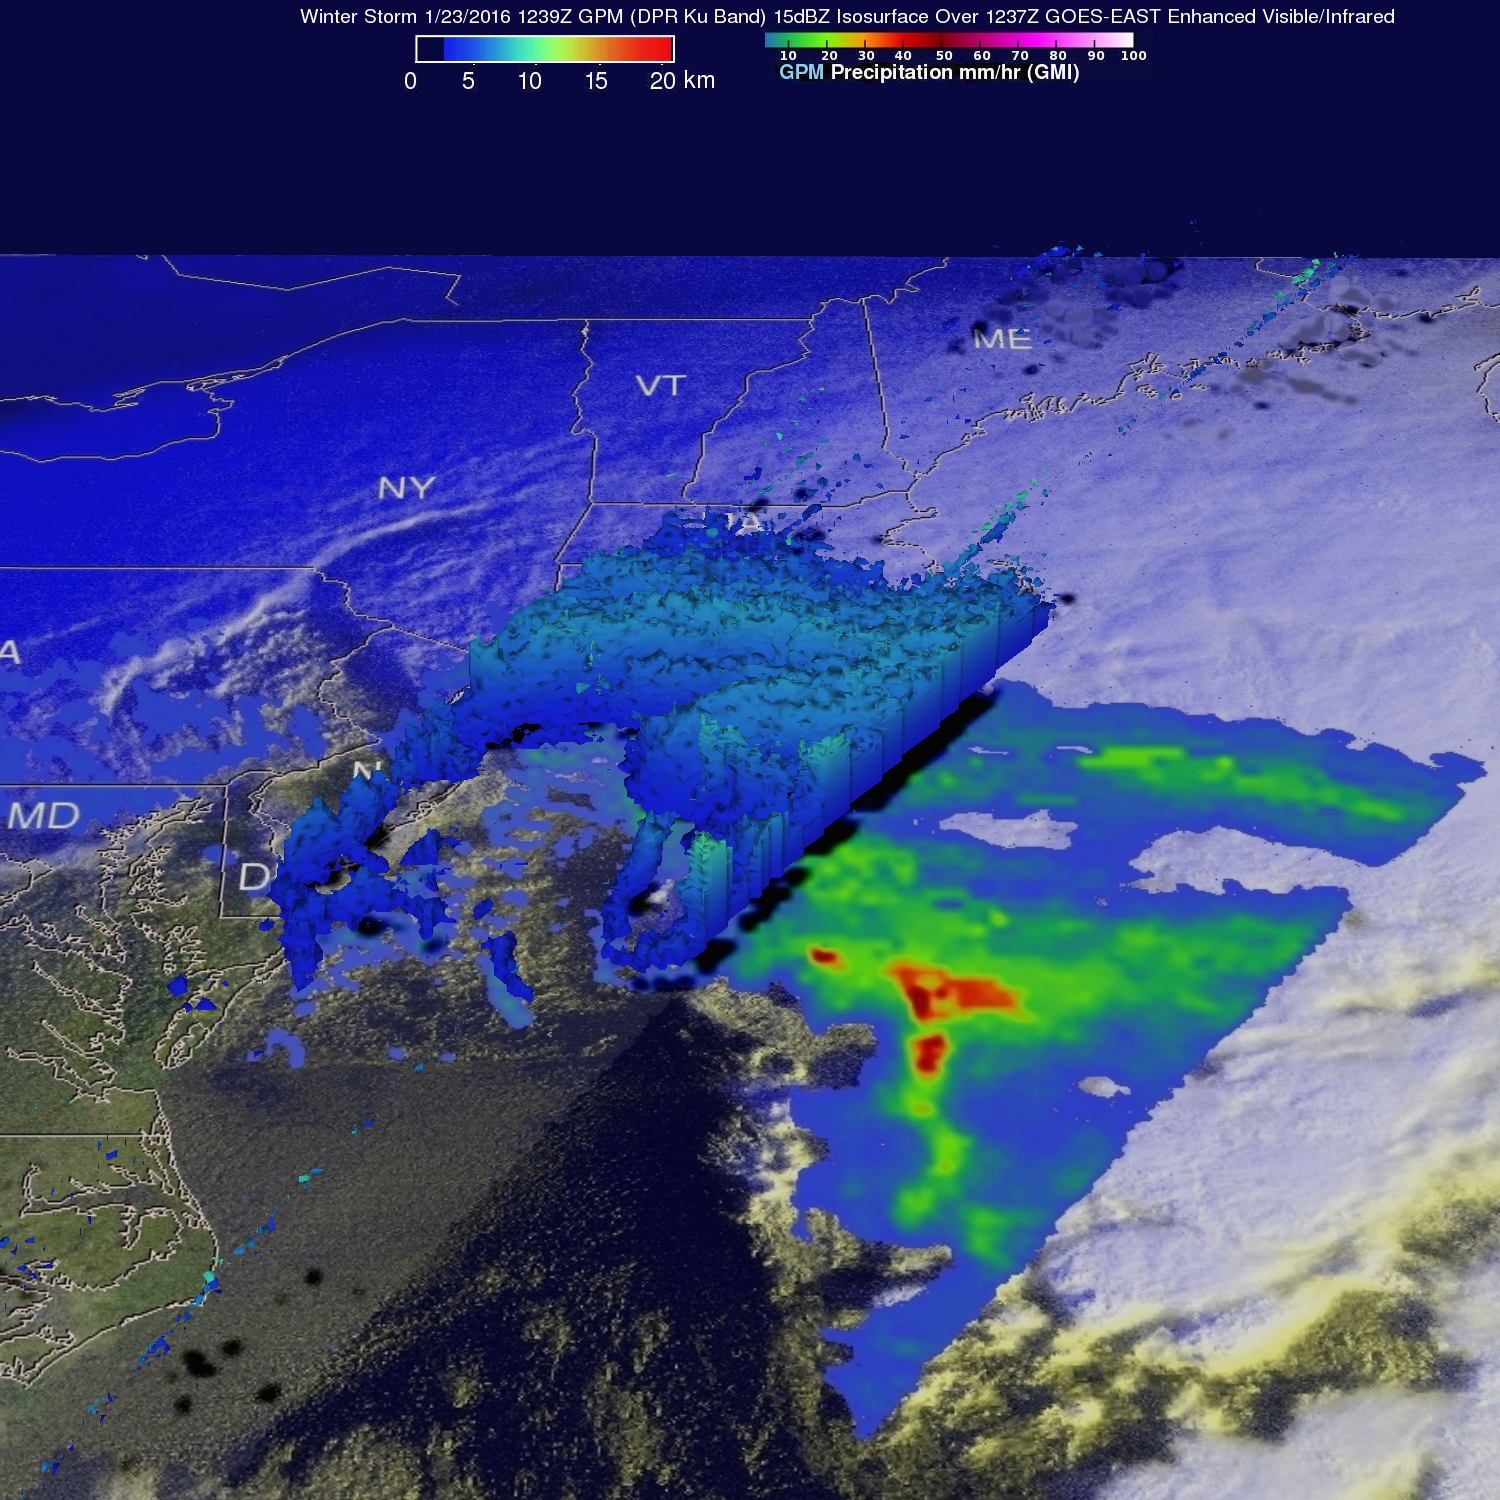
On January 23, 2016 at 1239 UTC (7:39 a.m. EST) NASA and the Japan Aerospace Exploration Agency’s Global Precipitation Measurement (GPM) core observatory passed above the deadly winter storm that was burying the Northeast under a deep layer of snow. As GPM passed above, it observed a band of snow approaching the island of Manhattan. GPM’s Microwave Imager (GMI) and Dual-frequency Precipitation Radar (DPR) instruments showed massive amounts of moisture being transported from the Atlantic Ocean over states from New York westward through West Virginia. GPM’s Radar instruments provided 3-D data (DPR Ku Band) showing the 3-D structure of rainfall within bands of precipitation in the winter storm.
A Night-time View by Satellite
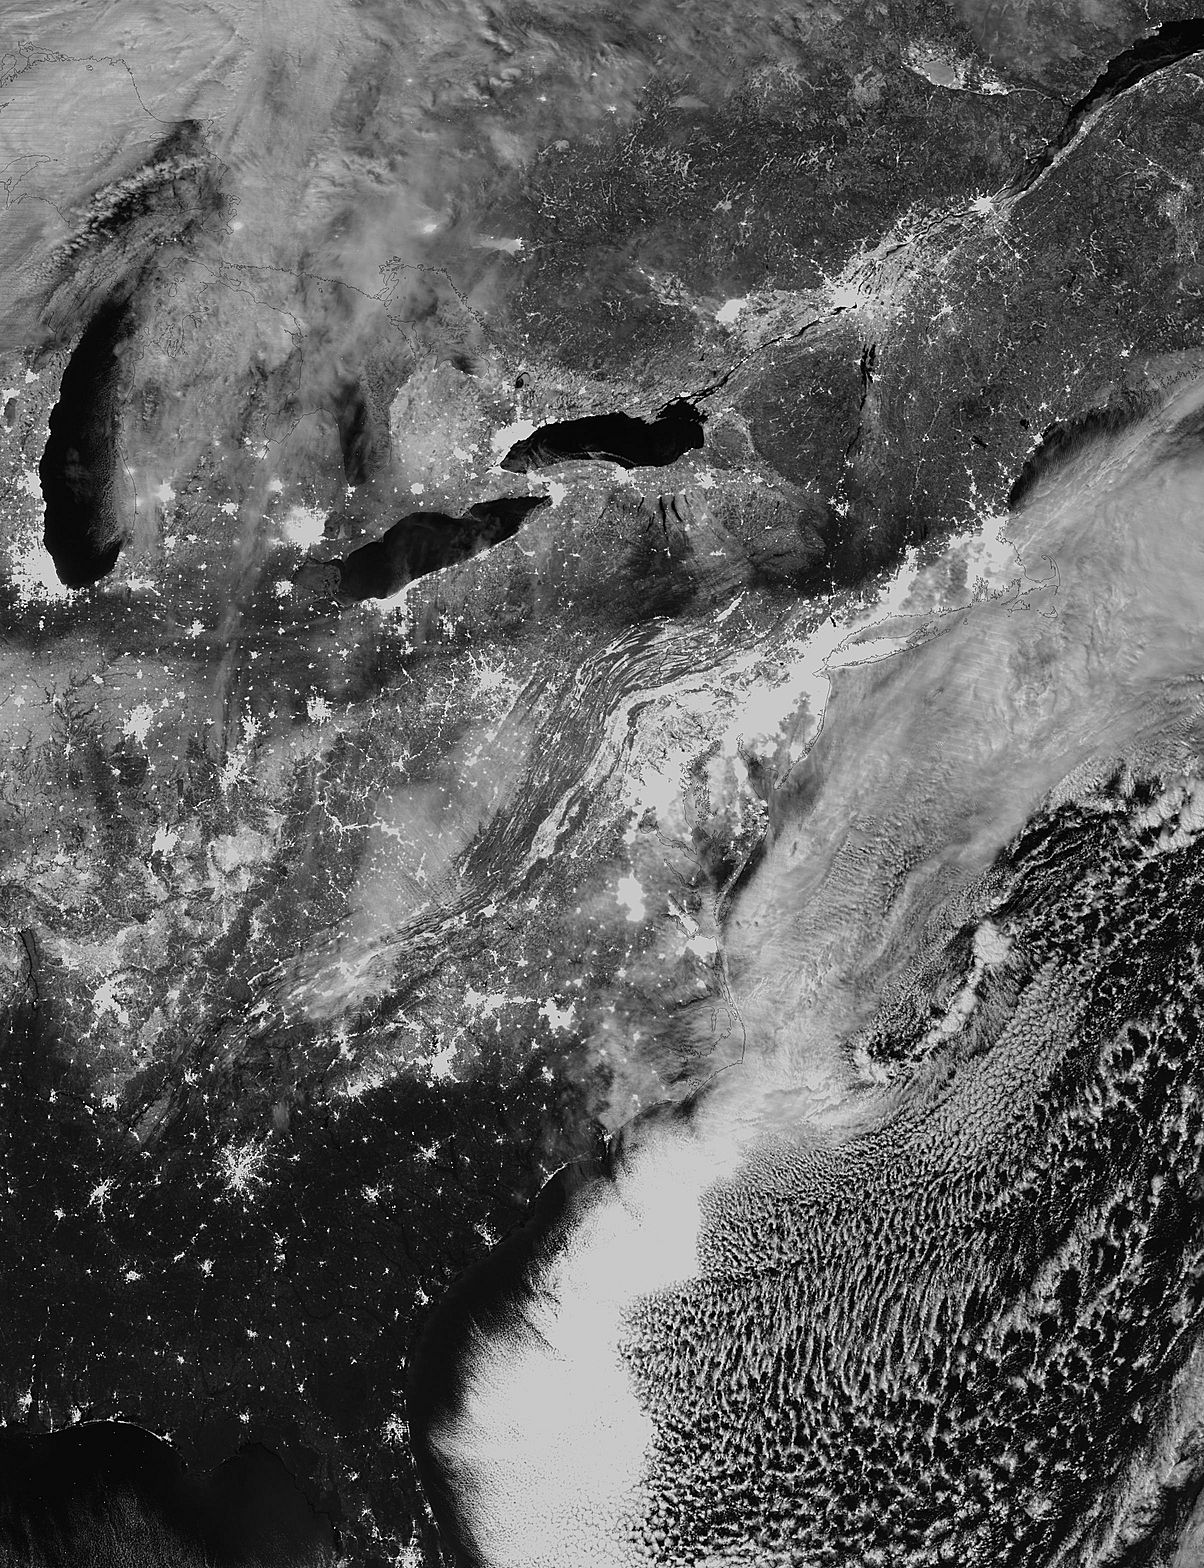
A combination of the day-night band and high resolution infrared imagery from the NASA-NOAA’s Suomi NPP satellite showed the historic blizzard as it moved north of the Mid-Atlantic and over the New York Metropolitan area and southern New England at 06:55 UTC (1:55 a.m. EST) on January 24, 2016. The nighttime lights of the region were blurred by the high cloud tops associated with the storm.
On Sunday, January 24, 2016 at 3:55 a.m. EST NOAA’s National Weather Service Weather Prediction Center in College Park, Maryland said “Snow is tapering off over the Mid-Atlantic and Northeast as the winter storm system tracks further offshore. This system dumped copious amounts of snow over West Virginia, Virginia, Washington D.C., Maryland, Pennsylvania, New Jersey and New York. A few locations came close to, or surpassed all-time 1-day and 2-day snow records. Accumulations of 2 to 3 feet were common, with a few isolated areas in the West Virginia and Maryland panhandles measuring 3.5 feet.”
Snowfall Records Broken in Mid-Atlantic
This storm set quite a number of snowfall records in the Mid-Atlantic north to New York City on January 23, 2016. In the Baltimore/Washington metro area, all three airports recorded record snowfall according to NOAA’s National Weather Service.
A record snowfall of 11.3 inches was set at Washington Reagan National airport. This breaks the old record of 11.0 set in 1935. A record snowfall of 25.5 inches was set at Baltimore BWI Thurgood Marshall airport. This breaks the old record of 11.5 set in 1935. A record snowfall for the day of 22.1 inches was set at Washington Dulles airport yesterday. This breaks the old record of 1.7 set in 1982.
Snowfall records also fell from Richmond, Virginia to Harrisburg, Pennsylvania. The NWS noted that a record snowfall of 5.3 inches was set at Richmond, Virginia. This breaks the old record of 2.7 inches set back in 1908. In central Pennsylvania, snow totals were much higher. A record daily snowfall of 26.4 inches was set at Harrisburg. This breaks the old record of 9.5 inches set on January 23 in 1982. A continuous weather record has been kept at Harrisburg since 1888.
Snowfall Records Fall in the Northeast
Newark, New Jersey, Central Park in New York City and Connecticut also reported record-breaking snowfall on January 23.
A record snowfall of 27.5 inches was set at Newark, New Jersey. This breaks the old record of 4.5 set in 2005.
According to the National Weather Service, Central Park received the second greatest storm total snowfall set and the greatest daily snowfall record. Storm total snowfall for the current snowstorm at midnight was at 26.8 inches. This is only 0.1 inch shy of the all-time record storm total snowfall of 26.9 inches…set during the snowstorm of February 11-12 2006. A record all time daily snowfall record snowfall of 26.6 has also been set at the park. The previous record was 24.1 inches…set on Feb 12 2006.
To the northeast in Connecticut, a record snowfall of 12 inches was set at Bridgeport. This breaks the old record of 7.1 set in 1965.
In Westerly, Rhode Island, 10.5 inches of snow were reported and East Harwich, Massachusetts on Cape Cod reported 15.5 inches.
A Daytime Satellite View on January 24, 2016
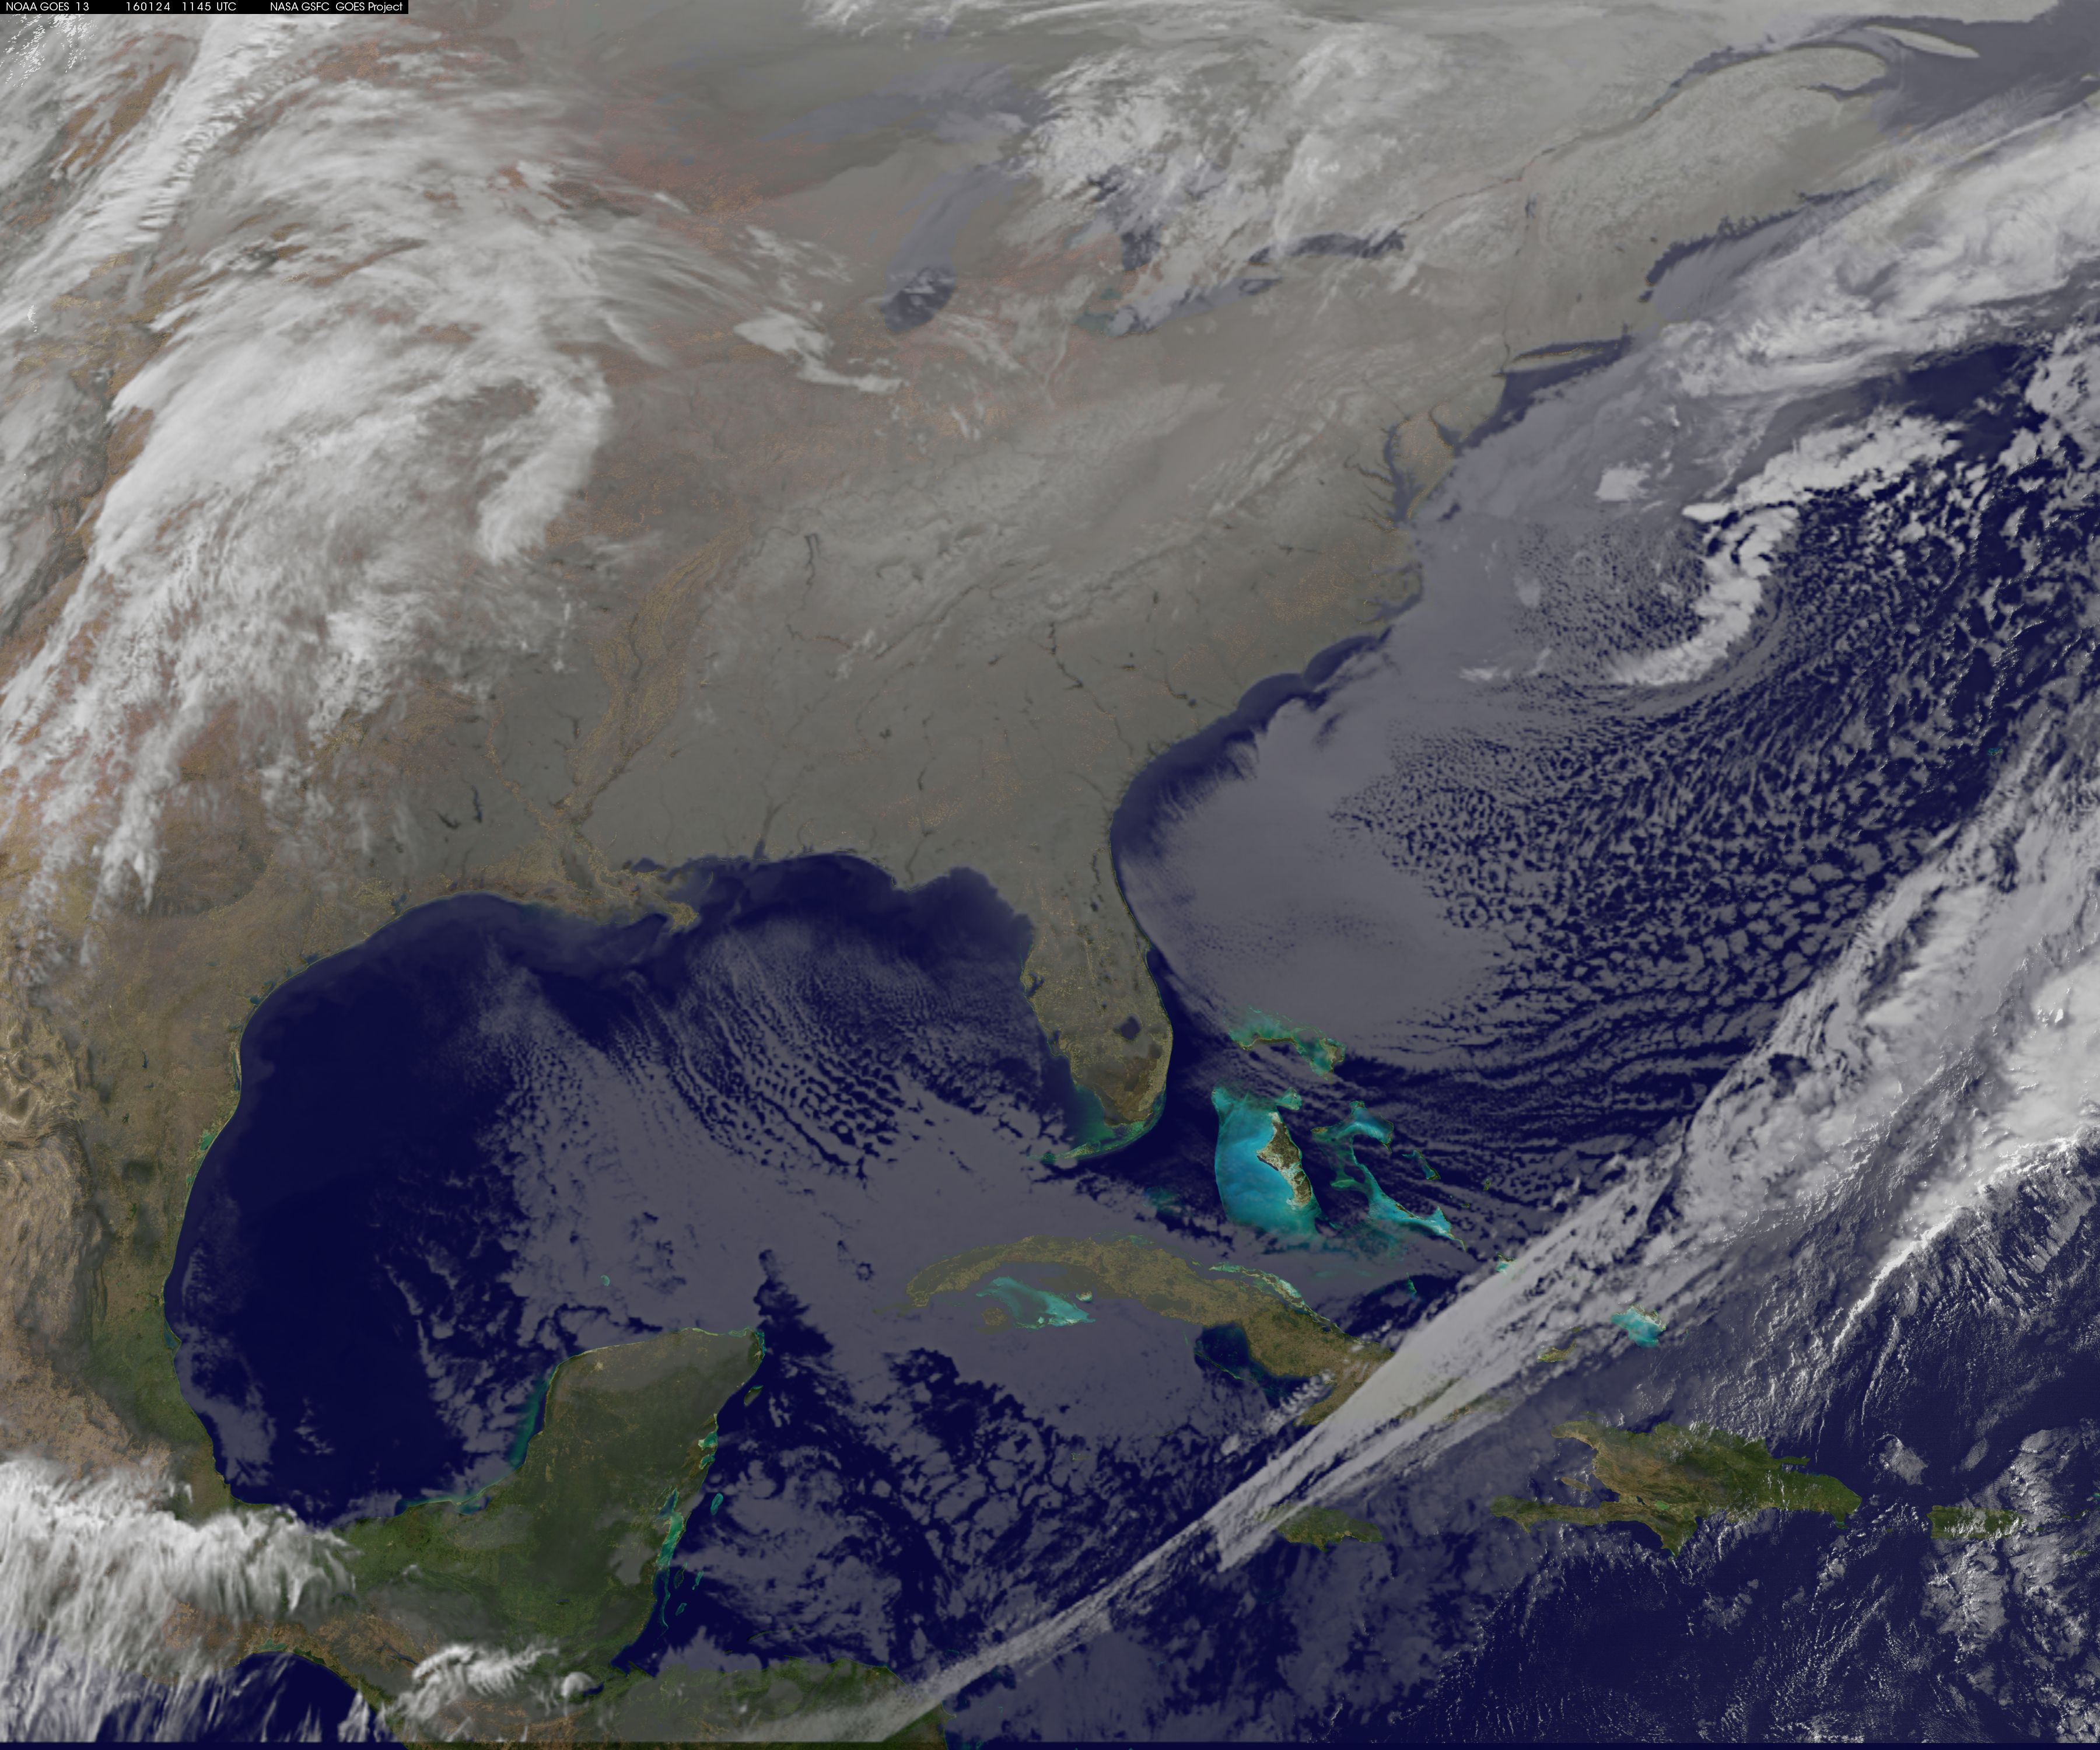
As residents from the Mid-Atlantic to the northeastern U.S. were waking up to daylight and the record-setting snowfall at 11:45 UTC (6:45 a.m. EST) on January 24, 2016, NOAA’s Geostationary Operational Environmental or GOES-East satellite showed the system centered over the North Atlantic Ocean just east of Cape Cod, Massachusetts.
The image was created by the NASA/NOAA GOES Project at NASA’s Goddard Space Flight Center in Greenbelt, Maryland.
GOES satellites provide the kind of continuous monitoring necessary for intensive data analysis. Geostationary describes an orbit in which a satellite is always in the same position with respect to the rotating Earth. This allows GOES to hover continuously over one position on Earth’s surface, appearing stationary. As a result, GOES provide a constant vigil for the atmospheric “triggers” for severe weather conditions such as tornadoes, flash floods, hail storms and hurricanes.
One Year Ago: An Historic Northeastern U.S. Blizzard
Back in 2015, NASA and NOAA satellites were covering another blizzard that happened within the same week. On Jan. 27, 2015 the National Weather Service noted “the powerful nor’easter that brought moderate to heavy snowfall and blizzard conditions to the Northeast on Monday will continue to affect the region on Tuesday, with heavy snow and blizzard conditions expected from eastern Long Island to Maine as the system slowly moves to the northeast.”
Over the last two years, the last week of January has brought two record-setting storms and NASA and NOAA satellites continue to provide valuable data to forecasters.
For updated information about the storm system, visit NOAA’s NWS website: www.weather.gov
For more information about GOES satellites, visit: www.goes.noaa.gov/ or goes.gsfc.nasa.gov/
For more information about Suomi NPP, visit: http://www.jpss.noaa.gov and http://npp.gsfc.nasa.gov/
For information about the January 2015 storm, visit: https://www.nasa.gov/content/goddard/nasa-and-noaas-nighttime-and-daytime-views-of-the-blizzard-of-2015
Update #6 – Jan. 23, 2016 – 11:14 a.m. EST
Storm Views from the International Space Station
The morning of Jan. 23, International Space Station Commander Scott Kelly tweeted these photographs of the eastern U.S. snowstorm.
Update #5 – January 23, 2016 – 10:50 AM Eastern Standard Time
NASA Sees Winter Storm Slamming Eastern United States
NASA satellite imagery captured the size of the massive winter storm that continued to pummel the U.S. East Coast early on January 23, 2016.
NASA-NOAA’s Suomi NPP satellite passed over the large low pressure area on January 22 at 1855 UTC (1:55 p.m. EST) and the VIIRS instrument captured an image of the massive storm that stretched from New England south to Florida. At the time of the image, the low pressure center was in the southeastern U.S. and has since moved northeast and off the coast of the Carolinas as the storm continued to intensify and bring heavy snow and blizzard conditions to the Baltimore/Washington area. By 1200 UTC (7 a.m. EST) the low pressure center was over the Delmarva Peninsula (Delaware/Maryland/Virginia).
At 5:56 a.m. EST on Jan. 23, the National Weather Service (NWS) Weather Prediction Center in College Park, Maryland issued their short range forecast discussion with the title “Major to historic winter storm will impact the middle Atlantic to southern New England into Sunday.”
NWS said “A powerful low pressure system will bring heavy snow and blizzard conditions from the Middle Atlantic Region all the way through southern New England. The heaviest snow is expected to fall over the Middle Atlantic Region including the Washington DC and Baltimore metro areas west to the Blue Ridge Mountains. In addition, moderate coastal flooding is expected. The storm will taper off by Sunday.”
By 6 a.m. EST, many locations across Maryland and Washington D.C. reported accumulations already 1 foot, with more expected. An additional 8 to 15 inches is forecast along the D.C. to Long Island corridor for the duration of the storm.
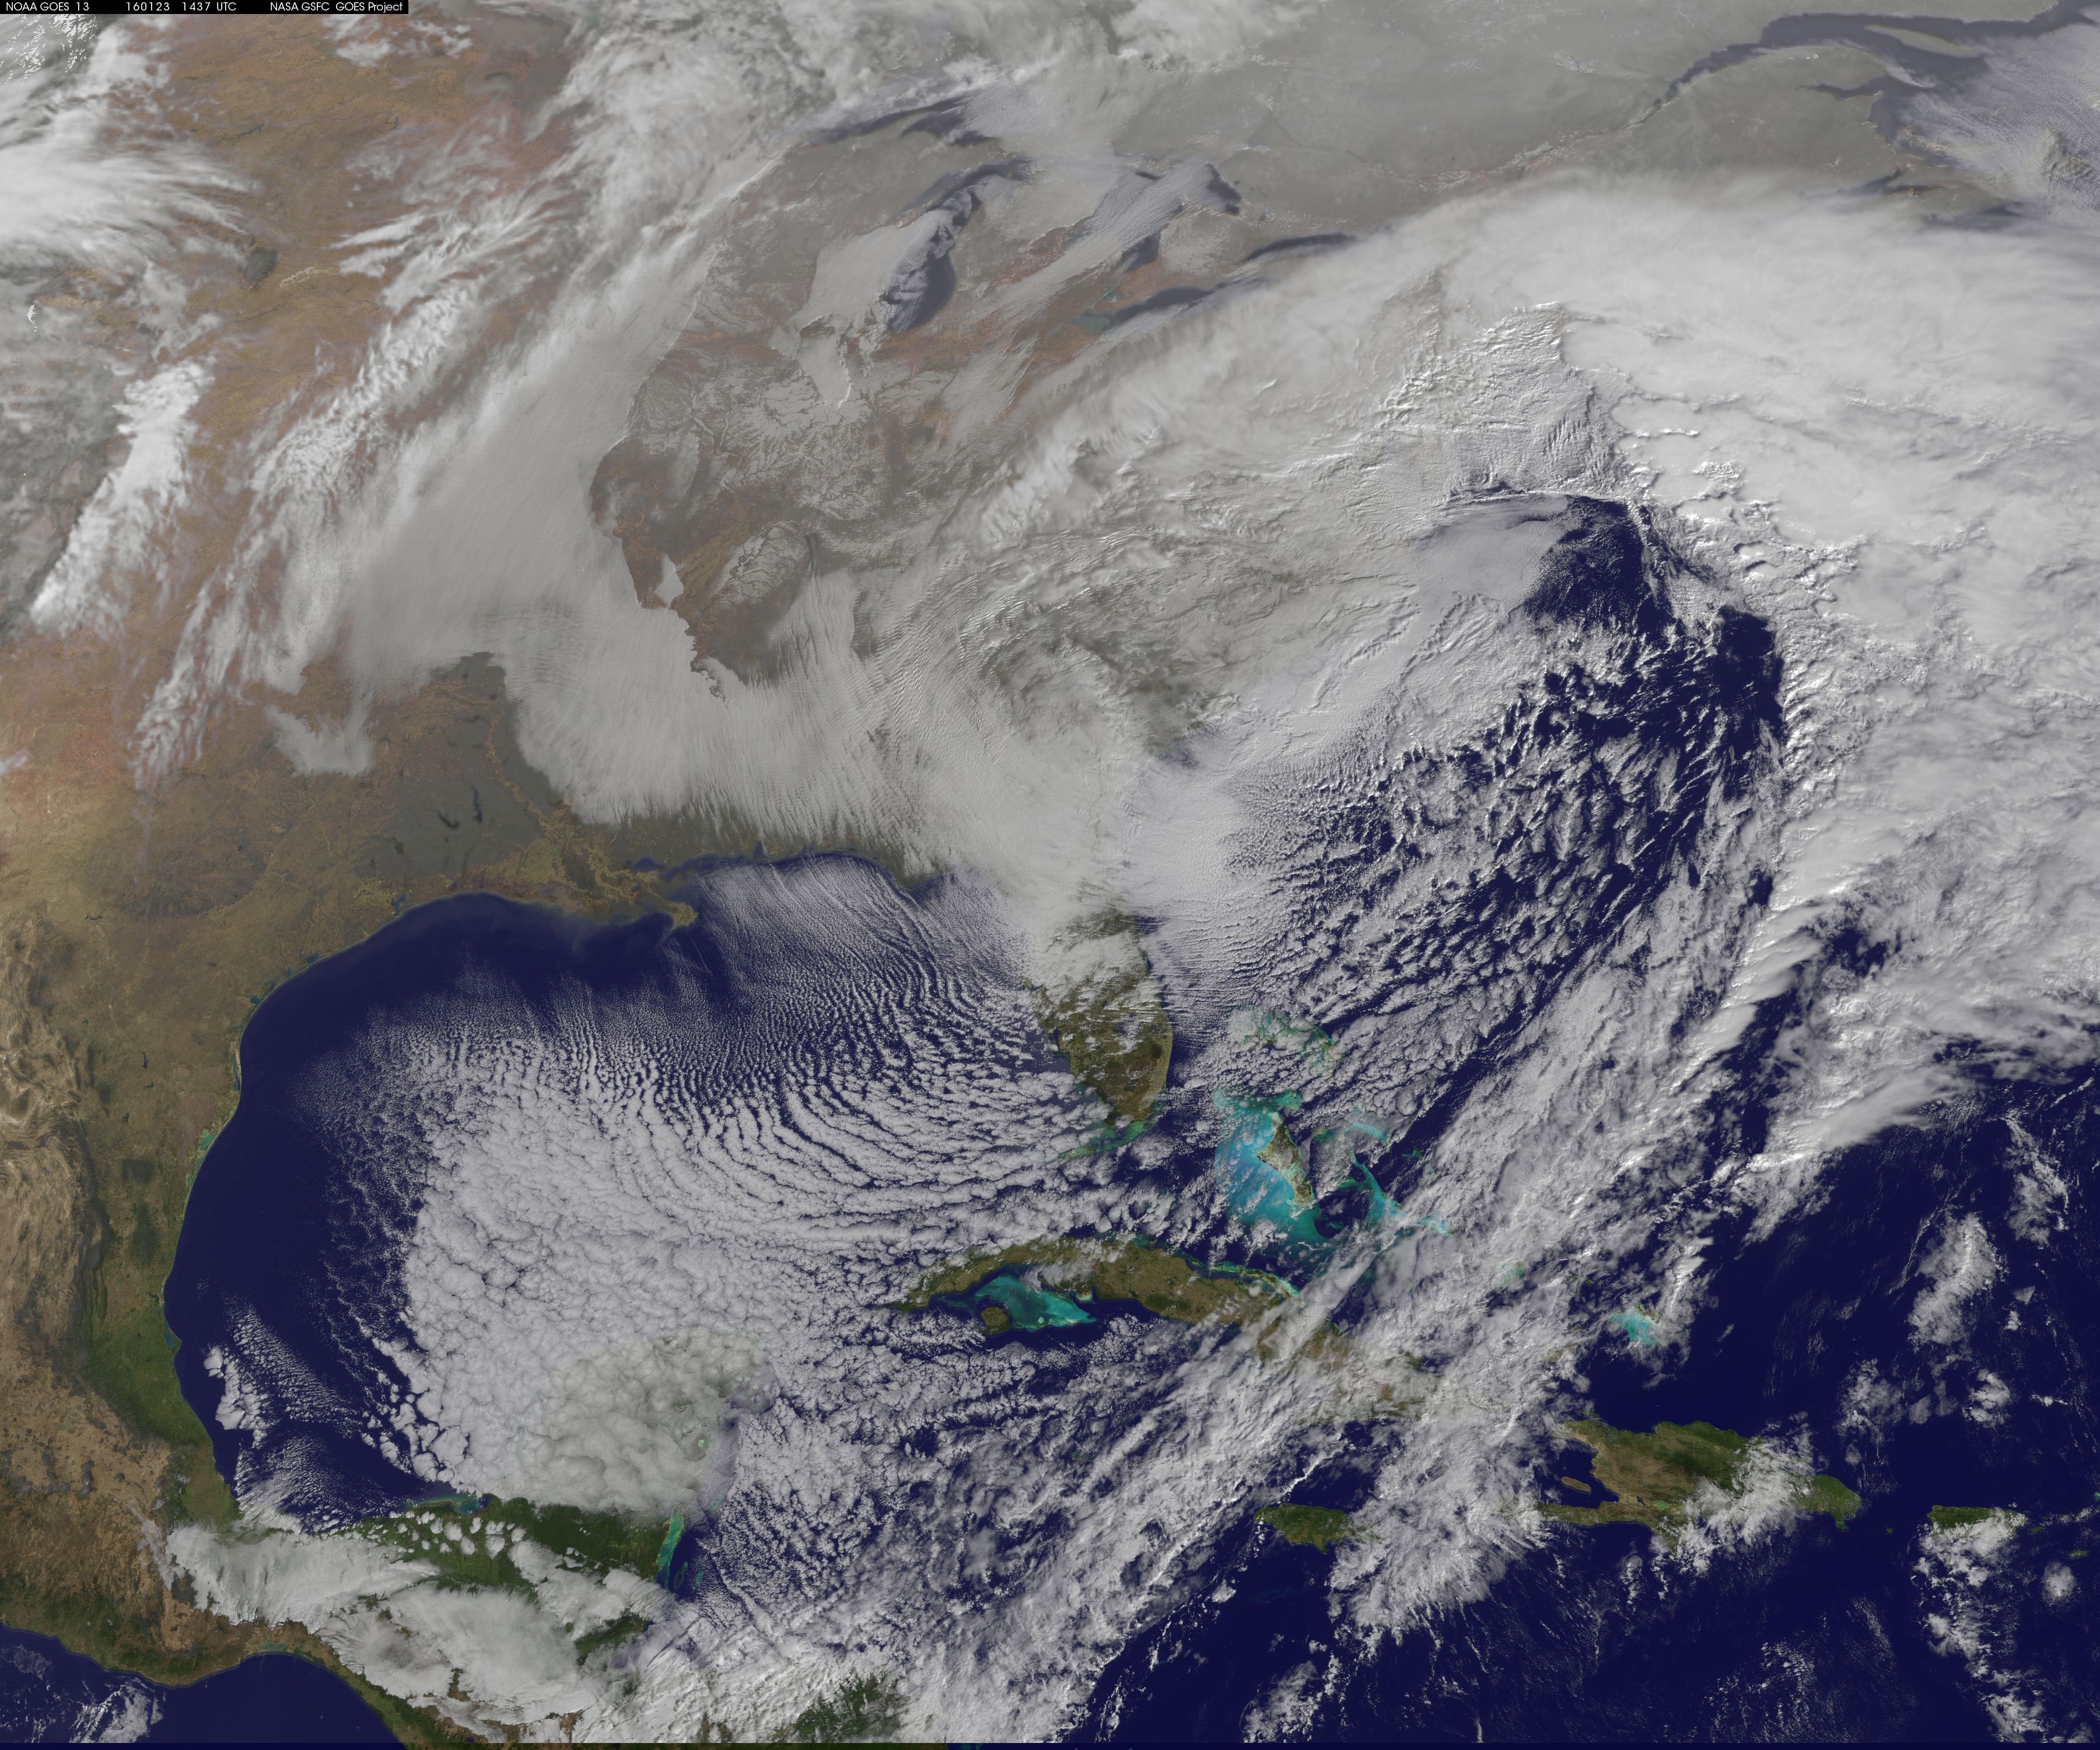
A visible image of the major winter storm was taken from NOAA’s GOES-East satellite on Saturday, January 23, 2016 at 1437 UTC (9:37 a.m. EST) as the Baltimore/Washington corridor was under a blizzard warning. Compared to the earlier image from the Suomi NPP satellite, the low pressure center had moved further northeast and was over the Delmarva Peninsula.
Although the precipitation associated with the system had departed Florida, the northern part of the state was dealing with winds and cold. On Saturday, Jan. 23 at 9 a.m. EST at Daytona Beach, Florida, a Freeze Warning was in effect until Jan. 24, 8:00 a.m. EST and a Wind Advisory was in effect until 7 p.m. EST on Jan. 23 as wind chills in the teens will be possible at night. Wind advisories stretched as far south as Miami.
Winter Storm Warnings and a handful of Blizzard Warnings remain in effect from the Southeast to the Northeast. By Sunday morning, January 24, the low pressure storm center is forecast to move further offshore into the North Atlantic Ocean. For updated forecasts from the NWS, visit: www.weather.gov.
Update #4 – January 22, 2016 – 2:24 PM Eastern Standard Time
NASA Eyes Powerful Winter Storm Spreading Into Mid-Atlantic
The winter storm that caused damage during the night along the Gulf Coast has deepened and has started to spread heavy rain, freezing rain, sleet and snow northward into the Mid-Atlantic region. NASA’s GPM and NOAA’s GOES satellites are providing data on rainfall, cloud heights, extent and movement of the storm.
The National Weather Service (NWS) Weather Prediction Center in College Park, Maryland said “An area of low pressure centered over the southeastern U.S. will continue developing into a major winter storm which will impact a large portion of the East Coast from the southern Appalachians through the Mid-Atlantic States from Friday into the weekend. Snowfall totals may exceed 2 feet in portions of these areas, including the Baltimore and Washington D.C. metropolitan areas.”
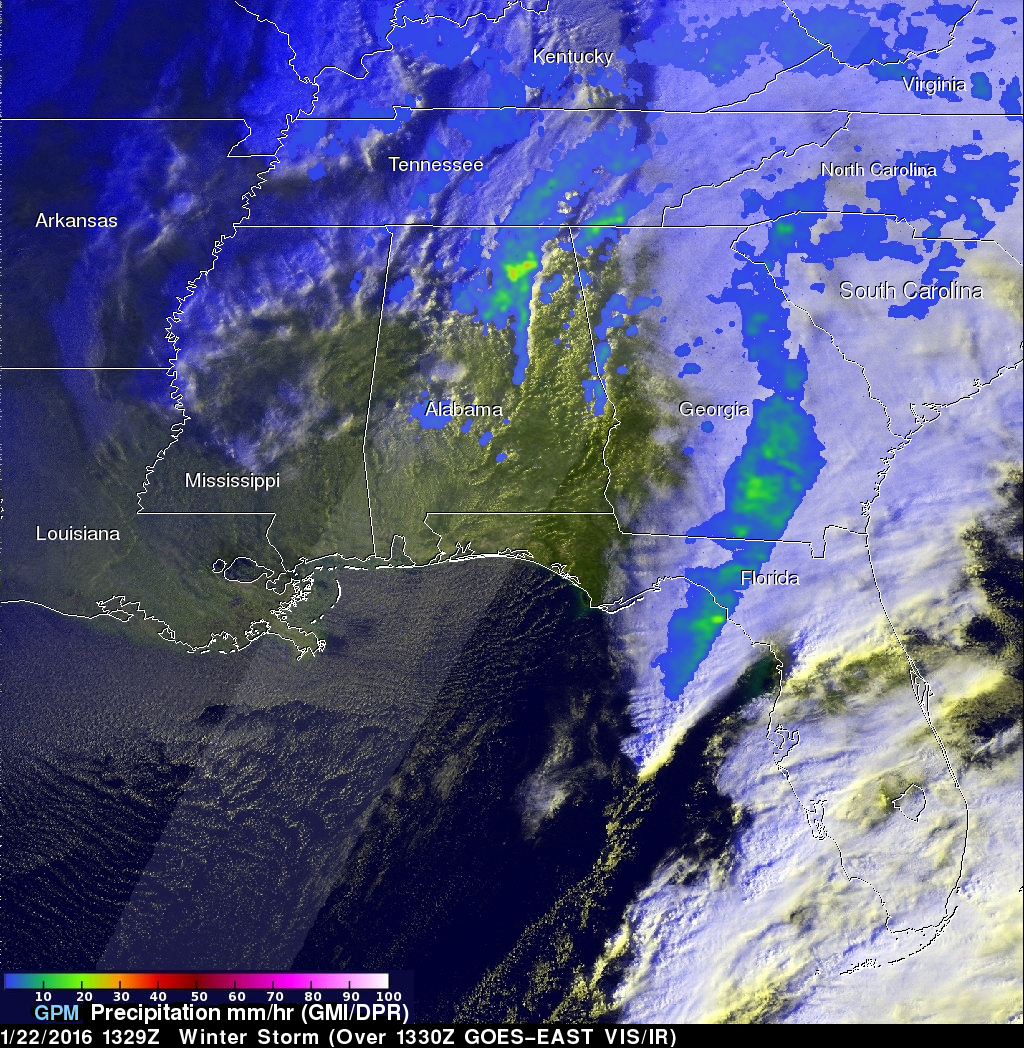
The Global Precipitation Measurement or GPM mission core satellite gathered precipitation data on the increasingly dangerous storm on January 22, 2016 at 1329 UTC (8:29 a.m. EST). A precipitation analysis was created using data collected by GPM’s Microwave Imager (GMI) and Dual-frequency Precipitation Radar (DPR) instruments. GPM’s DPR saw precipitation falling at a rate of over 64 mm (2.5 inches) per hour in storms over northern Alabama.
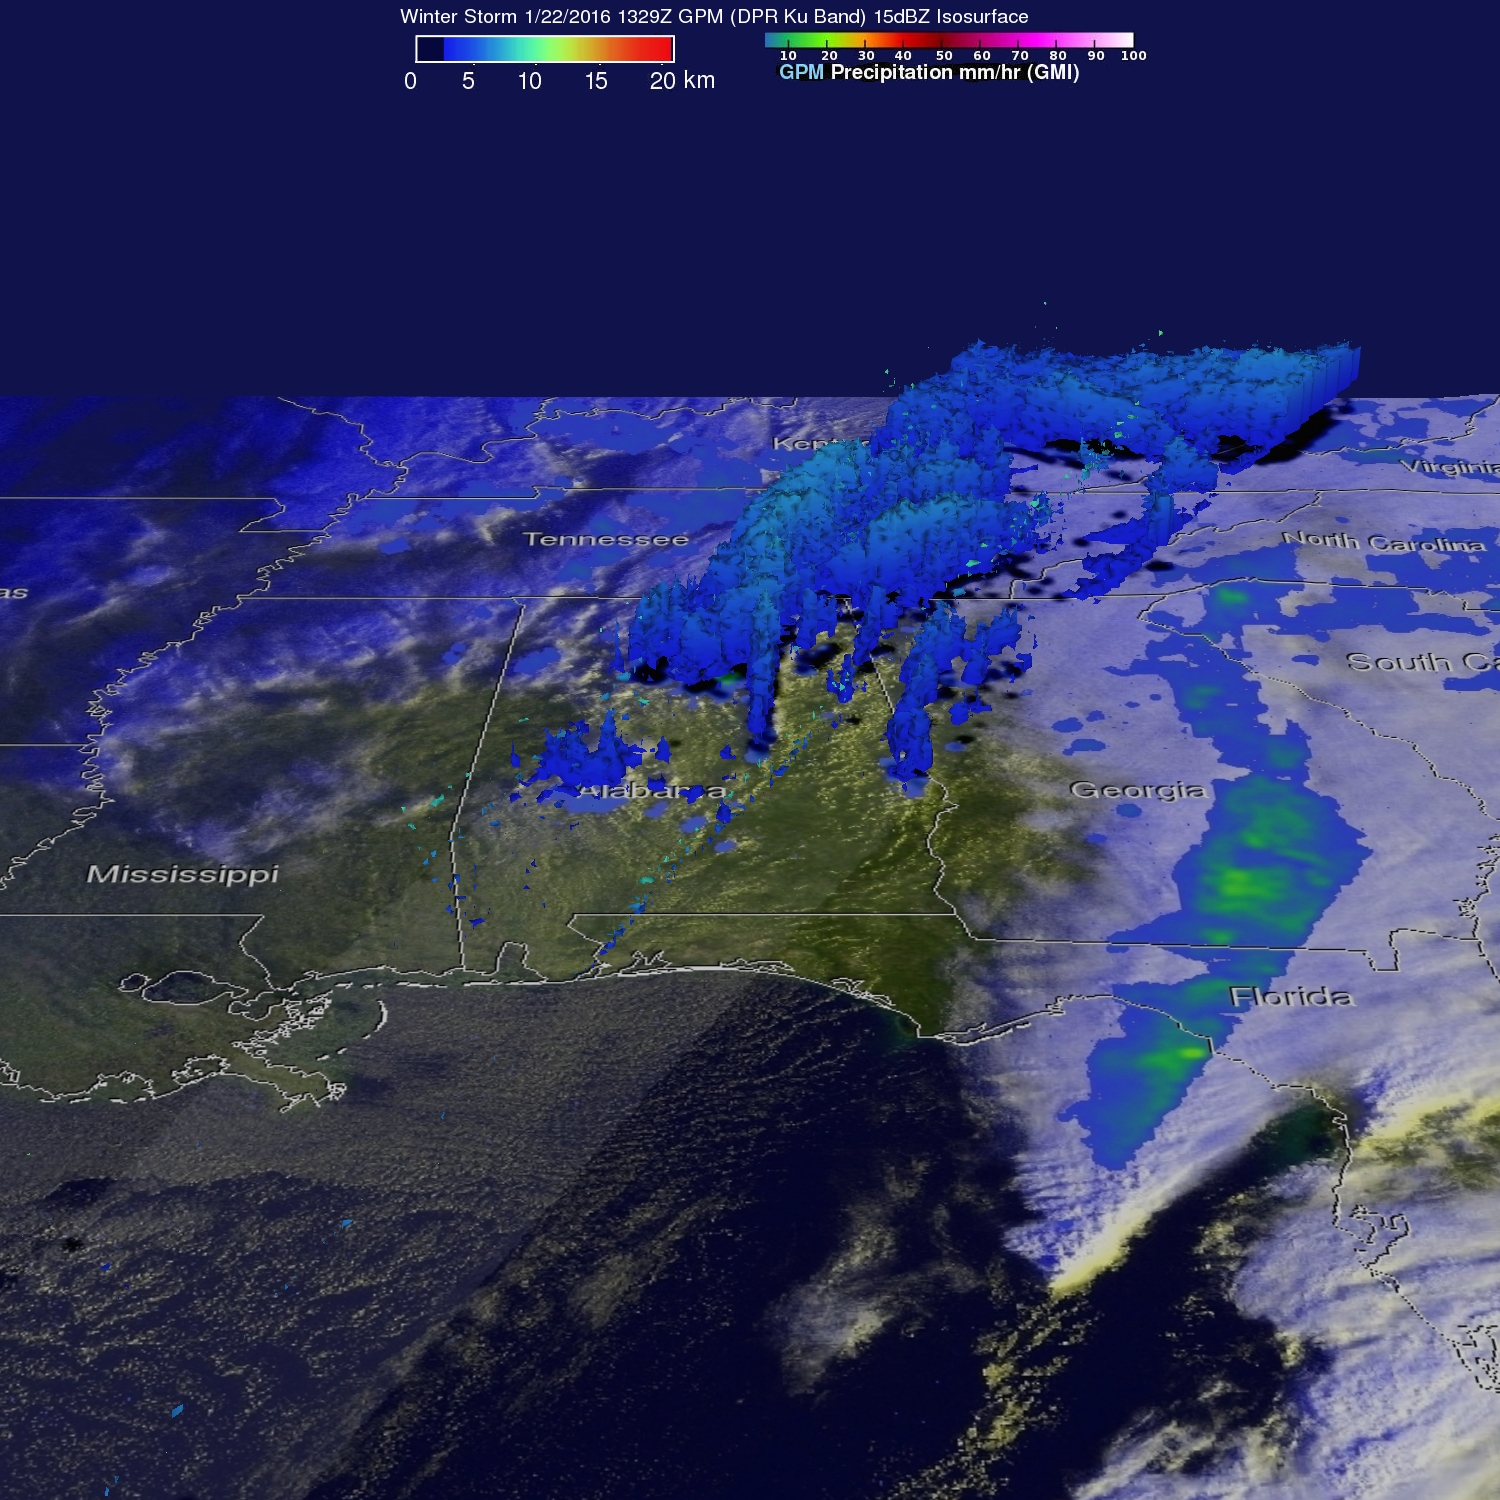
At NASA’s Goddard Space Flight Center in Greenbelt, Maryland, radar data from GPM’s DPR (Ku Band) were used to show the vertical structure of storm tops. Some of the storm tops were near 7 kilometers (4.3 miles) high along the Appalachians in eastern Tennessee and Kentucky. Higher storm cloud tops are indications that storms are likely stronger. At 3:46 a.m. EST on Jan. 22, the National Weather Service said “Areas of heavy snow are expected to develop in western Tennessee, Kentucky and in the southern Appalachians, and expand into central Appalachians and mid-Atlantic while increasing snowfall intensity.”
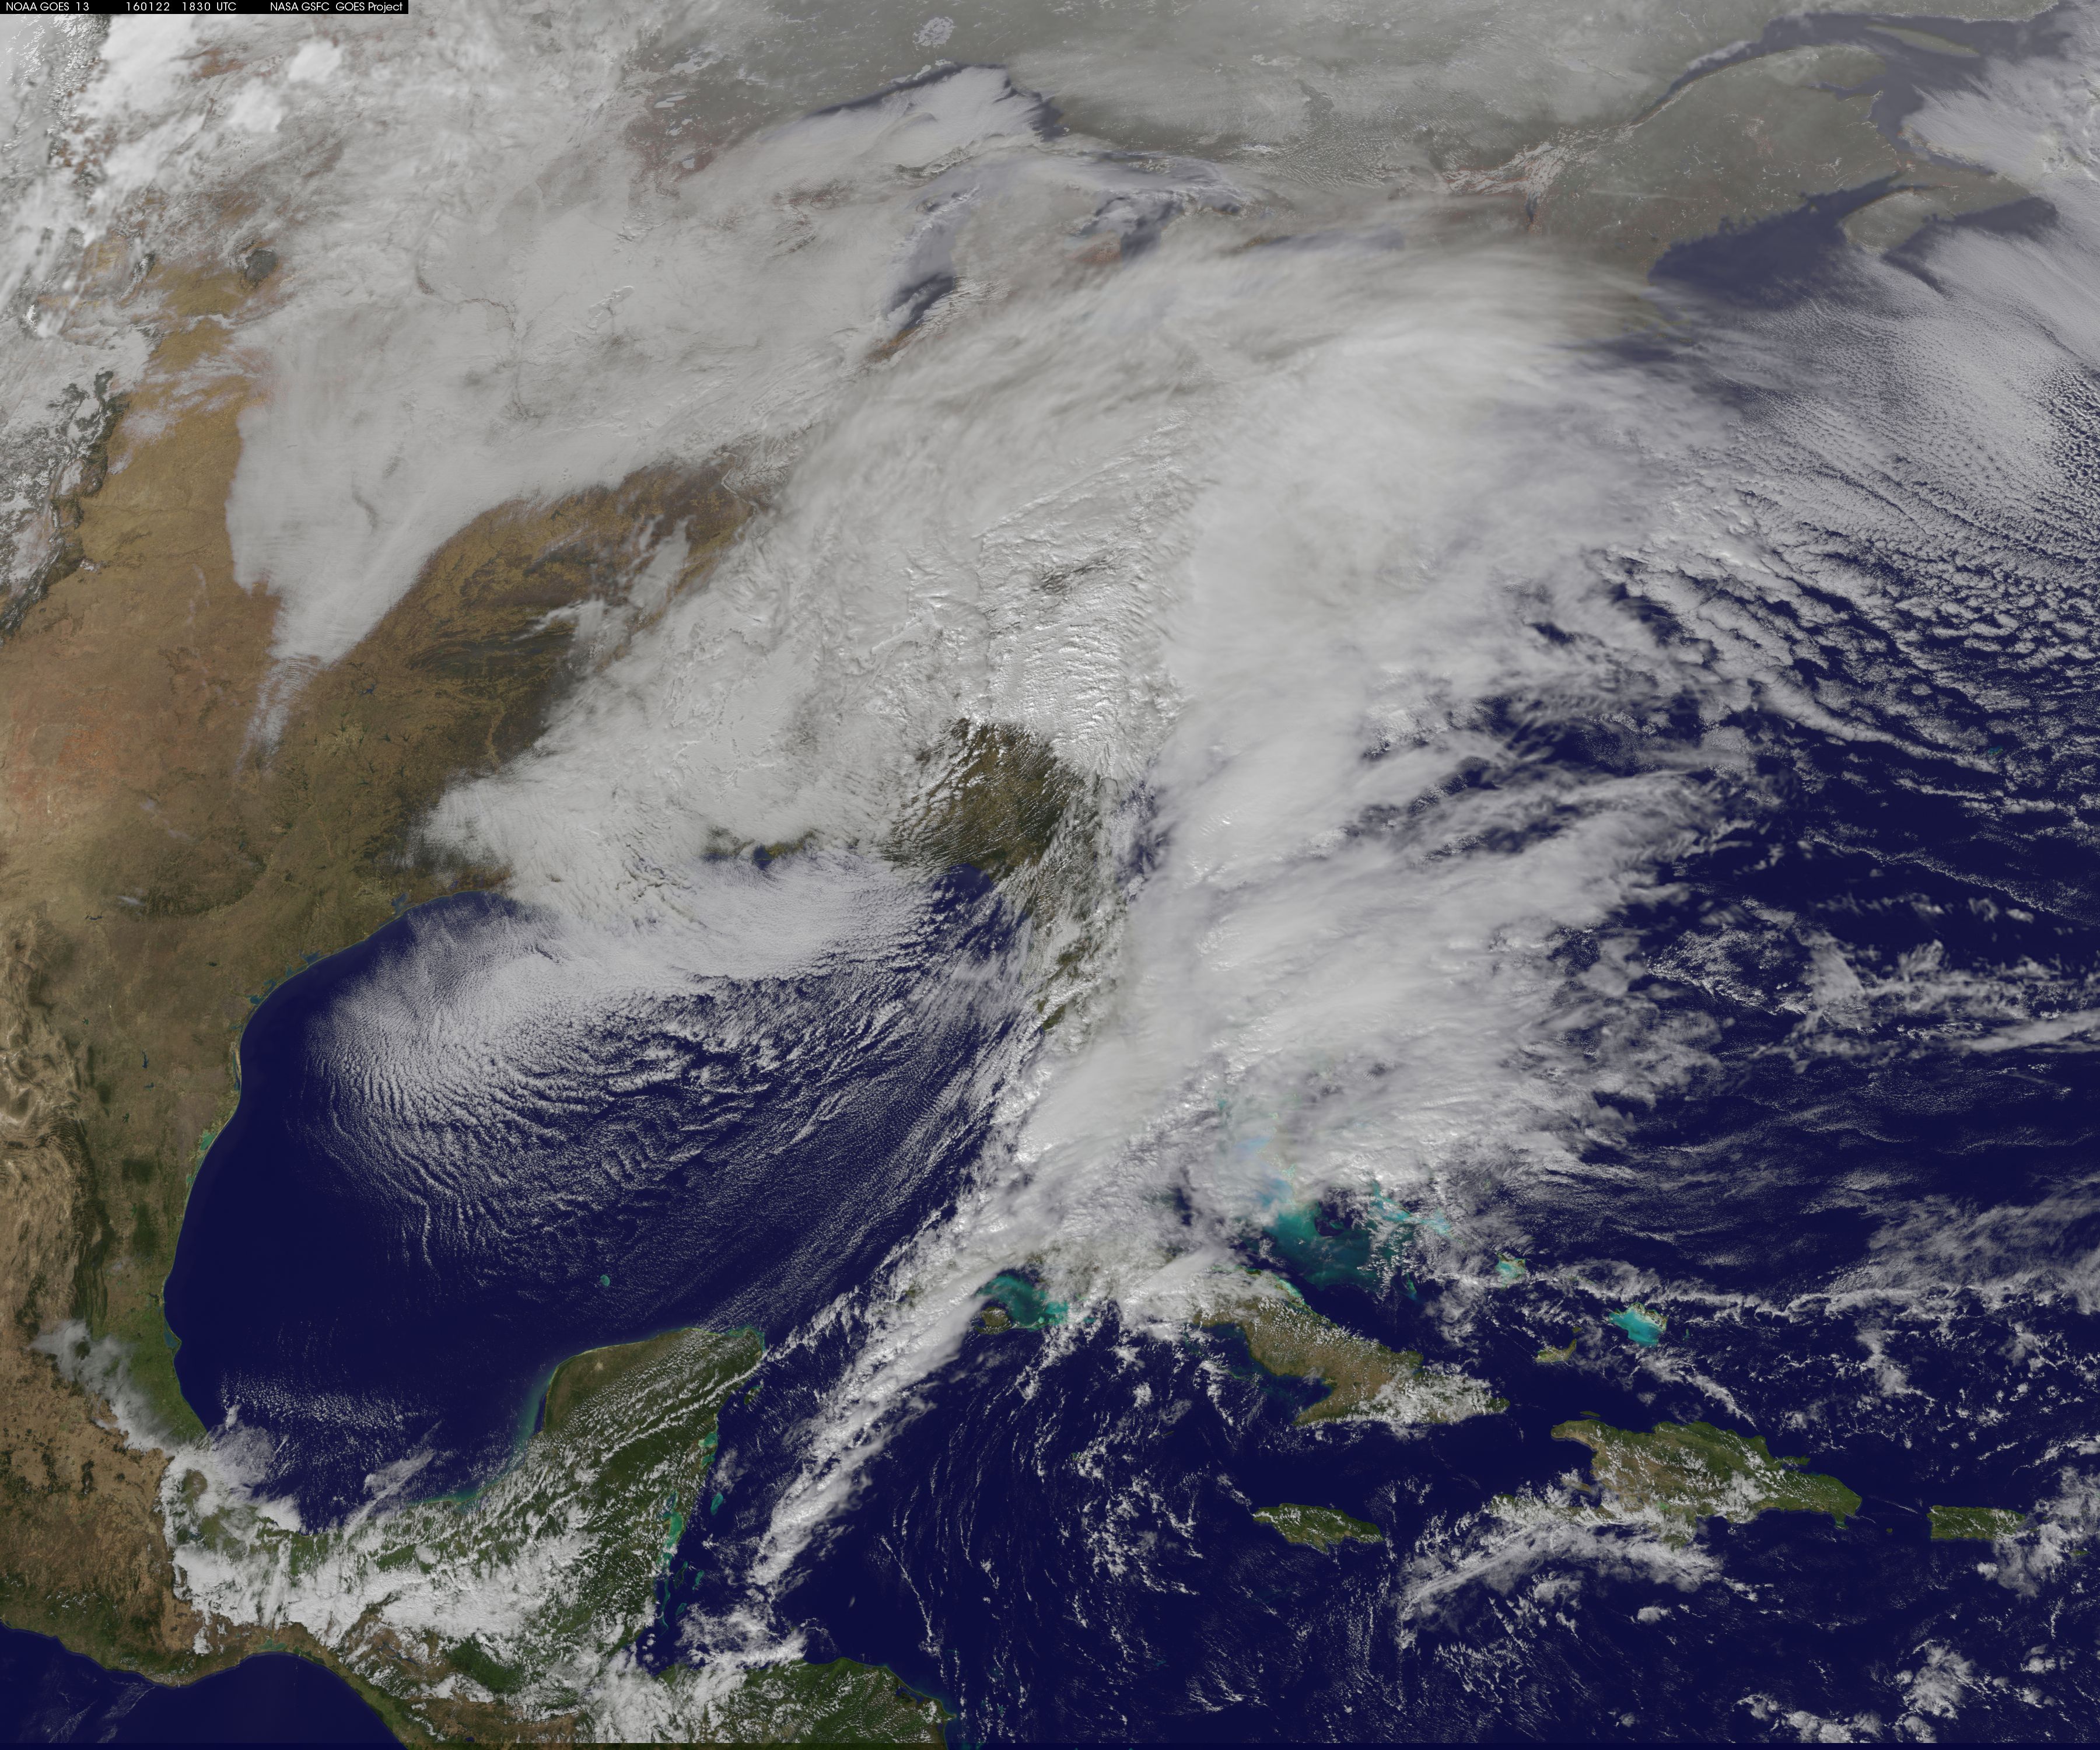
Credits: NASA/NOAA GOES Project
An animation of infrared and visible imagery from NOAA’s GOES-East satellite from Jan. 20 to 22 was created to show the movement of the system through the central U.S. into the Mid-Atlantic region. A visible image from NOAA’s GOES-East satellite at 1830 UTC (1:30 p.m. EST) showed clouds associated with the winter storm stretching from Arkansas to the northeastern U.S. coast. The animation and images were created by the NASA/NOAA GOES Project at NASA Goddard.
NWS said “A strong low over the Atlantic waters will become a dominant force in setting up very gusty winds in the Mid-Atlantic to Long Island, with storm surge flooding possible.”
The impacts from the storm stretch from the Ozark Mountains to the Mid-Atlantic. On Jan. 22, the NWS said heavy snowfall and increasingly strong winds through Saturday are predicted to cause dangerous blizzard conditions in Washington, D.C. where blizzard warnings were in effect. To the south, a quarter to half inch of ice accumulations across parts of the interior Carolinas outside the mountains – with lighter amounts expected in Kentucky and over the much of the central/eastern Carolinas. Severe weather is also possible across eastern Gulf coasts and Florida.
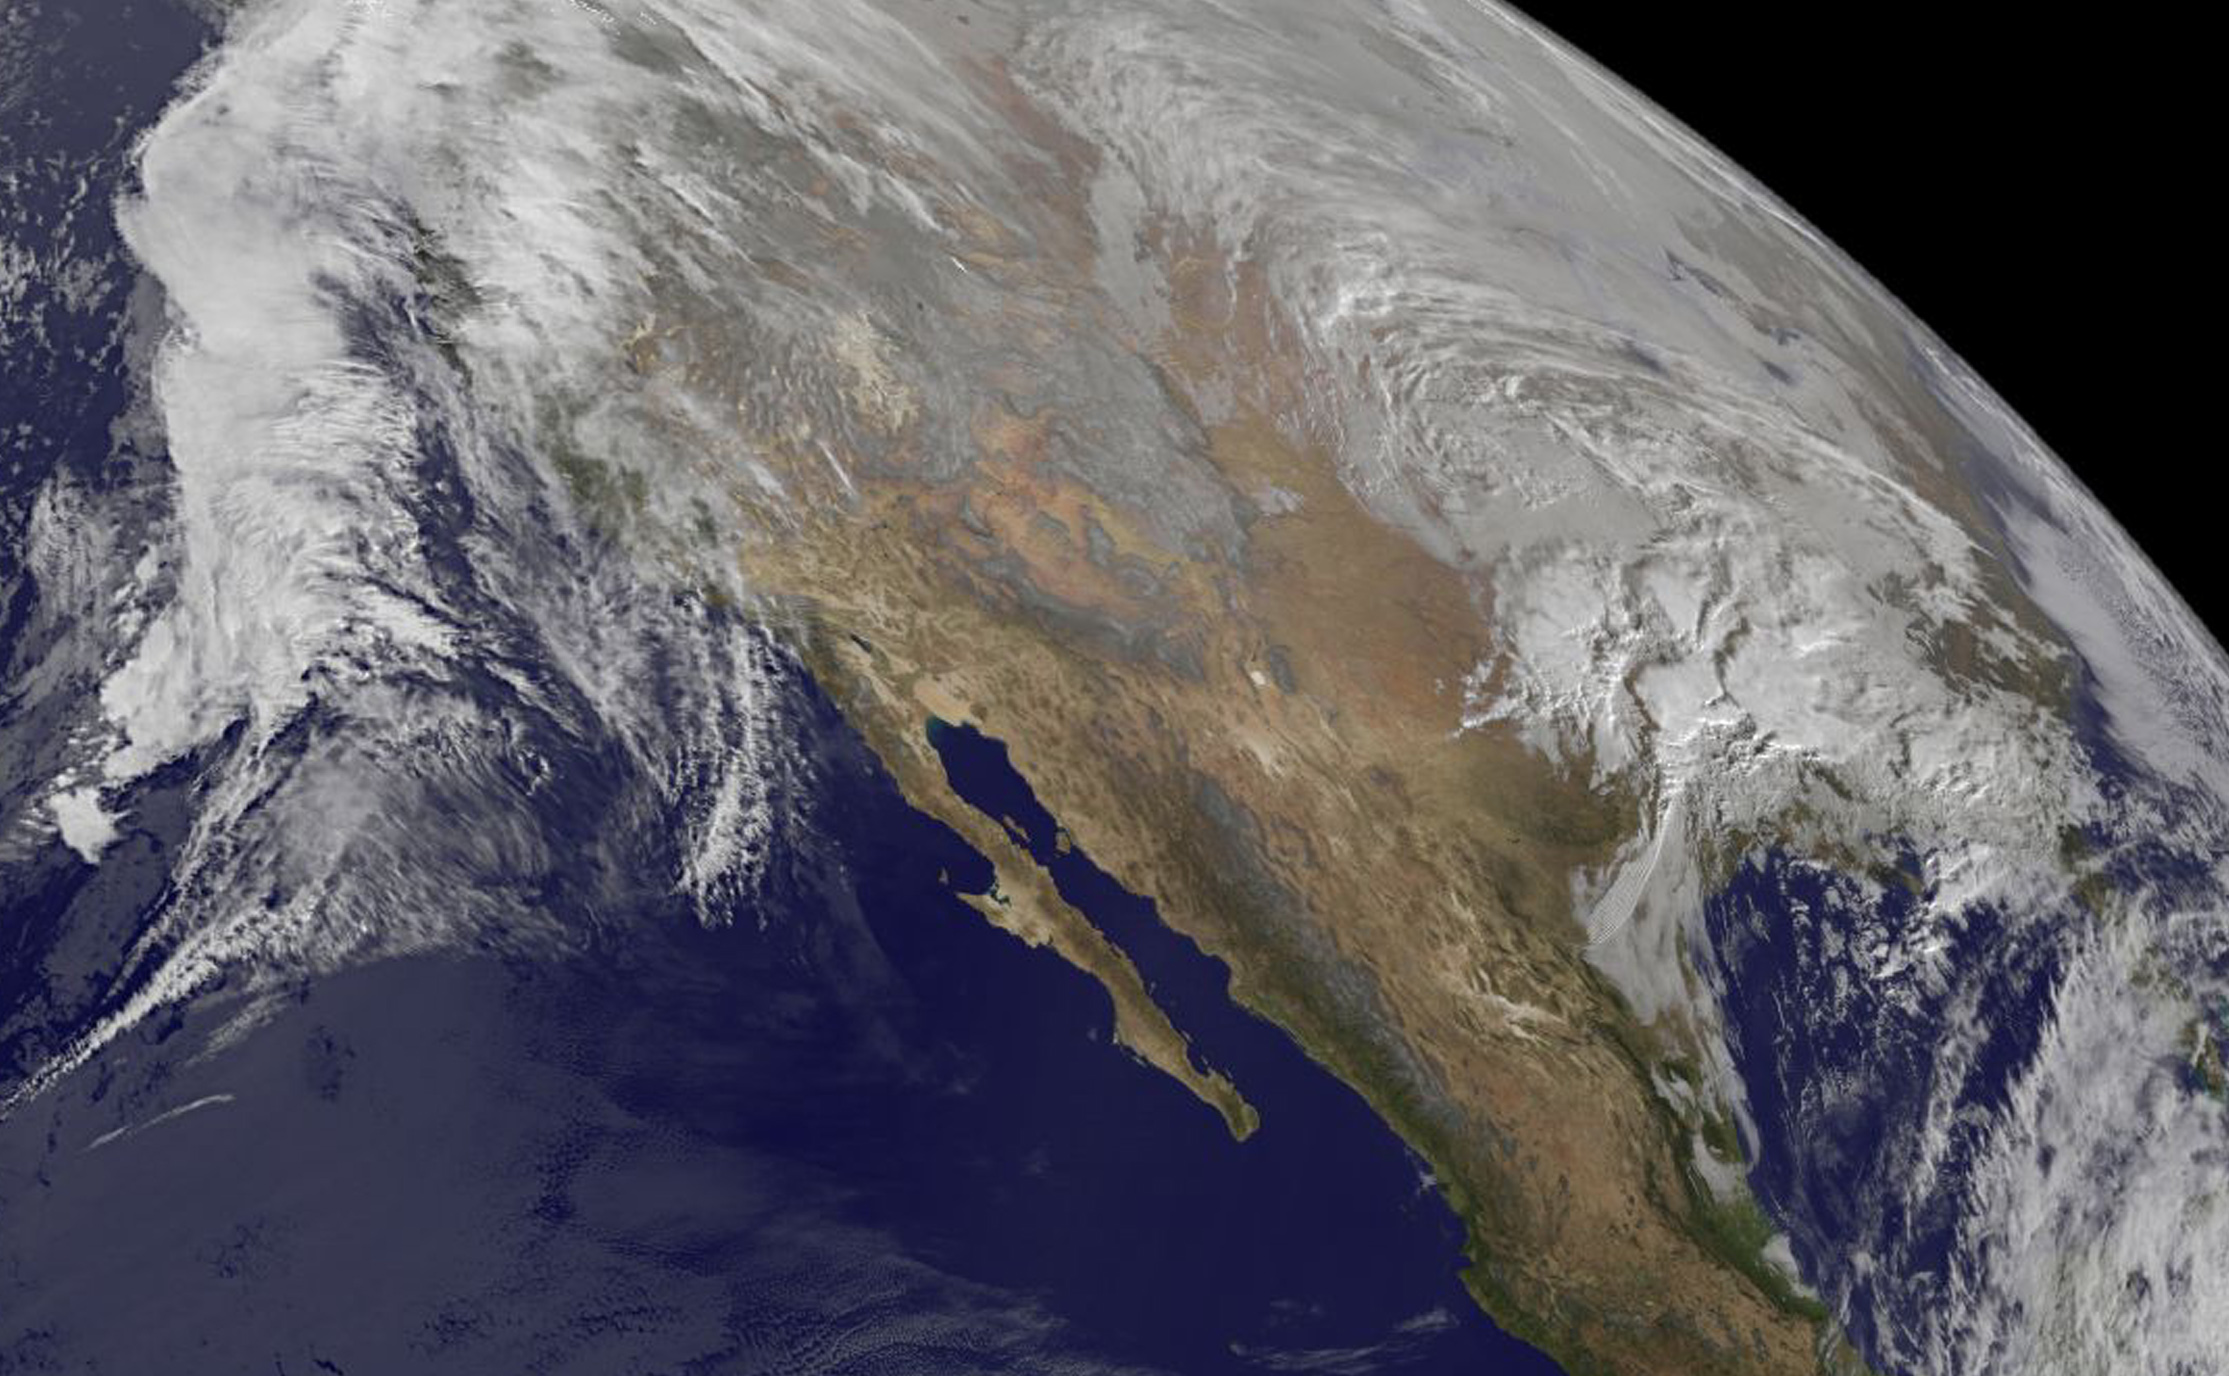
That winter storm is not the only big weather maker in the United States as another low pressure area was affecting the Pacific Northwest. On Jan. 22, heavy rainfall is expected in lower elevations of northwestern California and southwestern Oregon with heavy snow in higher elevations of Sierras and Washington Cascade mountain range.
For updated forecasts, visit NOAA’s NWS website: www.weather.gov
Update #3 – January 22, 2016 – 8:58 AM Eastern Standard Time
NASA Sees Gulf Coast Severe Weather from Developing Winter Storm
An intensifying winter storm that is forecast to cause an historic blizzard in the Washington, D.C. area has also spawned severe weather in states from Texas to Florida along the Gulf Coast. NASA’s Global Precipitation Measurement or GPM mission core satellite observed the extreme rainfall this system was generating in the Gulf coast.
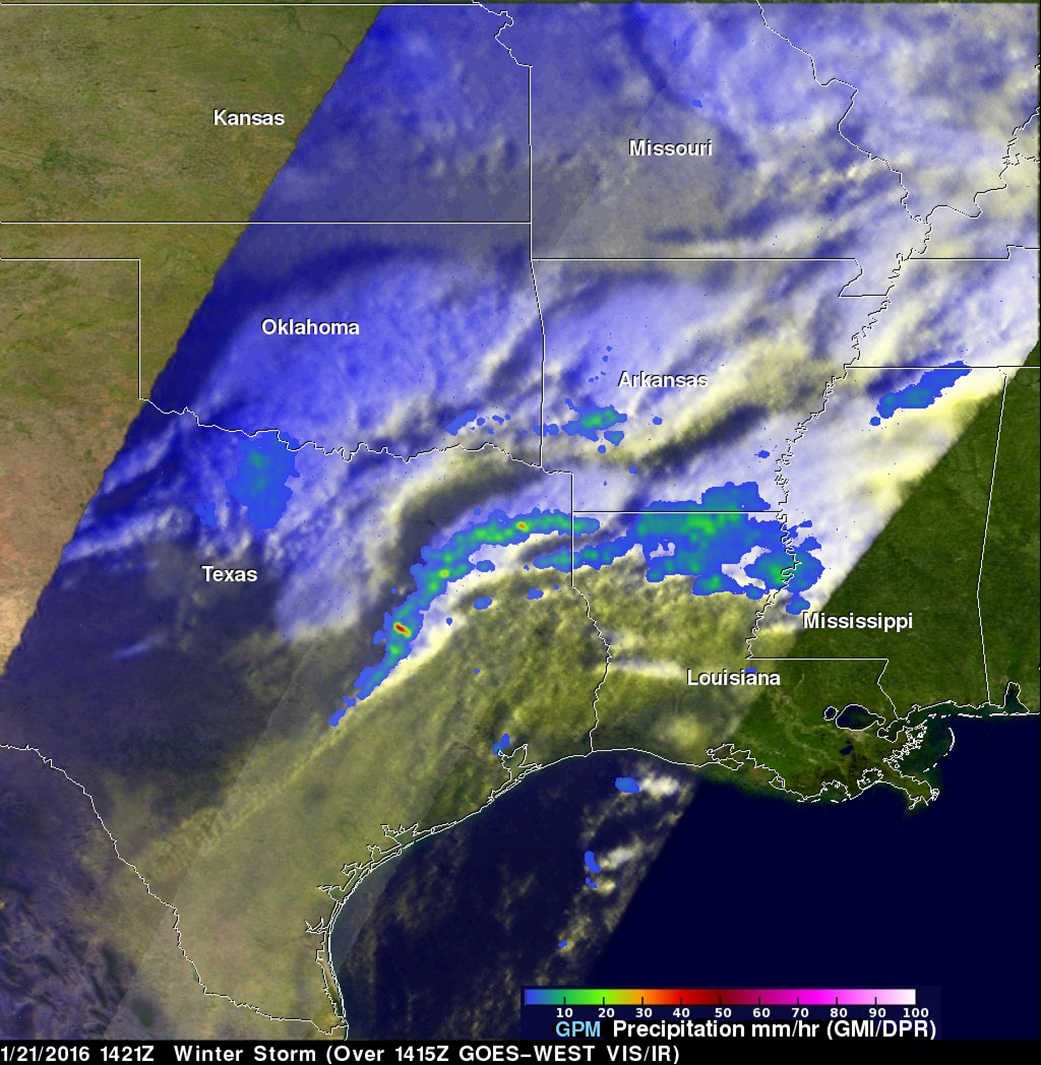
There were numerous reports of hail near this system from Thursday morning, Jan. 21 through early Friday morning, Jan. 22. At least one tornado was reported with this severe weather. The GPM core observatory satellite flew over the Gulf Coast on January 21, 2016 at 1421 UTC (8:21 a.m. CST) and had a good view of extreme rainfall occurring within this developing winter storm.
At NASA’s Goddard Space Flight Center in Greenbelt, Maryland, data from GPM’s Microwave Imager (GMI) and Dual-frequency Precipitation Radar (DPR) were used to measure the rainfall that was occurring when GPM traveled overhead from space. GPM’s DPR observed rain falling at a rate of over 100 mm (3.9 inches) per hour in one line of storms moving over eastern Texas. GPM’s 3-D radar data (Ku Band) were used to create a 3-D flyby of precipitation. GPM is a mission managed by both NASA and the Japan Aerospace Exploration Agency.
Behind the weather system, on Jan. 22, a tight pressure gradient will result in strong and gusty winds of 15 to 20 mph with gusts to 25 to 30 mph across south central and southwestern Arkansas, north central Louisiana, southeastern Oklahoma and northeastern Texas, according to the National Weather Service in Shreveport, Louisiana.
Credits: SSAI/NASA/JAXA, Hal Pierce
As the storm moves, east, places like eastern Arkansas are under winter storm warnings for ice accumulation. The National Weather Service in Little Rock Arkansas noted that much of central, southern and eastern Arkansas are facing additional ice accumulations of up to a tenth of an inch will be possible…with localized heavier amounts and additional snow and sleet. In addition, severe weather is also possible across eastern Gulf coasts and Florida.
On Jan. 22, the National Weather Service Weather Prediction Center in College Park, Maryland said “A potentially crippling winter storm is anticipated for portions of the mid-Atlantic Friday into early Saturday. Farther south, significant icing is likely for portions of Kentucky and North Carolina.” For updates on the storm, visit: www.weather.gov.
Update #2 – January 21, 2016 – 1:48 PM Eastern Standard Time
Update #1 – January 21, 2016 – 9:23 AM Eastern Standard Time
NASA and NOAA satellites are tracking a large winter storm that is expected to bring heavy snowfall to the U.S. Mid-Atlantic region on Jan. 22 and 23. Data from NASA-NOAA’s Suomi NPP and NOAA’s GOES-East satellite were used to create images and an animation of the movement of the powerful storm.
The low pressure area from the Eastern Pacific Ocean moved into the western U.S. and tracked across the four corners region into Texas where NASA-NOAA’s Suomi NPP satellite observed the clouds associated with the storm. The Visible Infrared Imaging Radiometer Suite (VIIRS) instrument aboard Suomi NPP satellite captured the visible image on January 20, 2016 at 19:30 UTC (2:30 p.m. EST) when the storm was over the central U.S. In the image, snow cover is visible in the Rockies and southern Great Lakes states.
VIIRS collects visible and infrared imagery and global observations of land, atmosphere, cryosphere and oceans.
That low pressure system located over the south central United States on Jan. 21 is expected to track east across the Tennessee Valley and will give way to a deepening coastal low pressure area. The National Weather Service said “This latter feature takes over and becomes a dominant force in setting up heavy snow bands over the Mid-Atlantic and very gusty winds.”
The storm system is expected to bring an increased risk of severe weather from far southeastern Texas across southern Louisiana/Mississippi, and into the far western Florida Panhandle on Thursday, Jan. 21. That threat for severe weather will move east as the low pressure area continues heading in that direction.
The National Weather Service Weather Prediction Center in College Park, Maryland said “A potentially crippling winter storm is anticipated for portions of the mid-Atlantic Friday into early Saturday. Snowfall may approach two feet for some locations, including the Baltimore and Washington, D.C. metro areas. Farther north, there is uncertainty in snowfall for the New York City-to-Boston corridor. Farther south, significant icing is likely for portions of Kentucky and North Carolina.”
Credits: NASA/NOAA GOES Project
A 21 second animation of infrared and visible imagery from NOAA’s GOES-East satellite from Jan. 19 to 21 shows the movement one frontal system moving across the southern U.S. followed by a second storm system that is expected to bring the powerful winter storm to the Mid-Atlantic. The animation was created by NASA/NOAA’s GOES Project at NASA’s Goddard Space Flight Center in Greenbelt, Maryland. GOES satellites are managed by NOAA, and the NASA/NOAA GOES Project creates imagery and animations using the GOES satellite data.
Early on Jan. 21, the NWS hazards web page showed a winter storm watch stretching from the Tennessee valley into the interior Carolinas and up into the Central Appalachians/Mid-Atlantic region. Even a blizzard watch is in effect across the Washington, D.C. metro area along with adjacent locations.
For updated forecasts, visit: www.weather.gov.
Rob Gutro / Hal Pierce
NASA’s Goddard Space Flight Center