


NASA’s Spots Extra-Tropical Cyclone Conson in Sea of Okhotsk
NASA’s Terra satellite captured an image of extra-tropical cyclone Conson’s clouds spread Japan’s northern most island, the Sea of Okhotsk and Russia’s Kamchatka Peninsula.
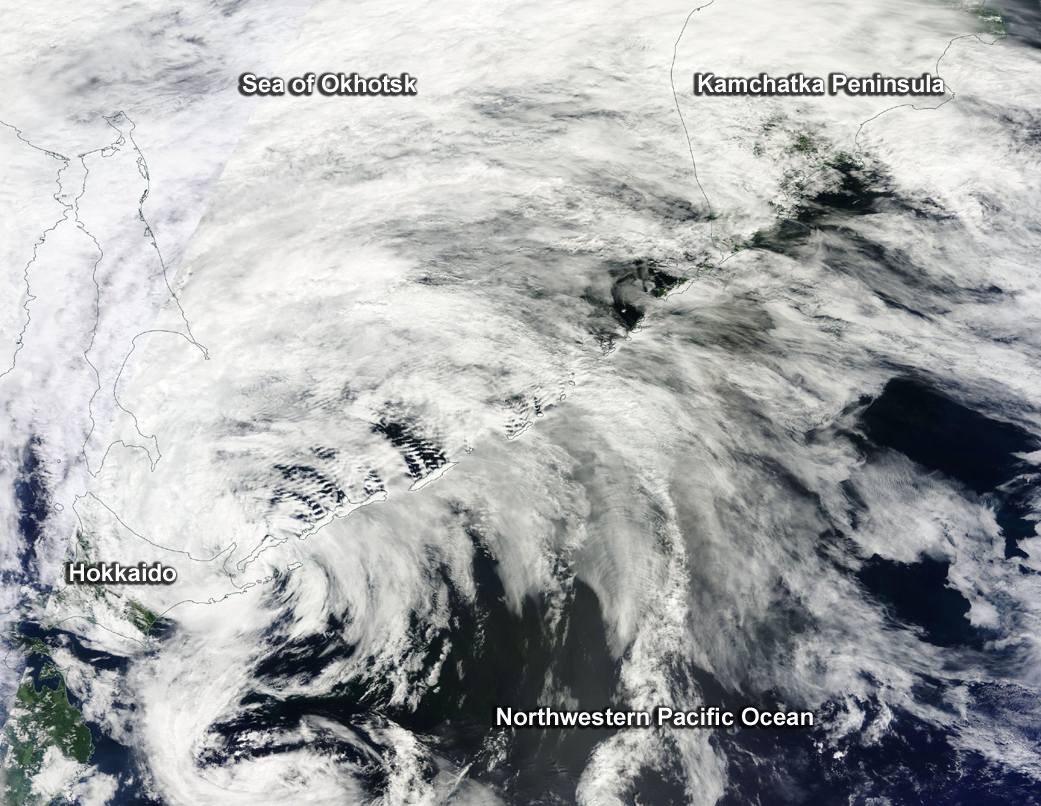
On Aug. 15, 2016 the Moderate Resolution Imaging Spectroradiometer aboard NASA’s Terra satellite captured a visible image of the clouds associated with the extra-tropical cyclone. In the image, clouds covered Japan’s island of Hokkaido and stretched over the Sea of Okhotsk and the southern portion of Russia’s Kamchatka Peninsula.
Hokkaido is Japan’s second largest island and the largest and northernmost prefecture. The Kamchatka Peninsula is located in far eastern Russia and is about 776 miles (1,250 kilometers) long. The peninsula is between the Sea of Okhotsk to the west, and the Pacific Ocean to the east.
The Joint Typhoon Warning Center issued the final warning of Conson on Sunday, Aug. 14.
Rob Gutro
NASA’s Goddard Space Flight Center
Aug. 12, 2016 – NASA Sees Wind Shear Relax in Tropical Storm Conson
NASA-NOAA’s Suomi NPP satellite passed over Tropical Storm Conson on Aug. 11 and visible imagery showed that wind shear was again affecting the storm as it did days earlier.
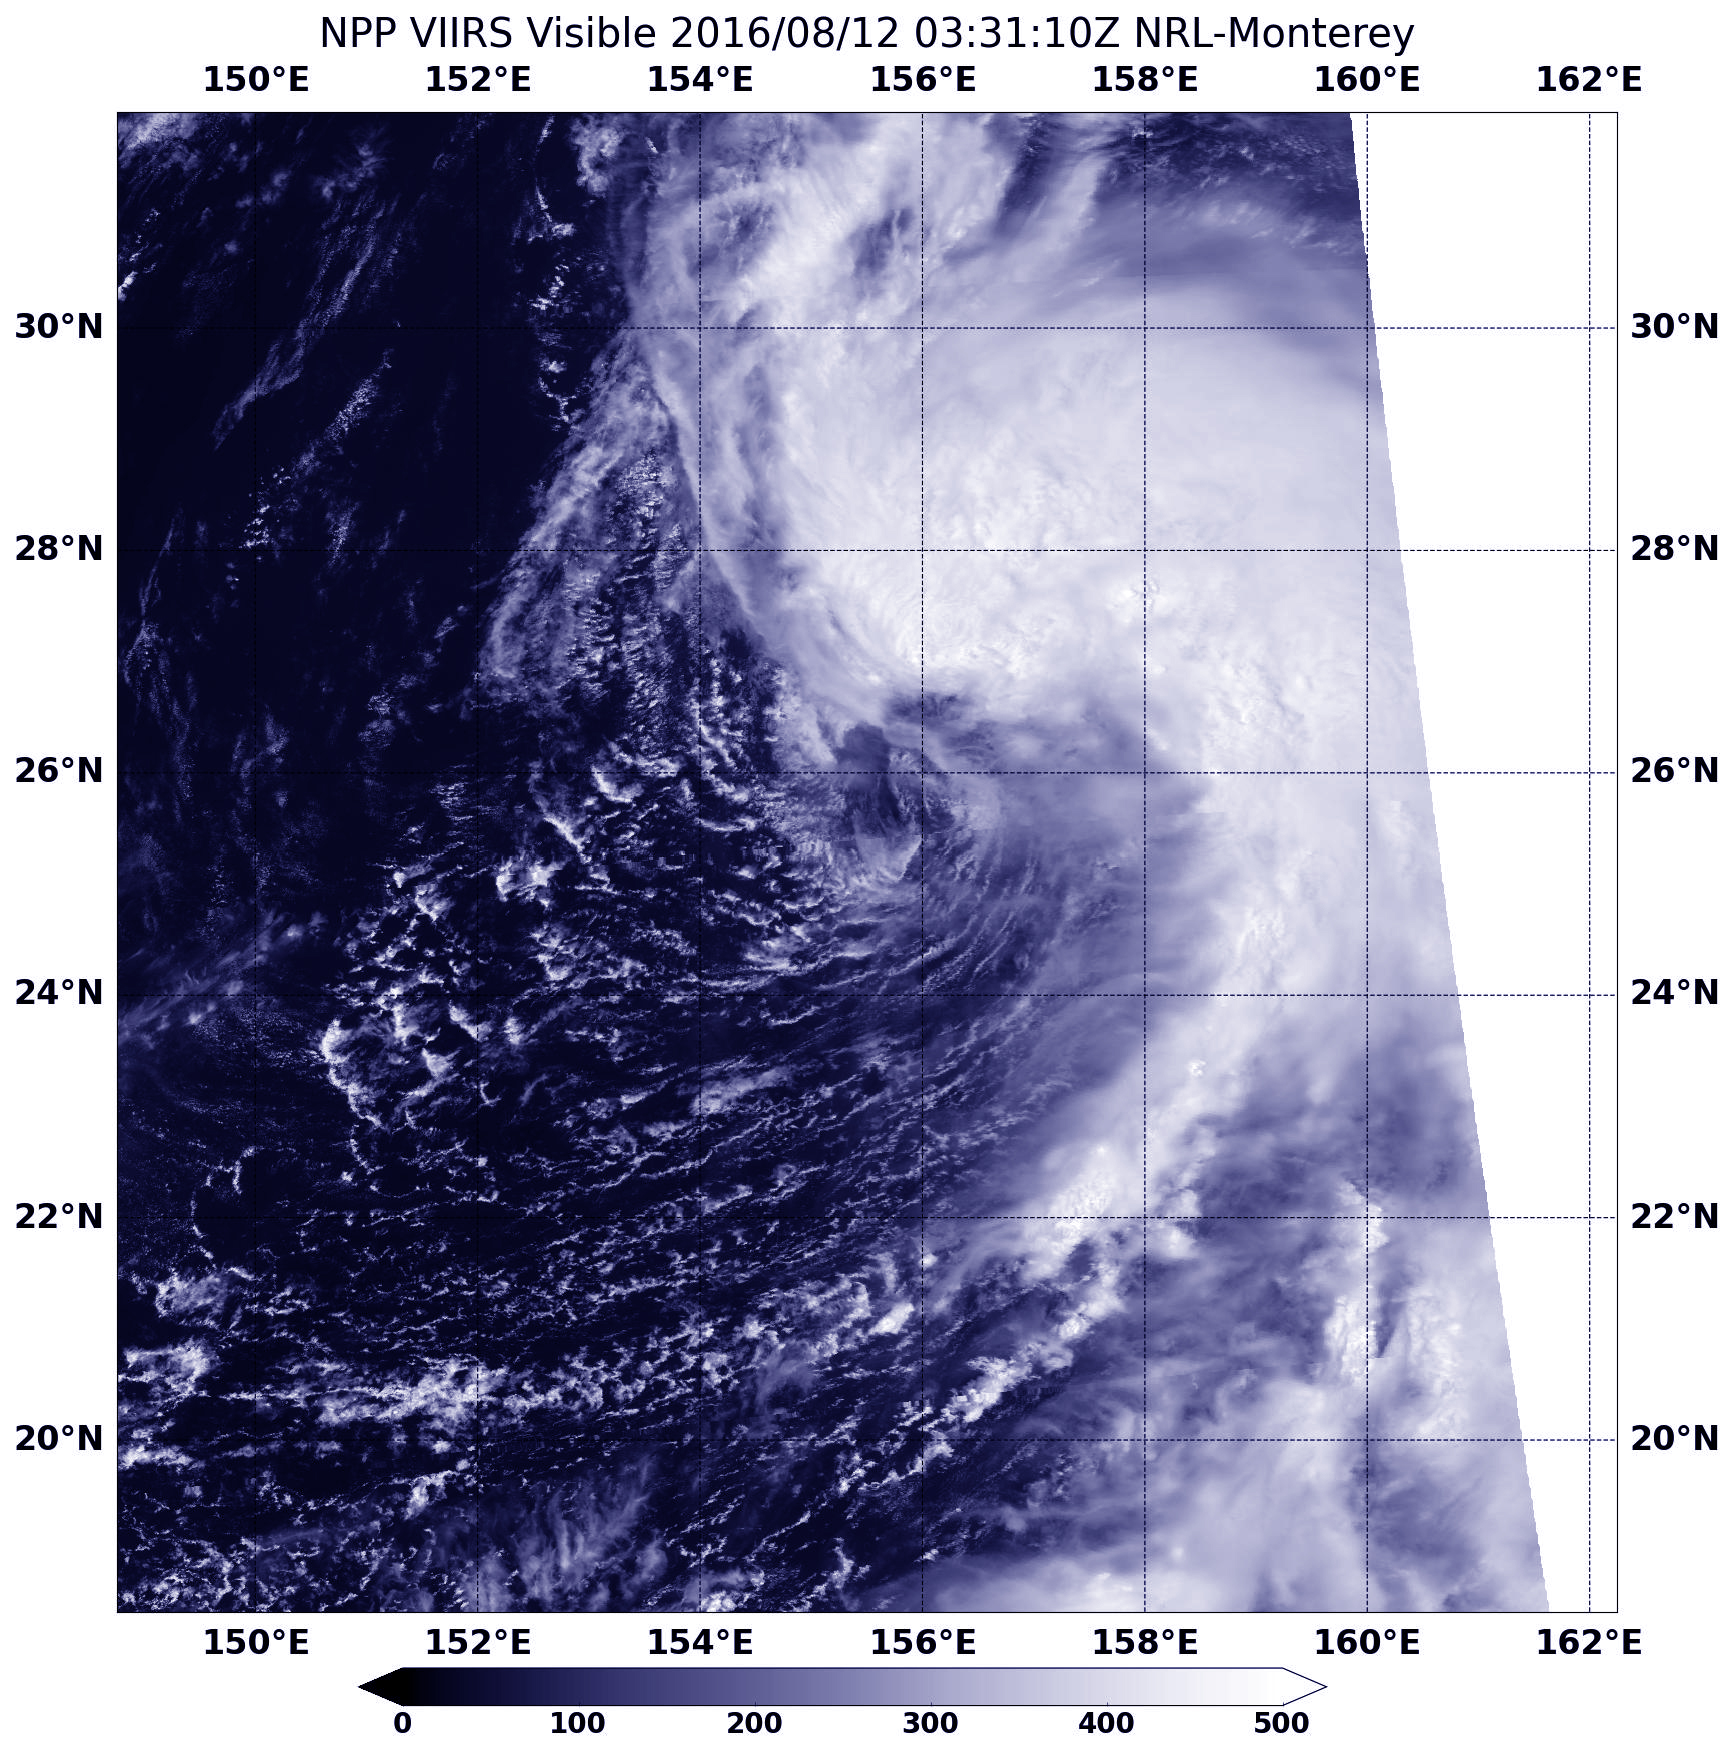
On Aug. 11 at 11:31 p.m. EDT (Aug. 12 at 03:31 UTC) the Visible Infrared Imaging Radiometer Suite (VIIRS) instrument aboard NASA-NOAA’s Suomi NPP satellite captured a visible light image of Tropical Storm Conson. Southwesterly wind shear that had pushed the bulk of clouds and showers to the northeast of the storm’s center on Aug. 8 had weakened and has kicked up again on Aug. 11 and Aug. 12. The southwesterly winds were as strong as 23 mph (20 knots/37 kph).
Conson appeared almost devoid of clouds and thunderstorms on its western side because of dry and sinking air that is preventing the development of clouds. The bulk of clouds and thunderstorms were wrapped from north to east of the center of circulation.
At 5 a.m. EDT (0900 UTC) on Aug. 12, 2016, Tropical Storm Conson was centered near 26.9 degrees north latitude and 155.6 degrees east longitude, about 151 nautical miles northeast of Marcus Island, also known as Minami-Tori-shima. It is an isolated Japanese coral atoll about 1,148 miles (1,848 kilometers) southeast of Tokyo.
Conson was moving to the west at 13.8 mph (12 knots/22.2 kph) and had maximum sustained winds near 46 mph (40 knots/74 kph).
The Joint Typhoon Warning Center (JTWC) forecast calls for Conson to strengthen as it continues north over the next several days and moves into a more favorable environment.
By Rob Gutro
NASA’s Goddard Space Flight Center, Greenbelt, Md.
Aug. 11, 2016 – NASA Measures Winds of Tropical Storm Conson
NASA’s RapidScat instrument provided measurements of sustained wind speeds as Tropical Storm Conson continued tracking north through the northwestern Pacific Ocean.
When RapidScat passed over Conson on Aug. 10, it was near peak intensity. RapidScat measured maximum sustained winds around the center of circulation as fast as 49 mph (22 meters per second/79 kph) on Aug. 10. The RapidScat instrument that flies aboard the International Space Station measures Earth’s ocean surface wind speed and direction over open waters.
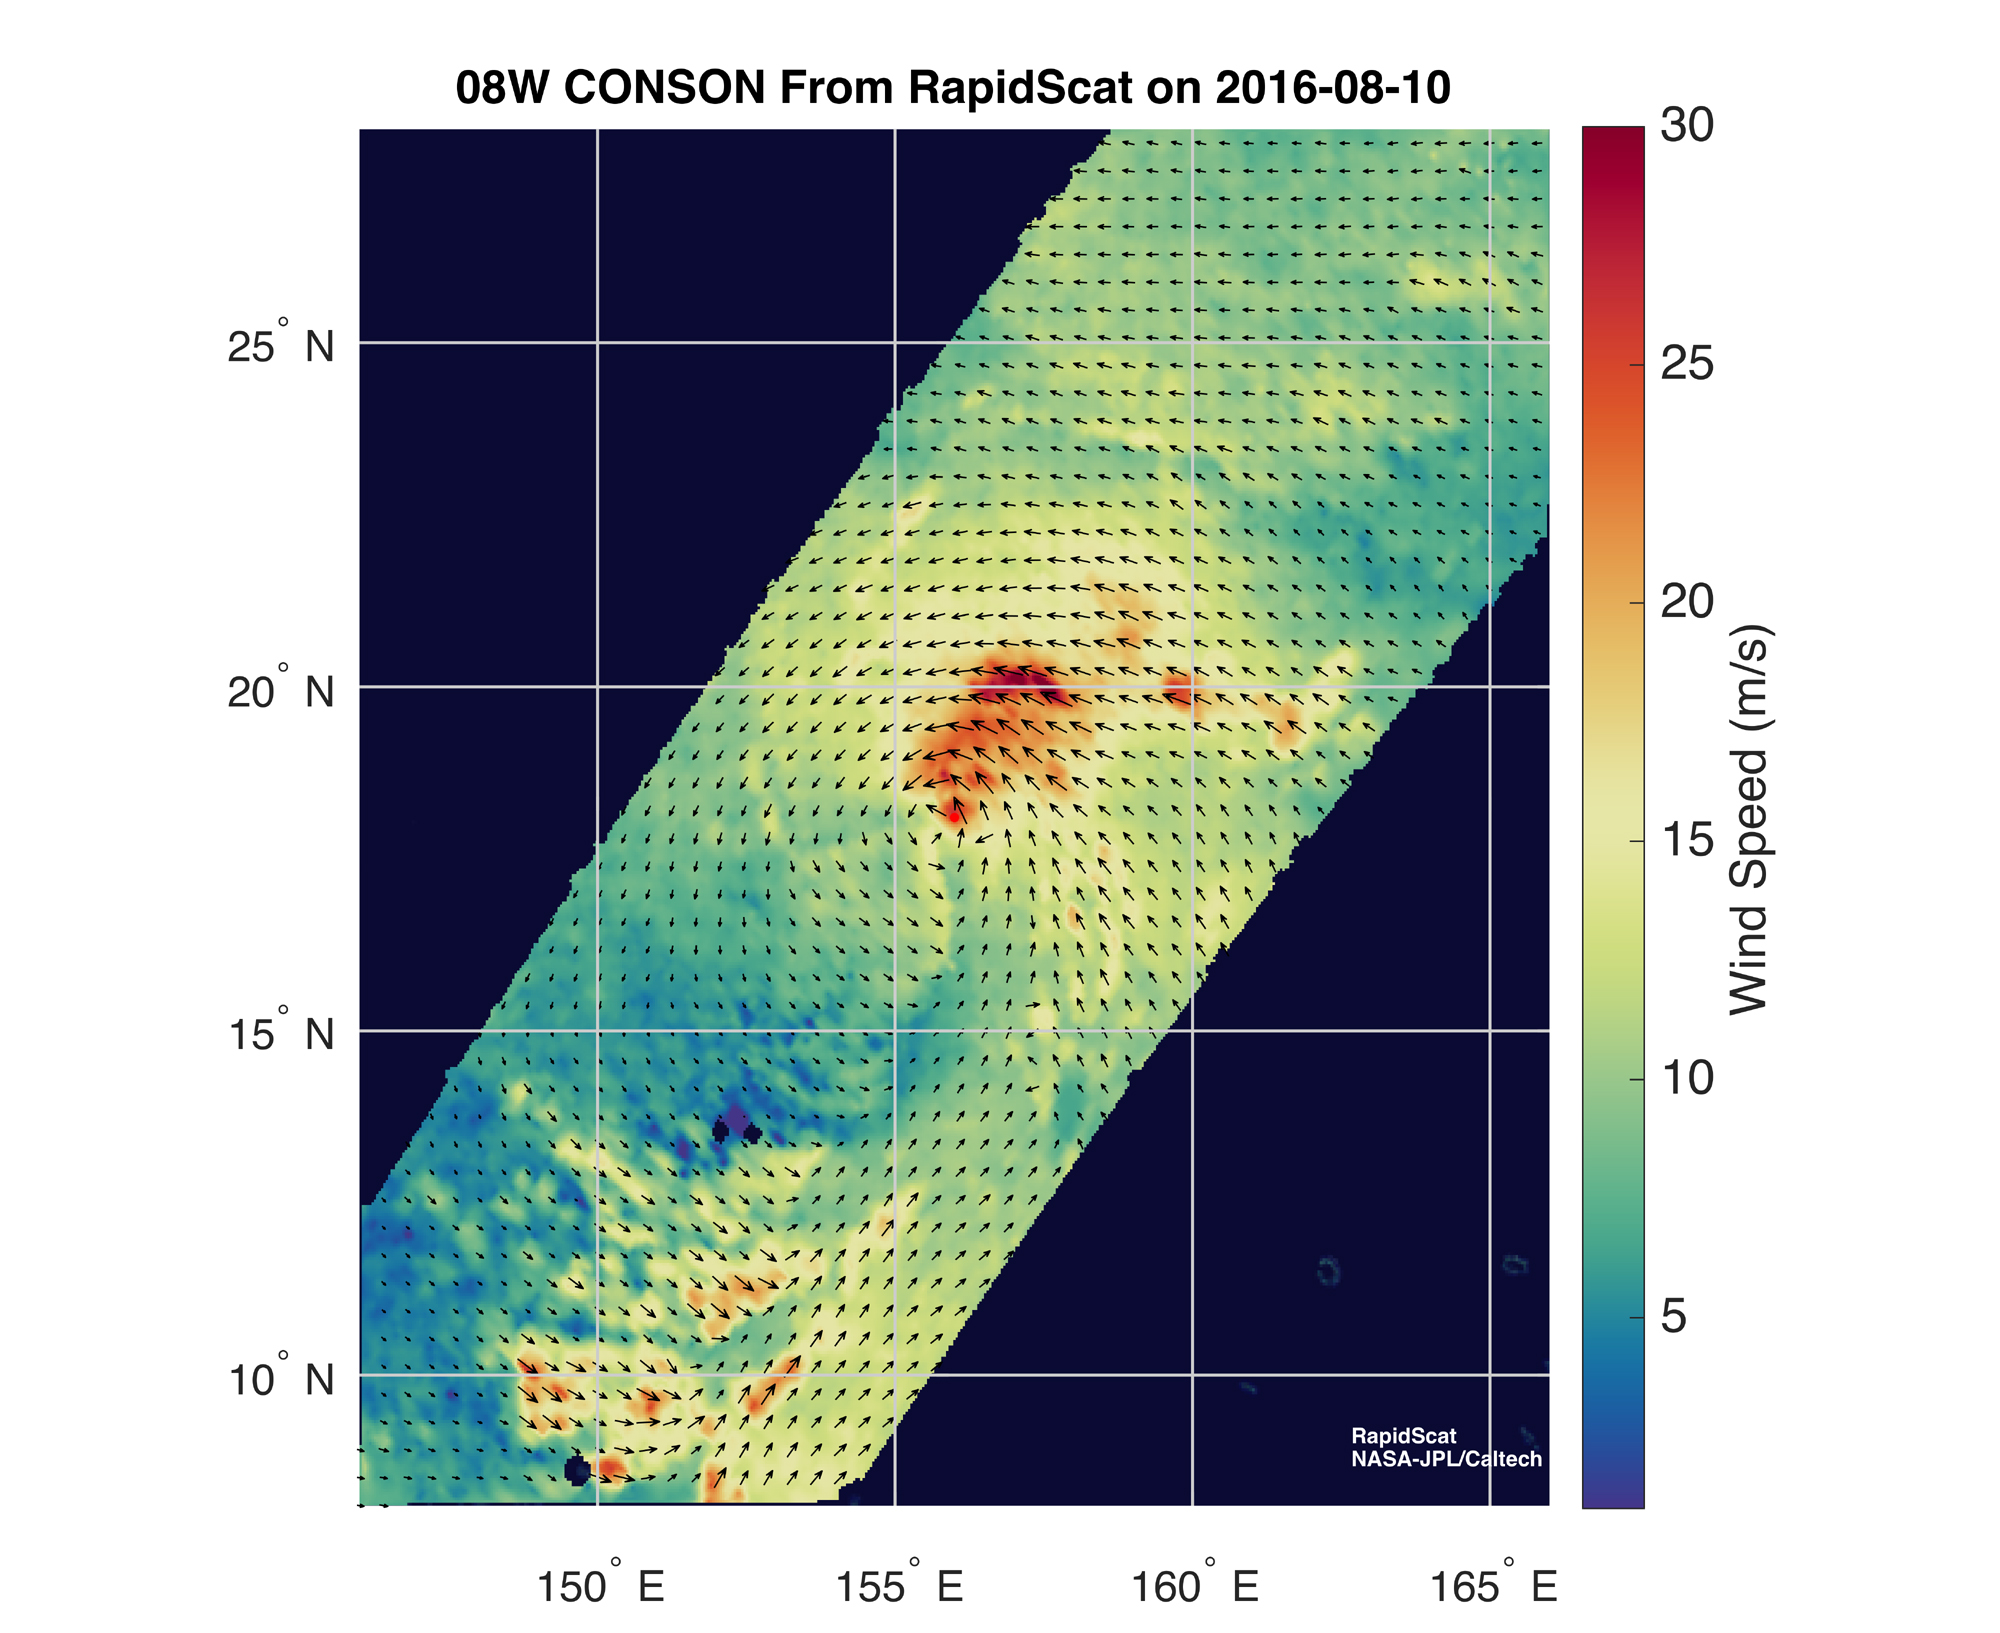
RapidScat is an important tool for meteorologists, because it shows forecasters the location of the strongest winds in different quadrants of an area of low pressure or tropical cyclone as they are not always equally distributed. In addition, surface wind speed is always lower than speeds at higher altitude.
At 11 a.m. EDT (1500 UTC) on Aug. 11 Tropical Storm Conson’s maximum sustained winds were near 40 mph (35 knots/62 kph). Conson was centered near 21.9 degrees north latitude and 154.4 degrees east longitude, about 140 nautical miles south of Minami Tori Shima.
Conson is moving to the north-northeast at 17 mph (15 knots/27.7 kph) and is expected to turn to the north-northwest. Conson does not threaten any land masses.
By Rob Gutro
NASA’s Goddard Space Flight Center, Greenbelt, Md.
Aug. 10, 2016 – NASA Sees Wind Shear Relax in Tropical Storm Conson
NASA-NOAA’s Suomi NPP satellite passed over Tropical Storm Conson early on Aug. 10 and visible imagery showed the wind shear that was affecting the storm earlier has waned as the system appeared more rounded.
On Aug. 9 at 10:25 p.m. EDT (Aug. 10 at 02:25 UTC) the Visible Infrared Imaging Radiometer Suite (VIIRS) instrument aboard NASA-NOAA’s Suomi NPP satellite captured a visible light image of Tropical Storm Conson. The southwesterly wind shear that had pushed the bulk of clouds and showers to the northeast of the storm’s center on Aug. 8 has weakened. Although still appearing somewhat elongated, the clouds and thunderstorms were wrapping around the center of circulation. Fragmented bands of thunderstorms from the east were seen wrapping into the low-level center of circulation.
At 5 a.m. EDT (0900 UTC) on Aug. 10, 2016, Tropical Storm Conson was centered near 18.5 degrees north latitude and 155.5 degrees east longitude, about 352 nautical miles south-southeast of Marcus Island, also known as Minami-Tori-shima. It is an isolated Japanese coral atoll about 1,148 miles (1,848 kilometers) southeast of Tokyo.
Conson was moving to the west at 6.9 mph (6 knots/11.1 kph) and had maximum sustained winds near 51.7 mph (45 knots/83.3 kph).
The Joint Typhoon Warning Center (JTWC) forecast calls for Conson to strengthen as it continues north over the next several days. Conson is expected to reach typhoon status on Aug. 12, far away from land areas in the Northwestern Pacific Ocean.
By Rob Gutro
NASA’s Goddard Space Flight Center, Greenbelt, Md.
Aug. 9, 2016 – NASA Spots Tropical Storm Conson Facing Wind Shear
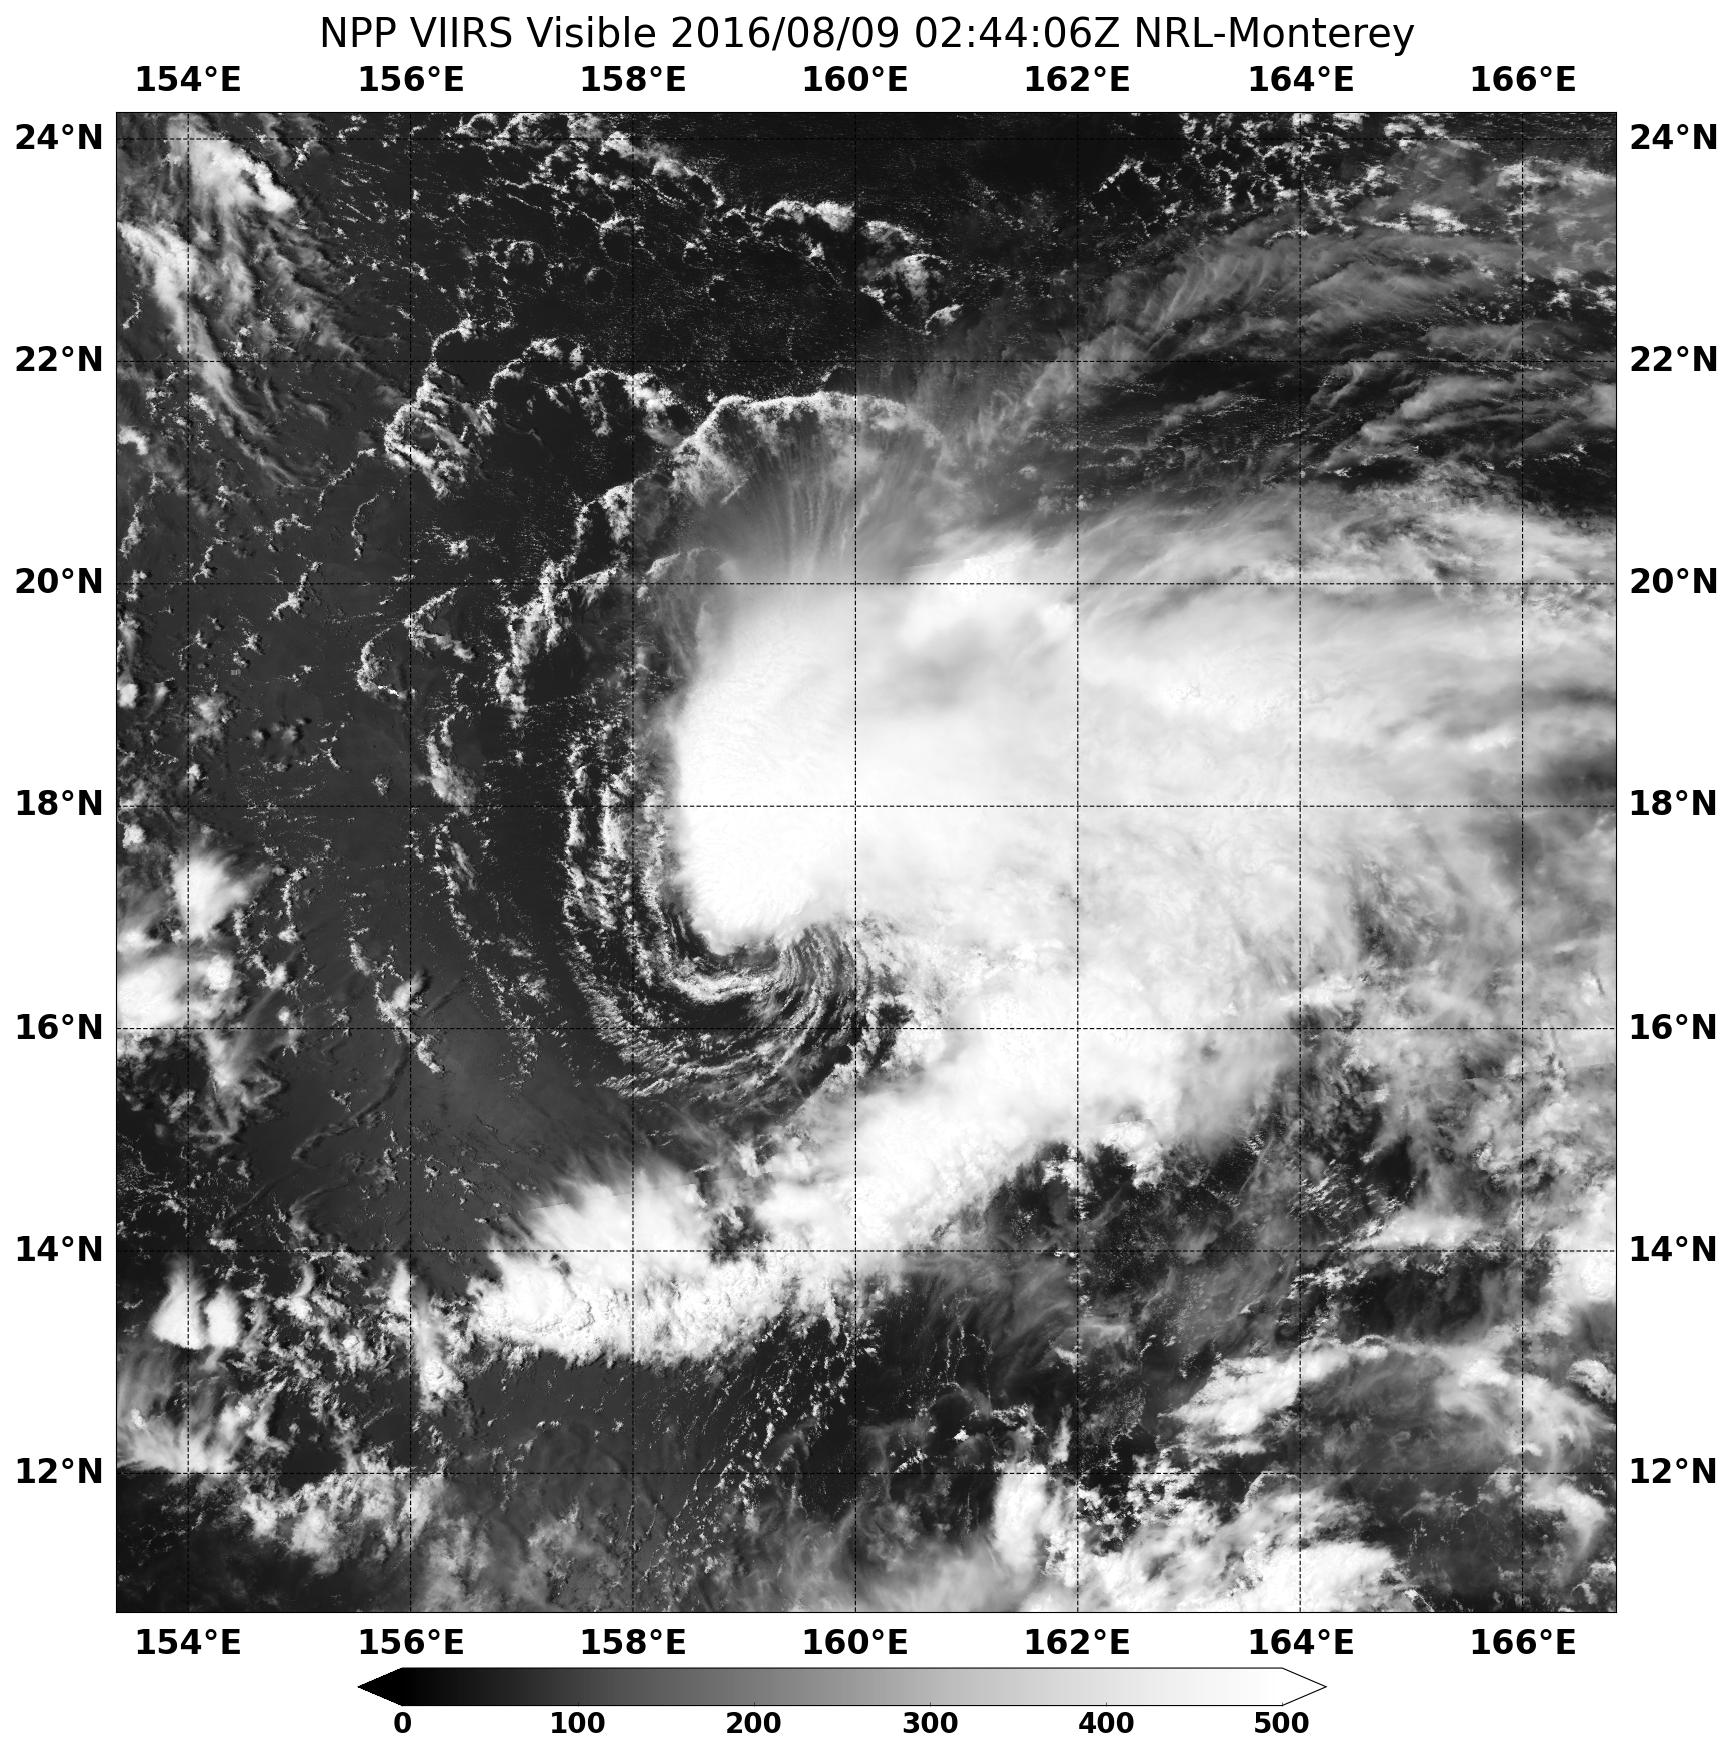
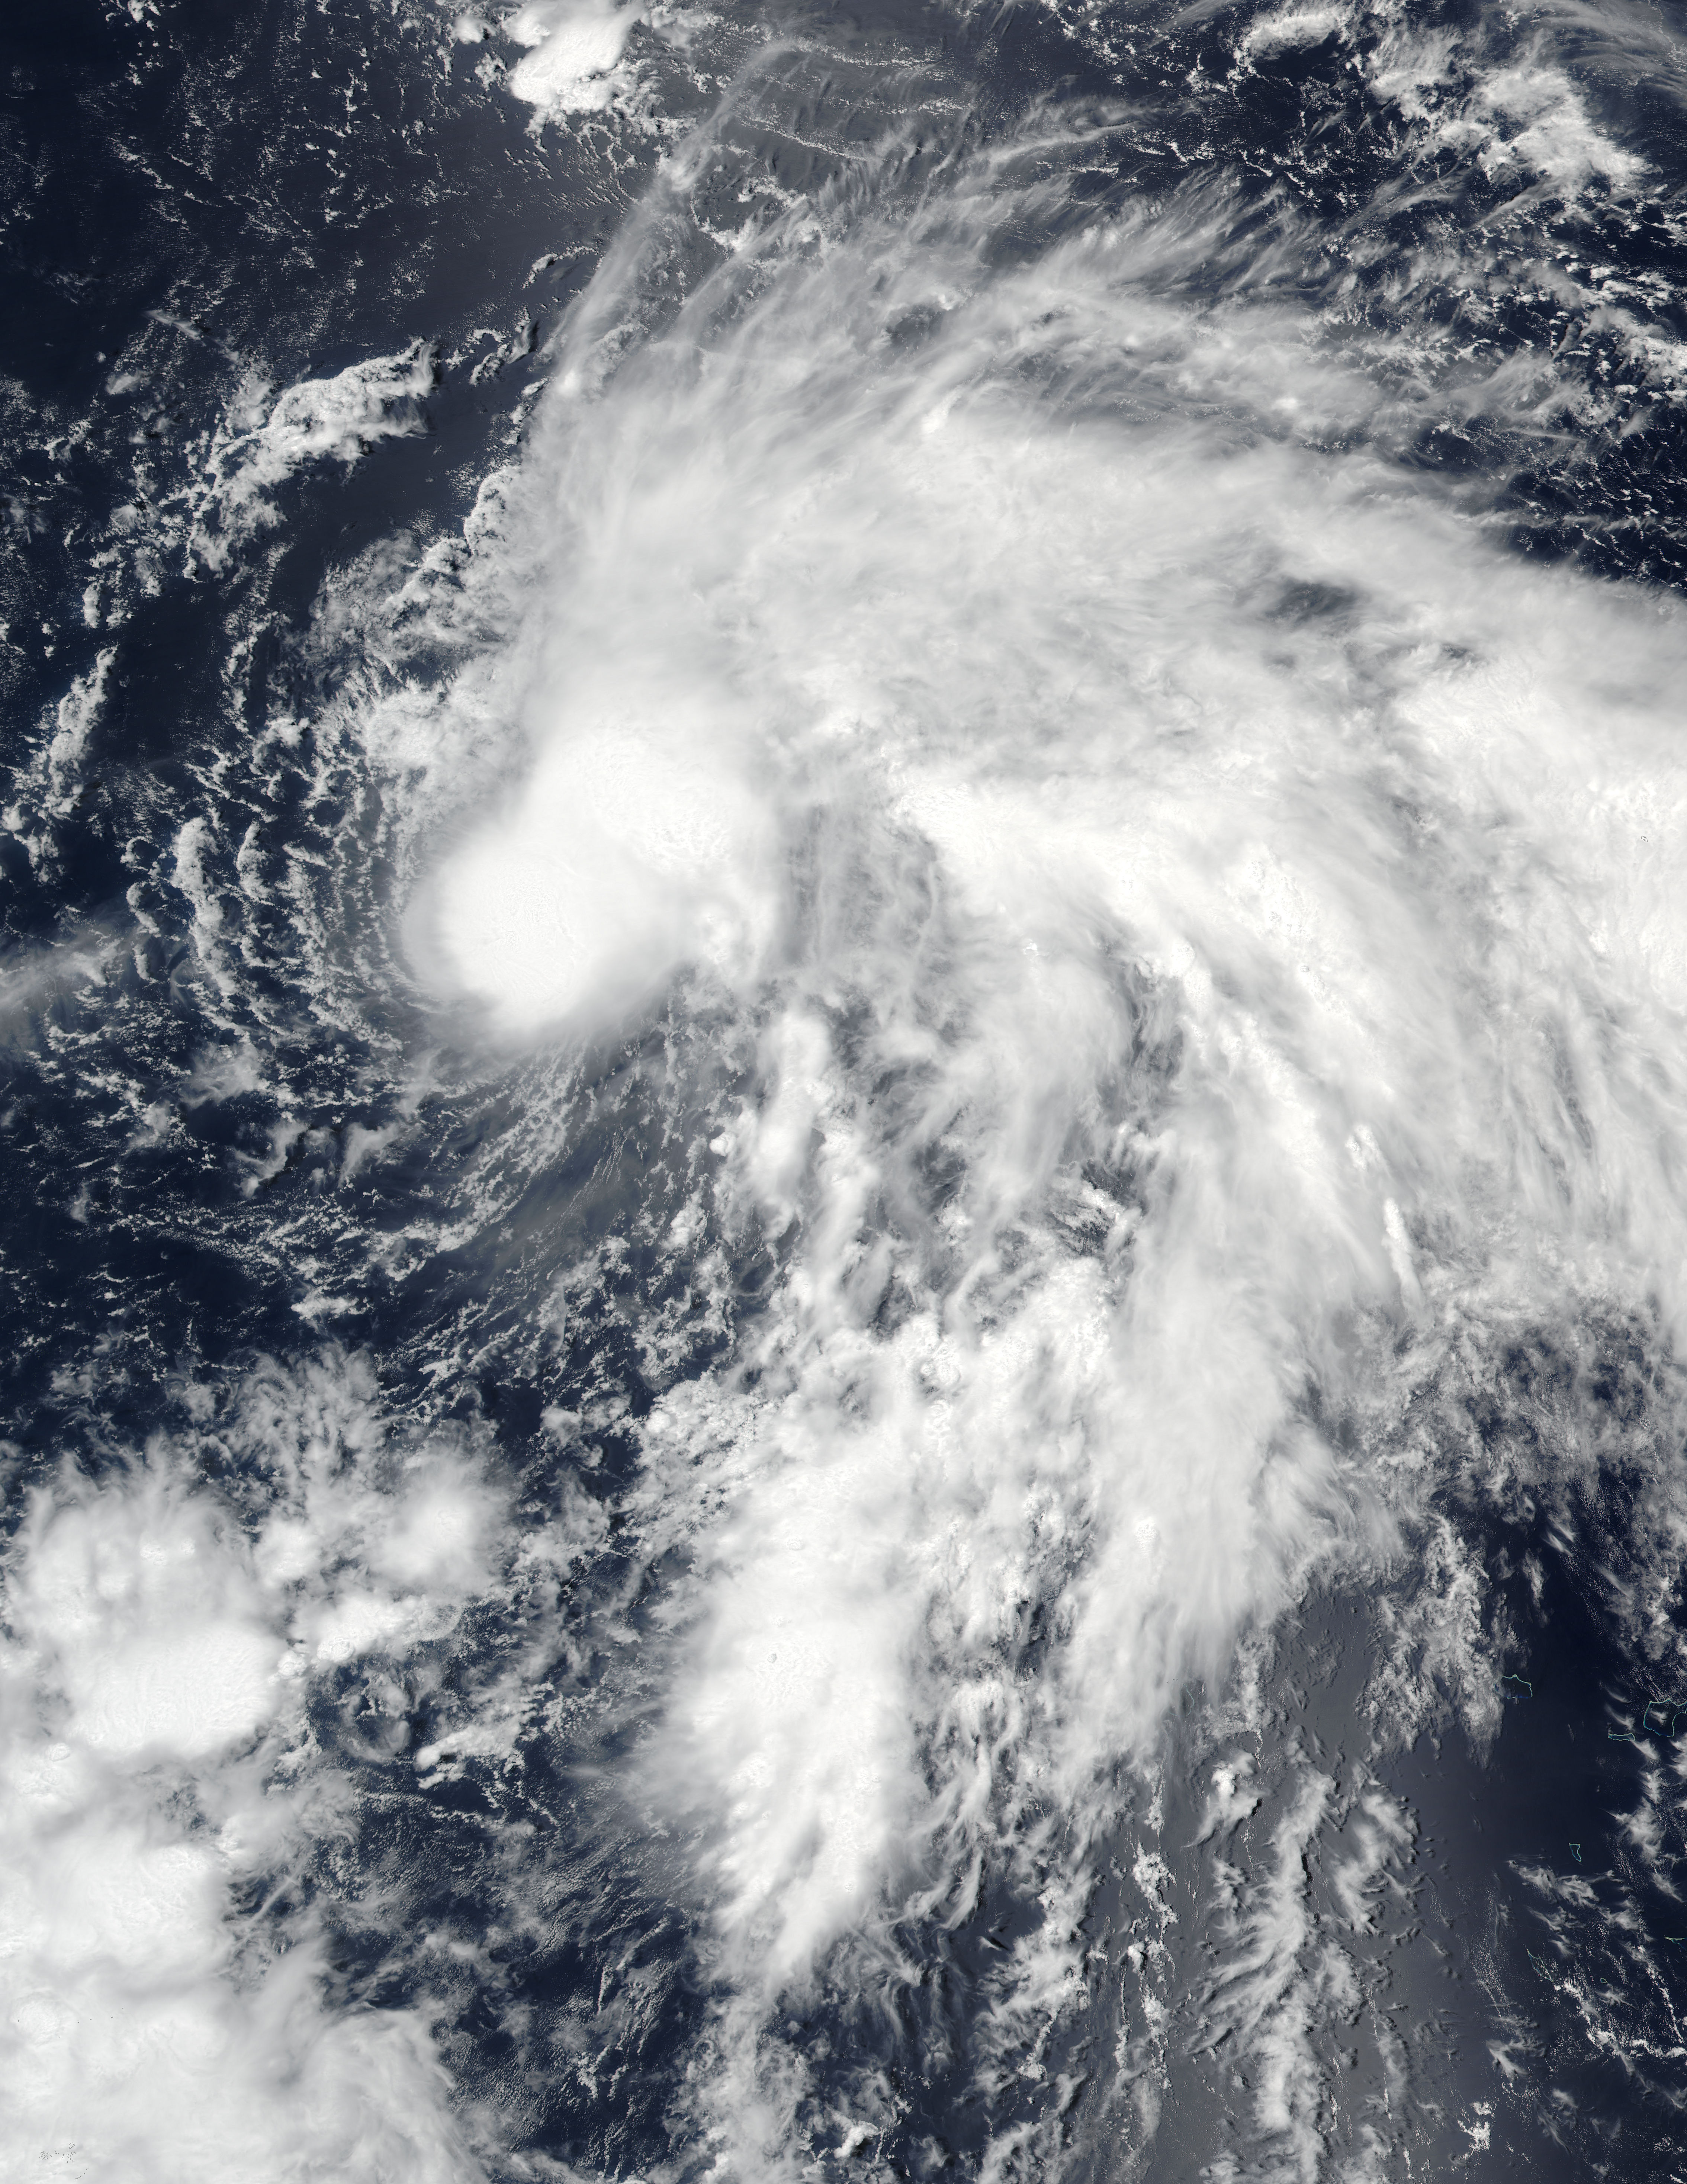
Soon after Tropical Depression 08W strengthened into Tropical Storm Conson, NASA-NOAA’s Suomi NPP satellite passed overhead from space and provided a look at the storm, revealing it was battling wind shear.
On August 8 at 10:44 p.m. EDT (Aug. 9 at 02:44 UTC) the Visible Infrared Imaging Radiometer Suite (VIIRS) instrument aboard NASA-NOAA’s Suomi NPP satellite captured a visible light image of Tropical Storm Conson. Southwesterly wind shear has pushed the bulk of clouds and showers to the northeast of the storm’s center. Fragmented bands of thunderstorms over the southern semi-circle were seen wrapping into the north quadrant of the exposed low-level center.
At 5 a.m. EDT (0900 UTC) on August 9, 2016 Tropical storm Conson was centered near 17.0 degrees north latitude and 158.7 degrees east longitude, about 382 nautical miles northwest of the Enewetak Atoll. The Enewetak Atoll is a large coral atoll of 40 islands and forms a legislative district of the Ralik Chain of the Marshall Islands.
Conson was moving to the west at 7 knots (8 mph/12.9 kph) and had maximum sustained winds near 35 knots (40 mph/62 kph).
Conson is expected to move into a more favorable environment that will allow it to intensify to typhoon strength over the open waters of the Northwestern Pacific Ocean on August 12, before weakening commences. The storm is expected to continue tracking in a northerly direction over the open ocean.
By Rob Gutro
NASA’s Goddard Space Flight Center, Greenbelt, Md.
Aug. 8, 2016 – NASA Gets an Infrared Look at Newly Formed Tropical Depression 08W
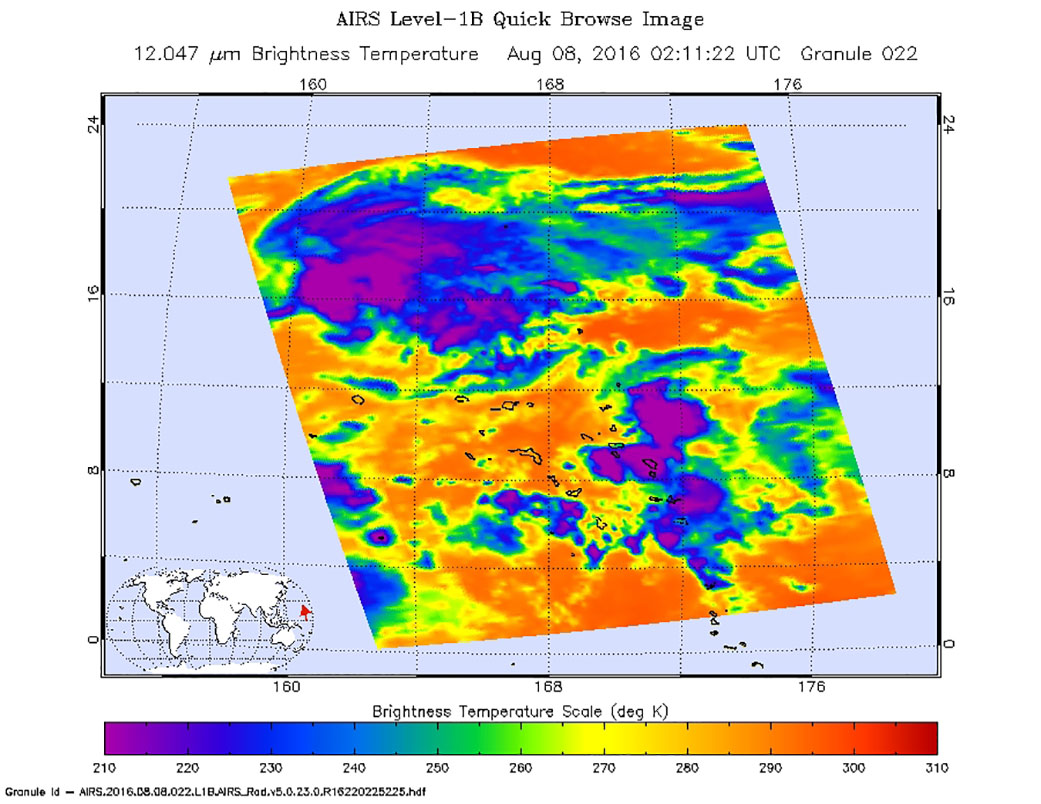
NASA’s Aqua satellite recently caught a look at the newly formed tropical depression in the Northwestern Pacific Ocean.
The Atmospheric Infrared Sounder or AIRS instrument aboard NASA’s Aqua satellite used infrared data to look at cloud top temperatures within Tropical Depression 08W on Aug. 7 at 10:11 p.m. EDT (Aug. 8 at 2:11 a.m. UTC). Forecasters at the Joint Typhoon Warning Center (JTWC) noted that animated enhanced infrared imagery “showed continued improvement in the convective structure (where thunderstorms are forming) with deep formative banding [of thunderstorms] wrapping into the low level circulation center.”
At 11 a.m. EDT (3 p.m. UTC) on Aug. 8, 2016, Tropical Depression 08W’s maximum sustained winds were near 34.5 mph (30 knots/55.5 kph). It was centered about 364 nautical miles west-southwest of Wake Island, near 17.9 degrees north latitude and 160.1 degrees east longitude. The depression was moving to the west-northwest at 4.6 mph (4 knots/7.4 kph).
The JTWC forecast calls for this storm to continue to intensify as it turns to the northwest through open waters of the Northwestern Pacific Ocean. The storm is expected to reach typhoon strength by Aug. 11.
By Rob Gutro
NASA’s Goddard Space Flight Center, Greenbelt, Md.