


Extra-Tropical Alex Speeding Through North Atlantic
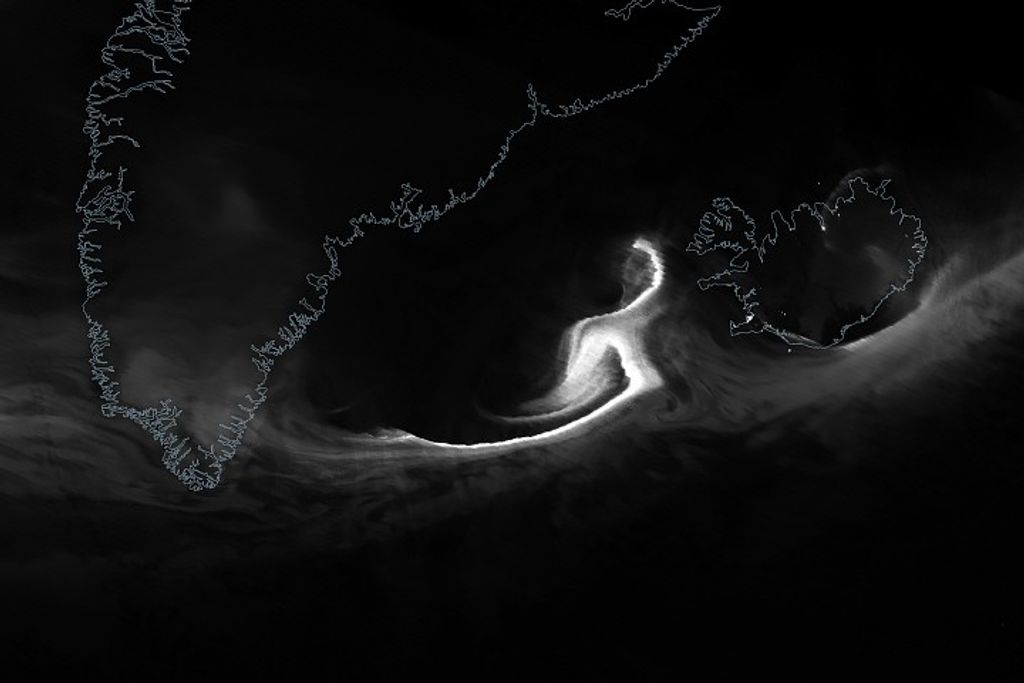
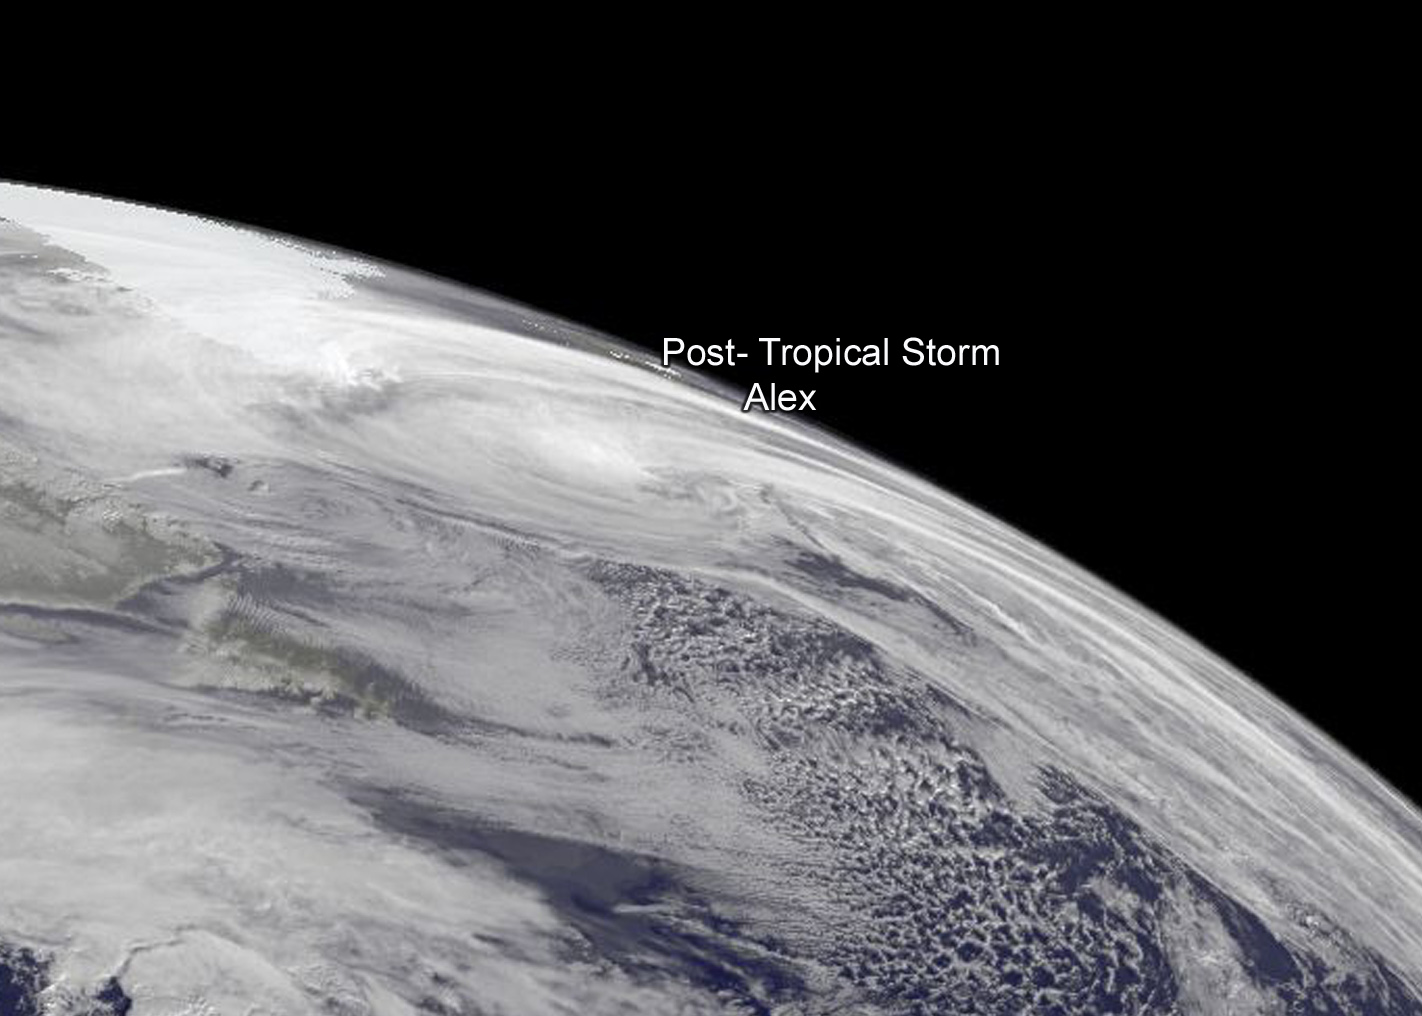
Tropical Storm Alex quickly acquired extra-tropical characteristics late on Jan. 15 as it sped northward toward Greenland in the North Atlantic Ocean. A GOES-East satellite image on Jan. 16 showed the elongated system south of Greenland.
Tropical Storm Alex became extra-tropical by Jan. 15 at 2100 UTC (4 p.m. EST). At that time the National Hurricane Center issued their final warning on the system and said “Satellite images and surface observations indicate that Alex has lost its tropical characteristics.”
Alex was located near 43.0 degrees north latitude and 27.8 degrees west longitude, about 290 miles (470 km) north of Terceira, Azores. Alex’s maximum sustained winds had dropped to 35 knots (40 mph/62 kph). Alex was speeding to the north at 35 knots (40 mph/62 kph) and had a minimum central pressure of 986 millibars.
A scatterometer pass on Jan. 15 showed that the system was losing its inner-core wind maximum, with the strongest winds well-removed to the northeast of the center.
On Saturday, January 16, NOAA’s GOES-East satellite captured a visible image of extra-tropical storm Alex. Both GOES and low-level microwave satellite images showed that Alex’s cloud pattern became elongated and now resemble a frontal shape.
NHC expects Alex to be just south of Greenland today, Jan. 16 at 1800 UTC (1 p.m. EST) near 56.3 degrees north latitude and 36.1 degrees west longitude. Maximum sustained winds increased to 75 mph but are expected to weaken quickly. By Jan. 17 at 1800 UTC (1 p.m. EST), Alex is expected be absorbed into another extra-tropical low pressure area.
Rob Gutro
NASA’s Goddard Space Flight Center
Jan. 15, 2016 – NASA Provides in-Depth Analysis of Unusual Tropical Storm Alex
NASA has provided forecasters with a variety of data on the out-of-season tropical cyclone Alex. The AIRS instrument aboard NASA’s Aqua satellite provided valuable temperature data, the RapidScat instrument identified the strongest winds, the GPM core satellite provided rainfall rates and cloud heights, and NASA-NOAA’s Suomi NPP satellite provided a visible image of the storm.
Alex is a Rare Storm
Alex officially became a hurricane on Jan. 14, 2016 at 11:00 a.m. Atlantic Standard Time (AST) with maximum sustained winds estimated at 85 mph by the National Hurricane Center (NHC), making it the earliest hurricane to form in the Atlantic since 1938, when the first storm of the season became a hurricane on January 4. As with Alex, that storm too originated from an extra-tropical low pressure center.
The last hurricane to occur in January was Hurricane Alice in 1955, but Alice had already become a hurricane in the year before at the end of December and survived into January. NHC declared Alex to be a subtropical storm on Wednesday afternoon, January 13 when it was about 785 miles south- southwest of the Azores.
Alex began from an area of low pressure that formed about a week ago along an old frontal boundary that was draped across Cuba. This low gradually moved out into the central Atlantic heading generally westward and began to produce thunderstorm activity as it started to curve northward toward the Azores. Often times, when extra-tropical storms acquire enhanced convection the instability is due to being over warm waters, but in Alex’s case it appears that the instability was due mainly to cold air aloft. At any rate, the heat release from these thunderstorms, which is known as latent heating, is what allowed Alex to eventually transform into a hurricane.
AIRS Measures Cloud Top Temperatures
The Atmospheric Infrared Sounder or AIRS instrument that flies aboard NASA’s Aqua satellite measured temperatures in Hurricane Alex’s cloud tops on Jan. 14 at 1429 UTC (9:29 a.m. EST). AIRS provides valuable temperature data for tropical cyclones such as cloud top and sea surface temperatures.
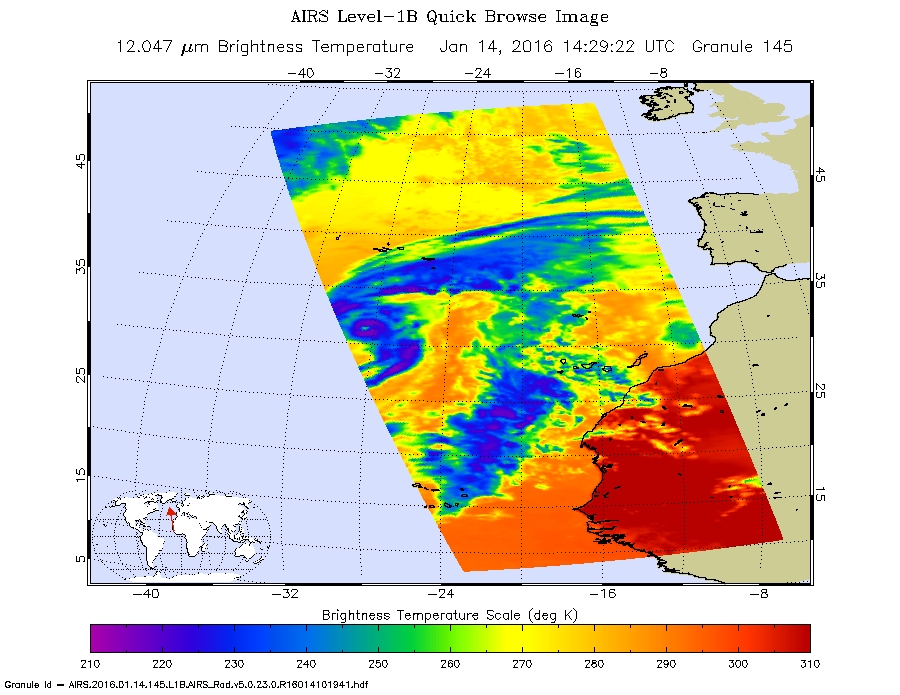
AIRS saw strongest storms with cloud top temperatures colder than minus 72.6 degrees Fahrenheit (minus 58.1 degrees Celsius) around the eye. NASA research has shown that storms with cloud tops that cold are powerful enough to generate heavy rain.
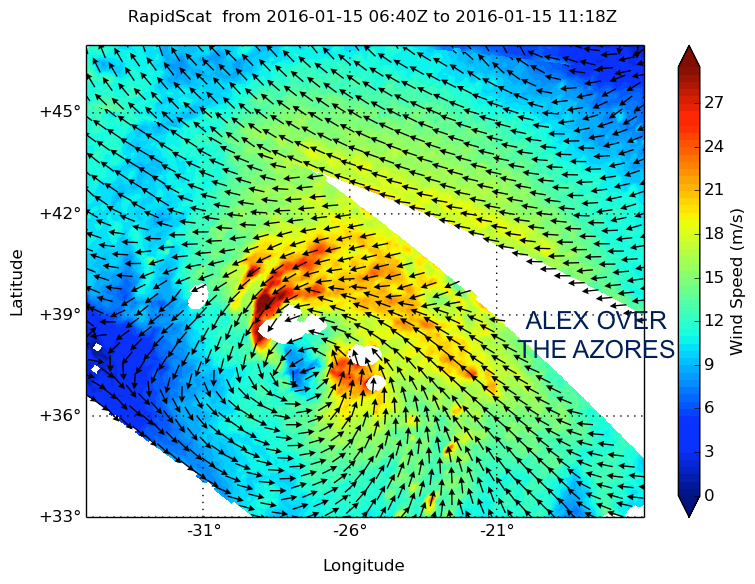
RapidScat Locates Strongest Winds
On Jan. 15 at 6 a.m. EST, RapidScat saw Hurricane Alex’s strongest winds affecting some islands in the Azores. Strongest winds were (red) north and northwest of the center at 30 meters per second (67.1 mph/ 108 kph). Maximum sustained winds are not always equally distributed in low pressure areas and the RapidScat instrument helps forecasters find the strongest quadrants of a storm. Tropical storm force winds extend outward up to 460 miles (740 km) from the center.
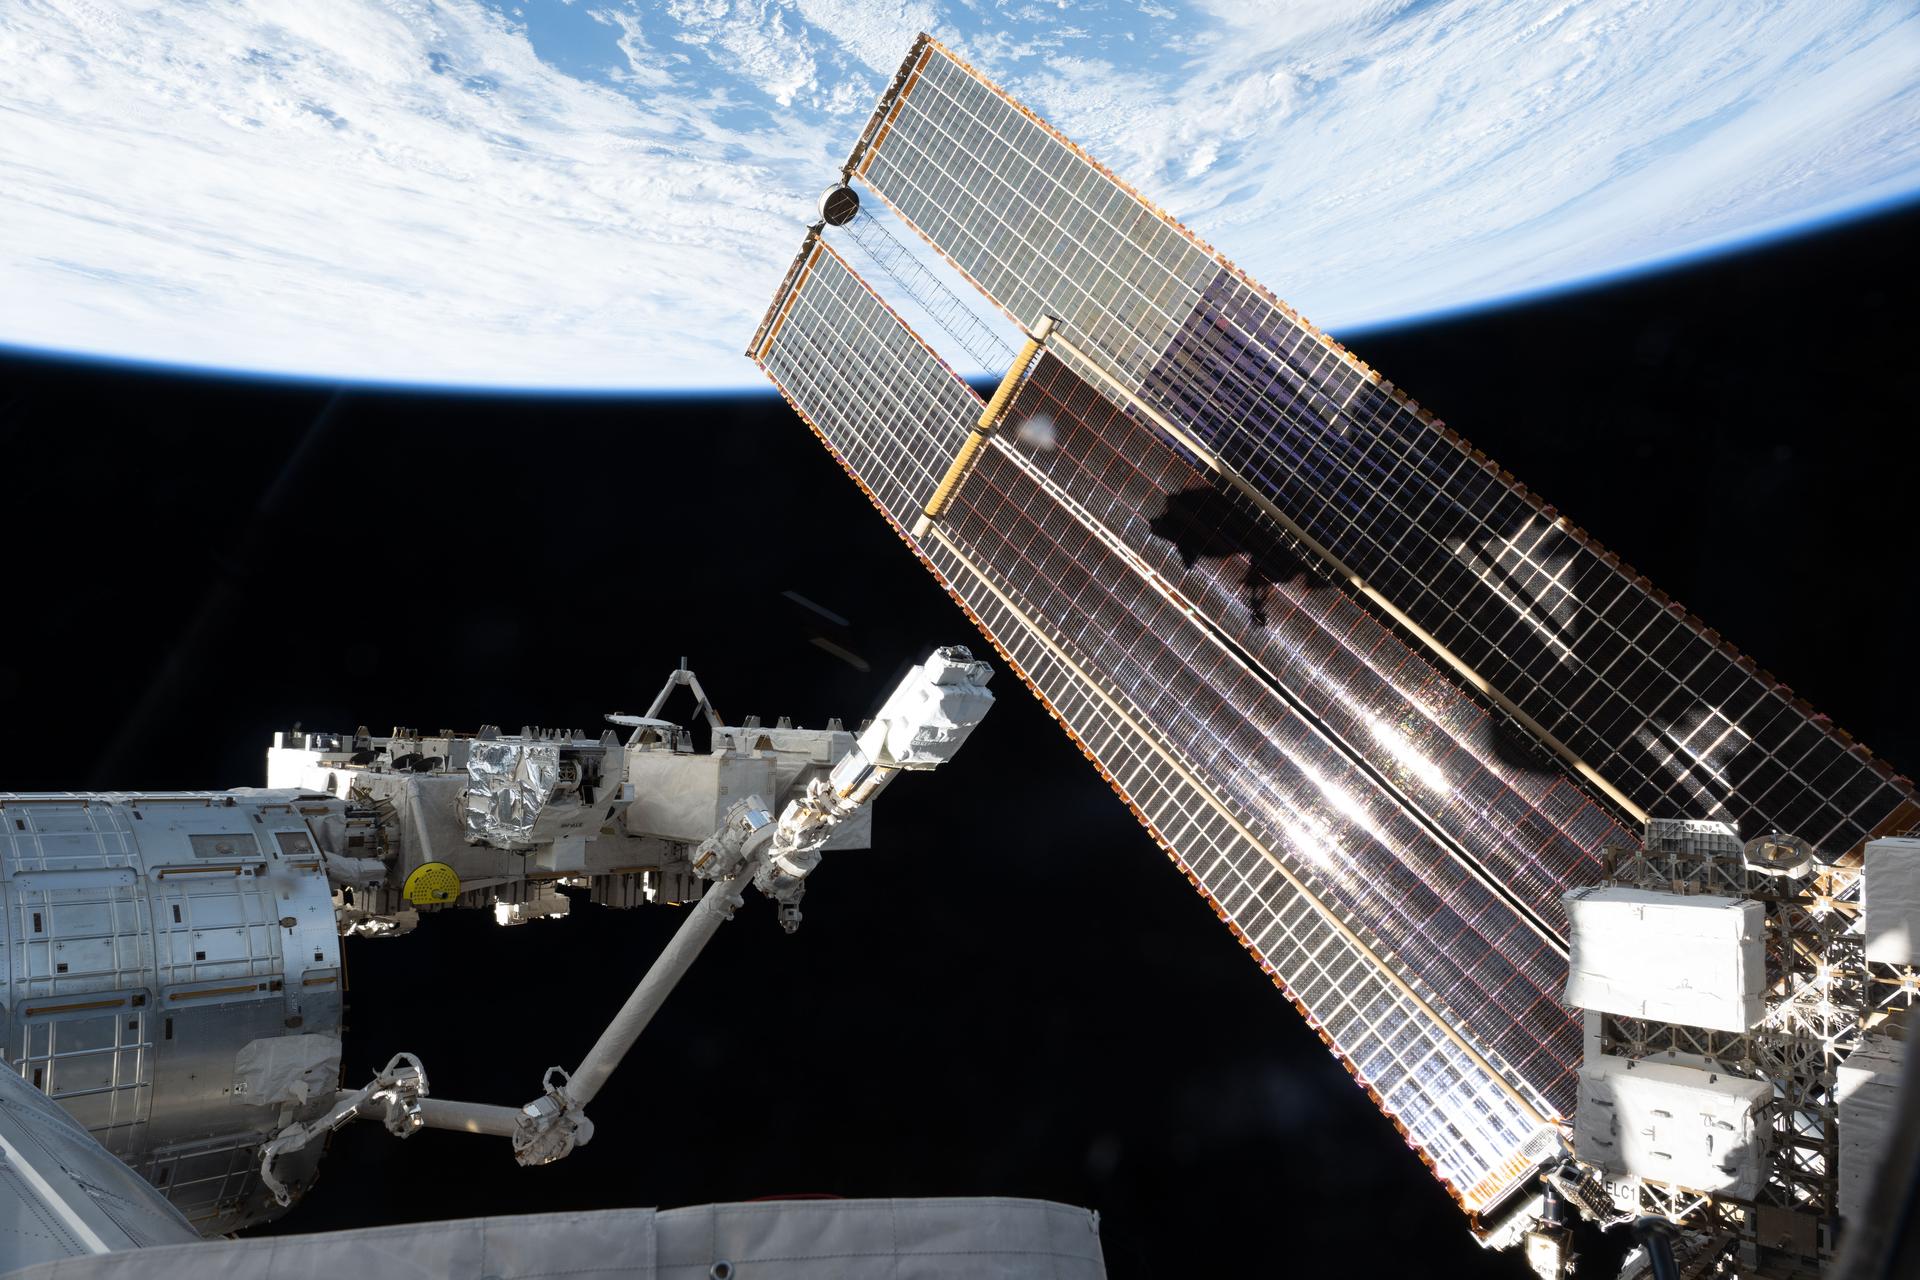
RapidScat is a NASA instrument that flies aboard the International Space Station.
GPM Satellite Measures Hurricane Alex’s Rainfall
The Global Precipitation Measurement or GPM core observatory satellite flew directly above hurricane Alex on January 15, 2016 at 1151 UTC (6:51 a.m. EST) collecting data in a rainfall analysis. Alex was moving into the Azores as a category one hurricane with maximum sustained winds estimated at 70 knots (80.5 mph). GPM’s Microwave Imager (GMI) and Dual-Frequency Precipitation Radar (DPR) found that rainfall intensity had decreased significantly since Alex was declared a hurricane on January 14, 2016.
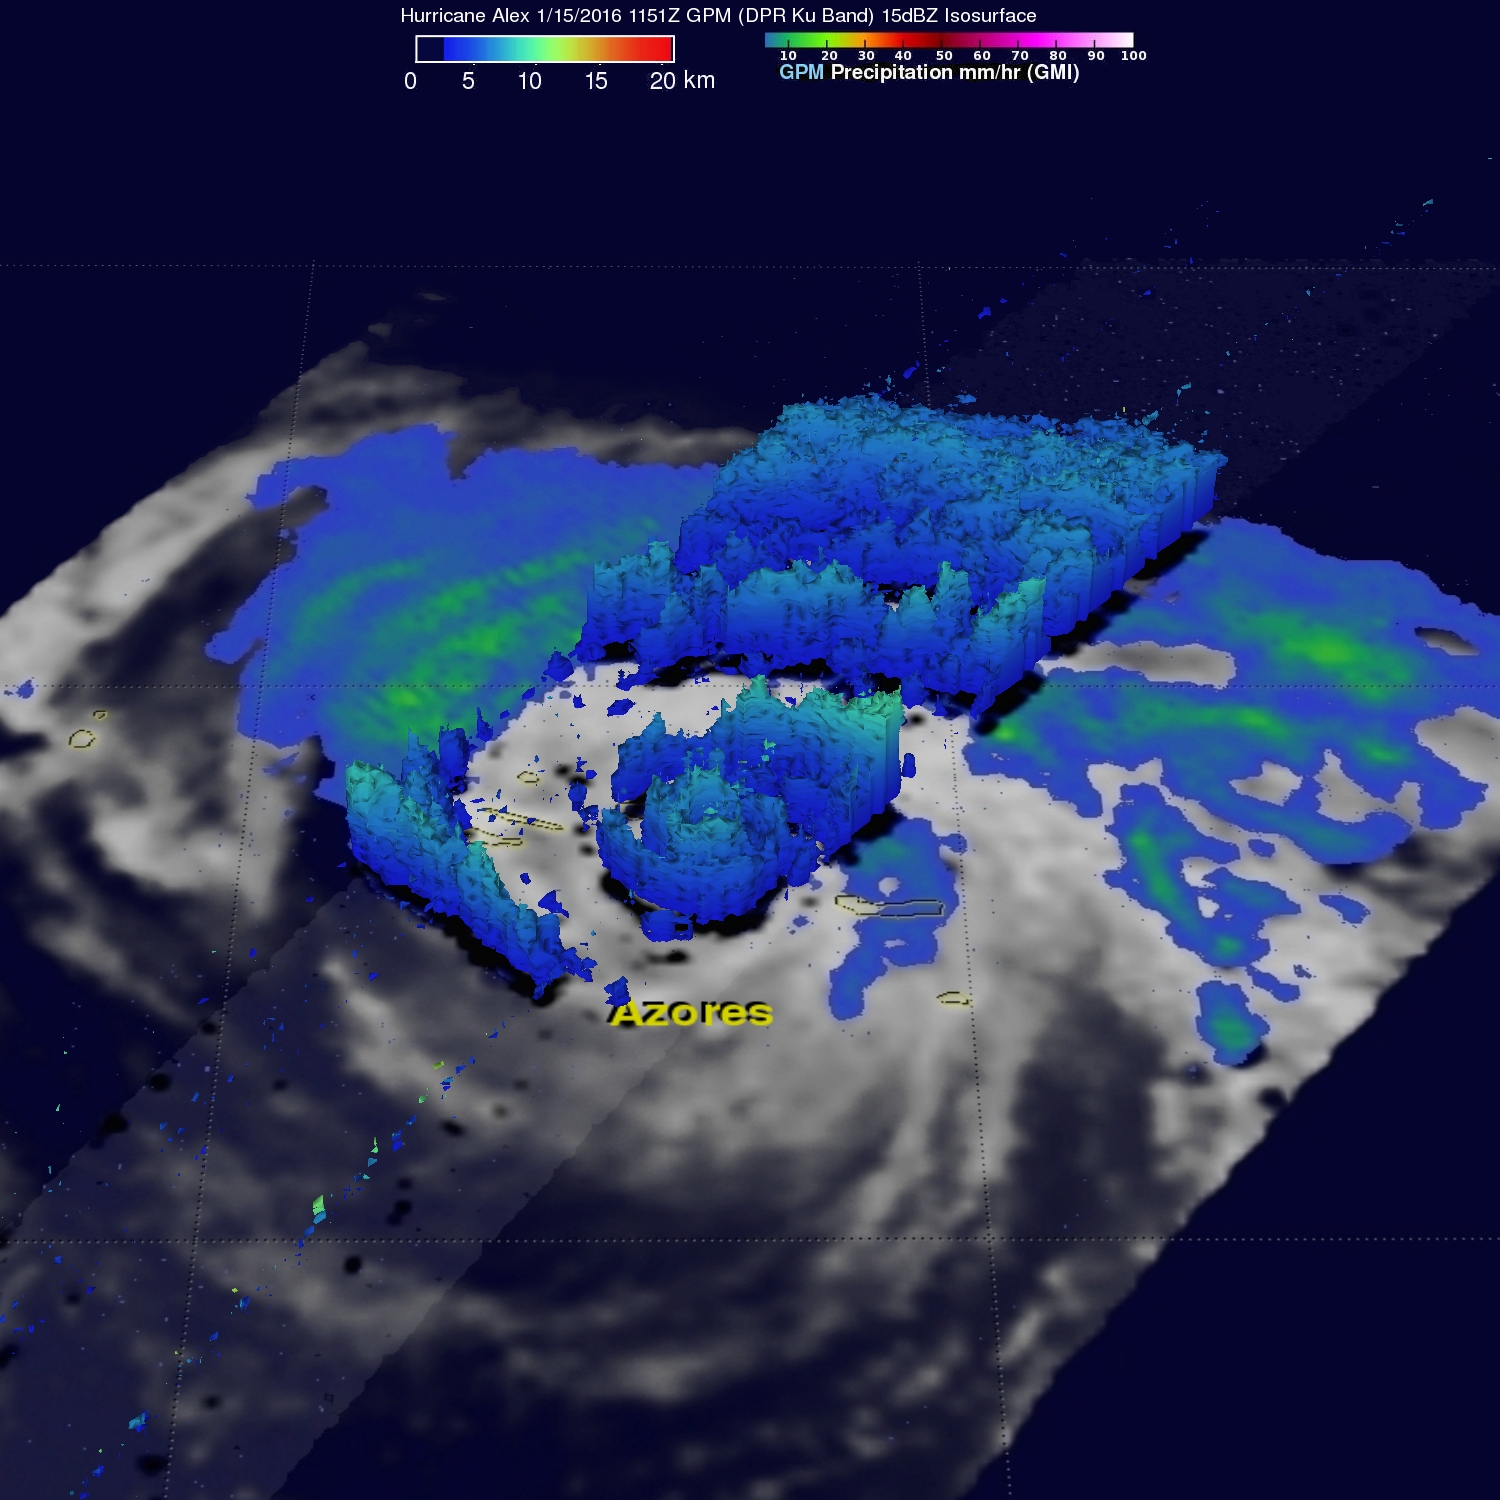
Most of the rainfall measured by GPM’s DPR was measured at less than 20 mm (.8 inches) per hour. Also GPM’s radar (DPR Ku band) found that storm top heights were fairly low. The maximum storm top heights northwest of Alex’s cloudy eye were found to reach altitudes of 9.9 km (6.1 miles).
Credits: NASA/JAXA/SSAI/Hal Pierce
Alex’s Strength, Location and a Landfall
At 7 a.m. EST (1200 UTC) on Friday, January 15, 2016, Alex was still a hurricane with maximum sustained winds near 75 mph (120 kph). It was located near 28.0 north latitude and 26.9 west longitude, just 50 miles (80 km) south-southeast of Terceira Island in the Central Azores, and about 105 miles (170 km) east-southeast of Faial Island in the Central Azores. Alex was moving to the north at 24 mph (39 kph) and had a minimum central pressure of 986 millibars.
The National Hurricane Center stated that satellite and surface data indicate that Alex made landfall on the island of Terceira around 915 AM AST (1315 UTC) as a tropical storm with an intensity of 70 mph (110 kph).
At 10 a.m. EST (1500 UTC), the center of Tropical Storm Alex was located near latitude 39.3 North and longitude 27.0 West. Alex was moving toward the north near 28 mph (44 kph) and a turn toward the north-northwest and northwest is expected over the next day or so. The estimated minimum central pressure is 986 millibars. Maximum sustained winds dropped to near 70 mph (110 kph) making Alex a tropical storm. Little change in strength is forecast during the next 48 hours. The National Hurricane Center said that “Alex is expected to lose tropical characteristics later today (Jan. 15).”
NASA-NOAA’s Suomi NPP Pictures Alex
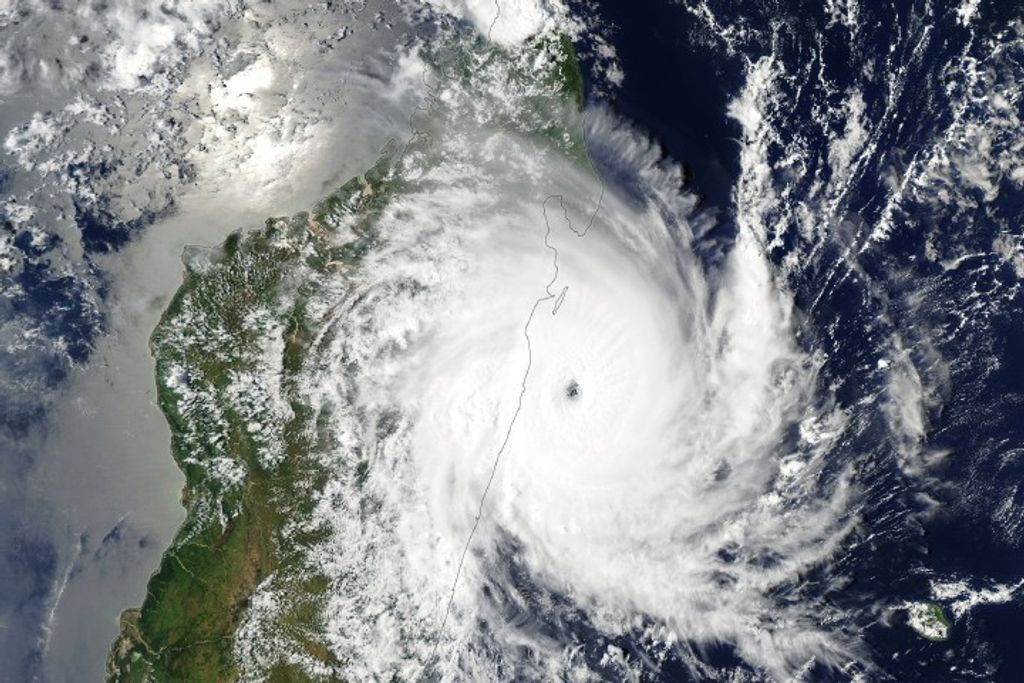
The Visible Infrared Imaging Radiometer Suite (VIIRS) instrument aboard NASA-NOAA’s Suomi NPP satellite captured a visible light image of Hurricane Alex at 14:20 UTC (9:20 a.m. EST) on Jan. 15 while it was moving through the Azores.
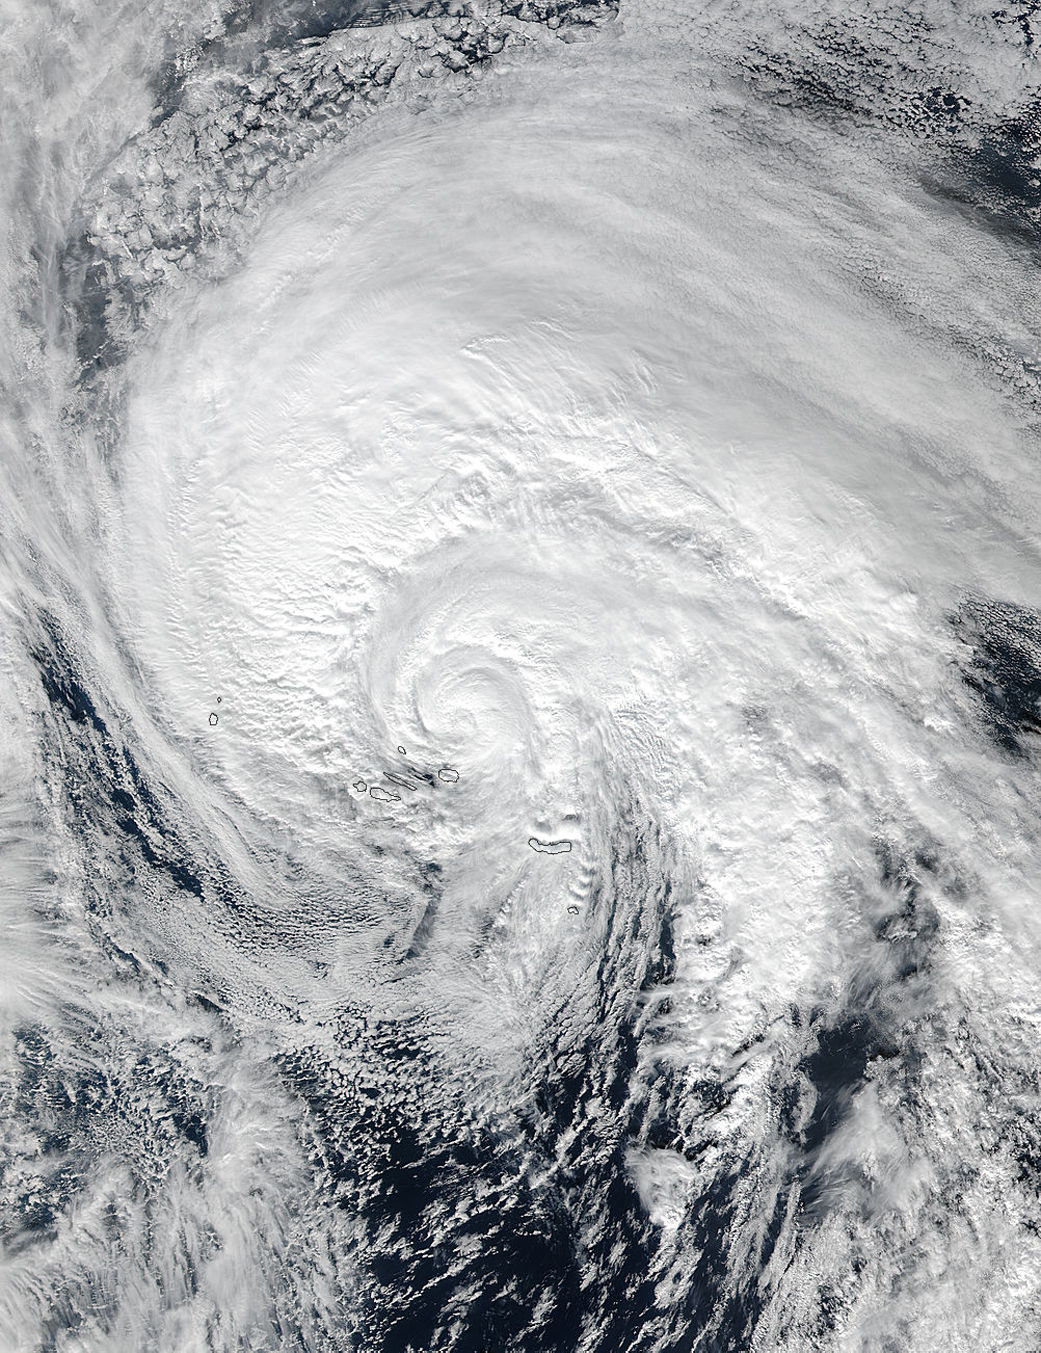
The image showed that the eye had become cloud-filled and bands of thunderstorms continued to circle the center of the storm, mostly in the western, northern and eastern quadrants. VIIRS collects visible and infrared imagery and global observations of land, atmosphere, cryosphere and oceans.
Alex’s Future
Alex continues to accelerate and a gradual turn to the northwest is expected. On Jan. 15 Forecaster Pasch of NOAA’s National Hurricane Center said that the post-tropical cyclone is forecast to merge with or become absorbed by another extra-tropical low within two days. For updates, visit NHC: www.nhc.noaa.gov
Rob Gutro/Steve Lang/Hal Pierce
NASA’s Goddard Space Flight Center
Jan. 14, 2016 – NASA Sees Formation of Unusual North Atlantic Hurricane Alex
The low pressure area known as System 90L developed rapidly since Jan. 13 and became Hurricane Alex on Jan. 14. Several satellites and instruments captured data on this out-of-season storm. NASA’s RapidScat instrument observed sustained winds shift and intensify in the system and NASA’s Aqua satellite saw the storm develop from a low pressure area into a sub-tropical storm. NOAA’s GOES-East satellite data was made into an animation that showed the development of the unusual storm.
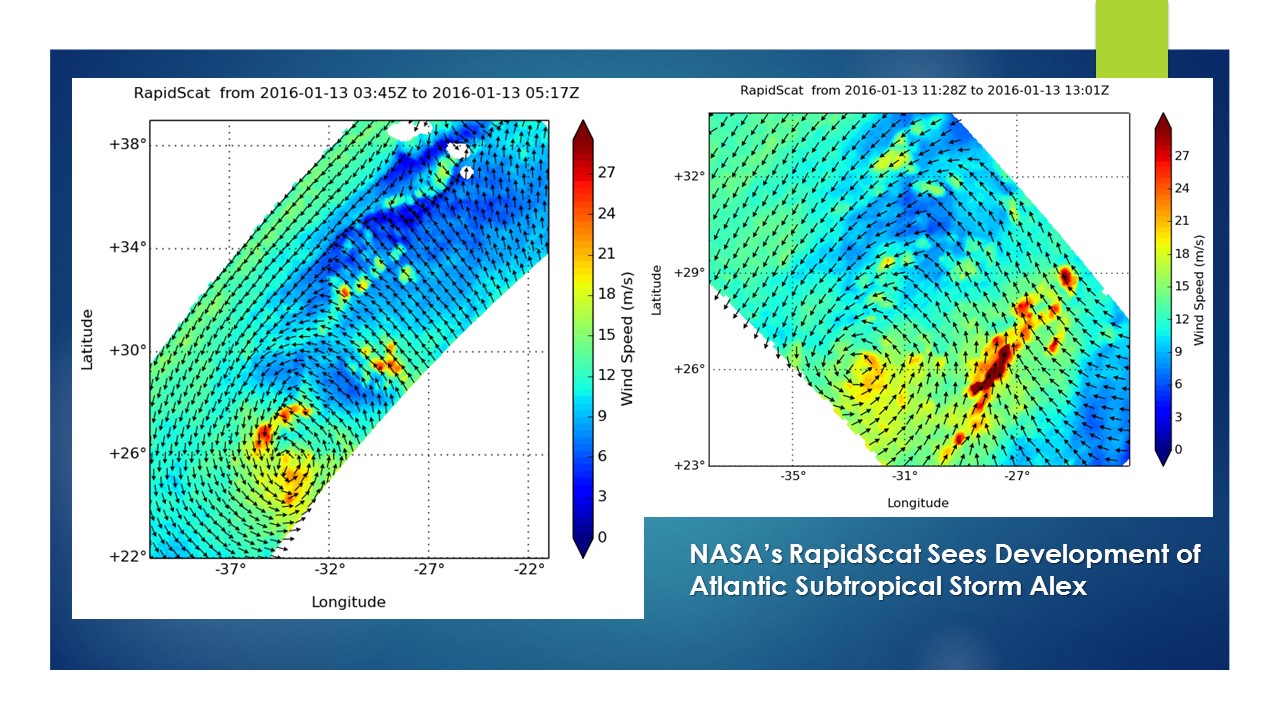
Twice on Jan. 13 NASA’s RapidScat instrument measured the strongest sustained winds in what was then a tropical low pressure area called “System 90L.” RapidScat flies aboard the International Space Station. RapidScat’s earliest view of System 90L showed strongest sustained winds were near 27 meters per second (mps)/60.4 mph/97.2 kph) and were located northwest of center. Eight hours later at 1200 UTC (7 a.m. EST) strongest sustained winds shifted east of center and increased to near 30 mps (67.1 mph/108 kph), making them tropical-storm force.
Later in the day at 2100 UTC (4 p.m. EST) satellite images indicated that the low pressure system developed into a subtropical storm and was named Alex. At the time, Alex was located near 27.1 degrees north latitude and 30.8 degrees west longitude, about 782 miles (1,260 km) south-southwest of the Azores.
By 1500 UTC (10 a.m. EST) on January 14, hurricane force winds extended outward up to 25 miles (35 km) from the center and tropical storm force winds extend outward up to 150 miles (240 km).
Credits: NASA/NOAA GOES Project
An animation of GOES-East satellite visible and infrared imagery from Jan. 10 to 14 showed the development of Hurricane Alex in the Central Pacific Ocean. The animation was created at the NASA/NOAA GOES Project at NASA’s Goddard Space Flight Center in Greenbelt, Maryland. The animation showed the sub-tropical low pressure area consolidate quickly on Jan. 13 and reach hurricane status on Jan. 14, 2016.
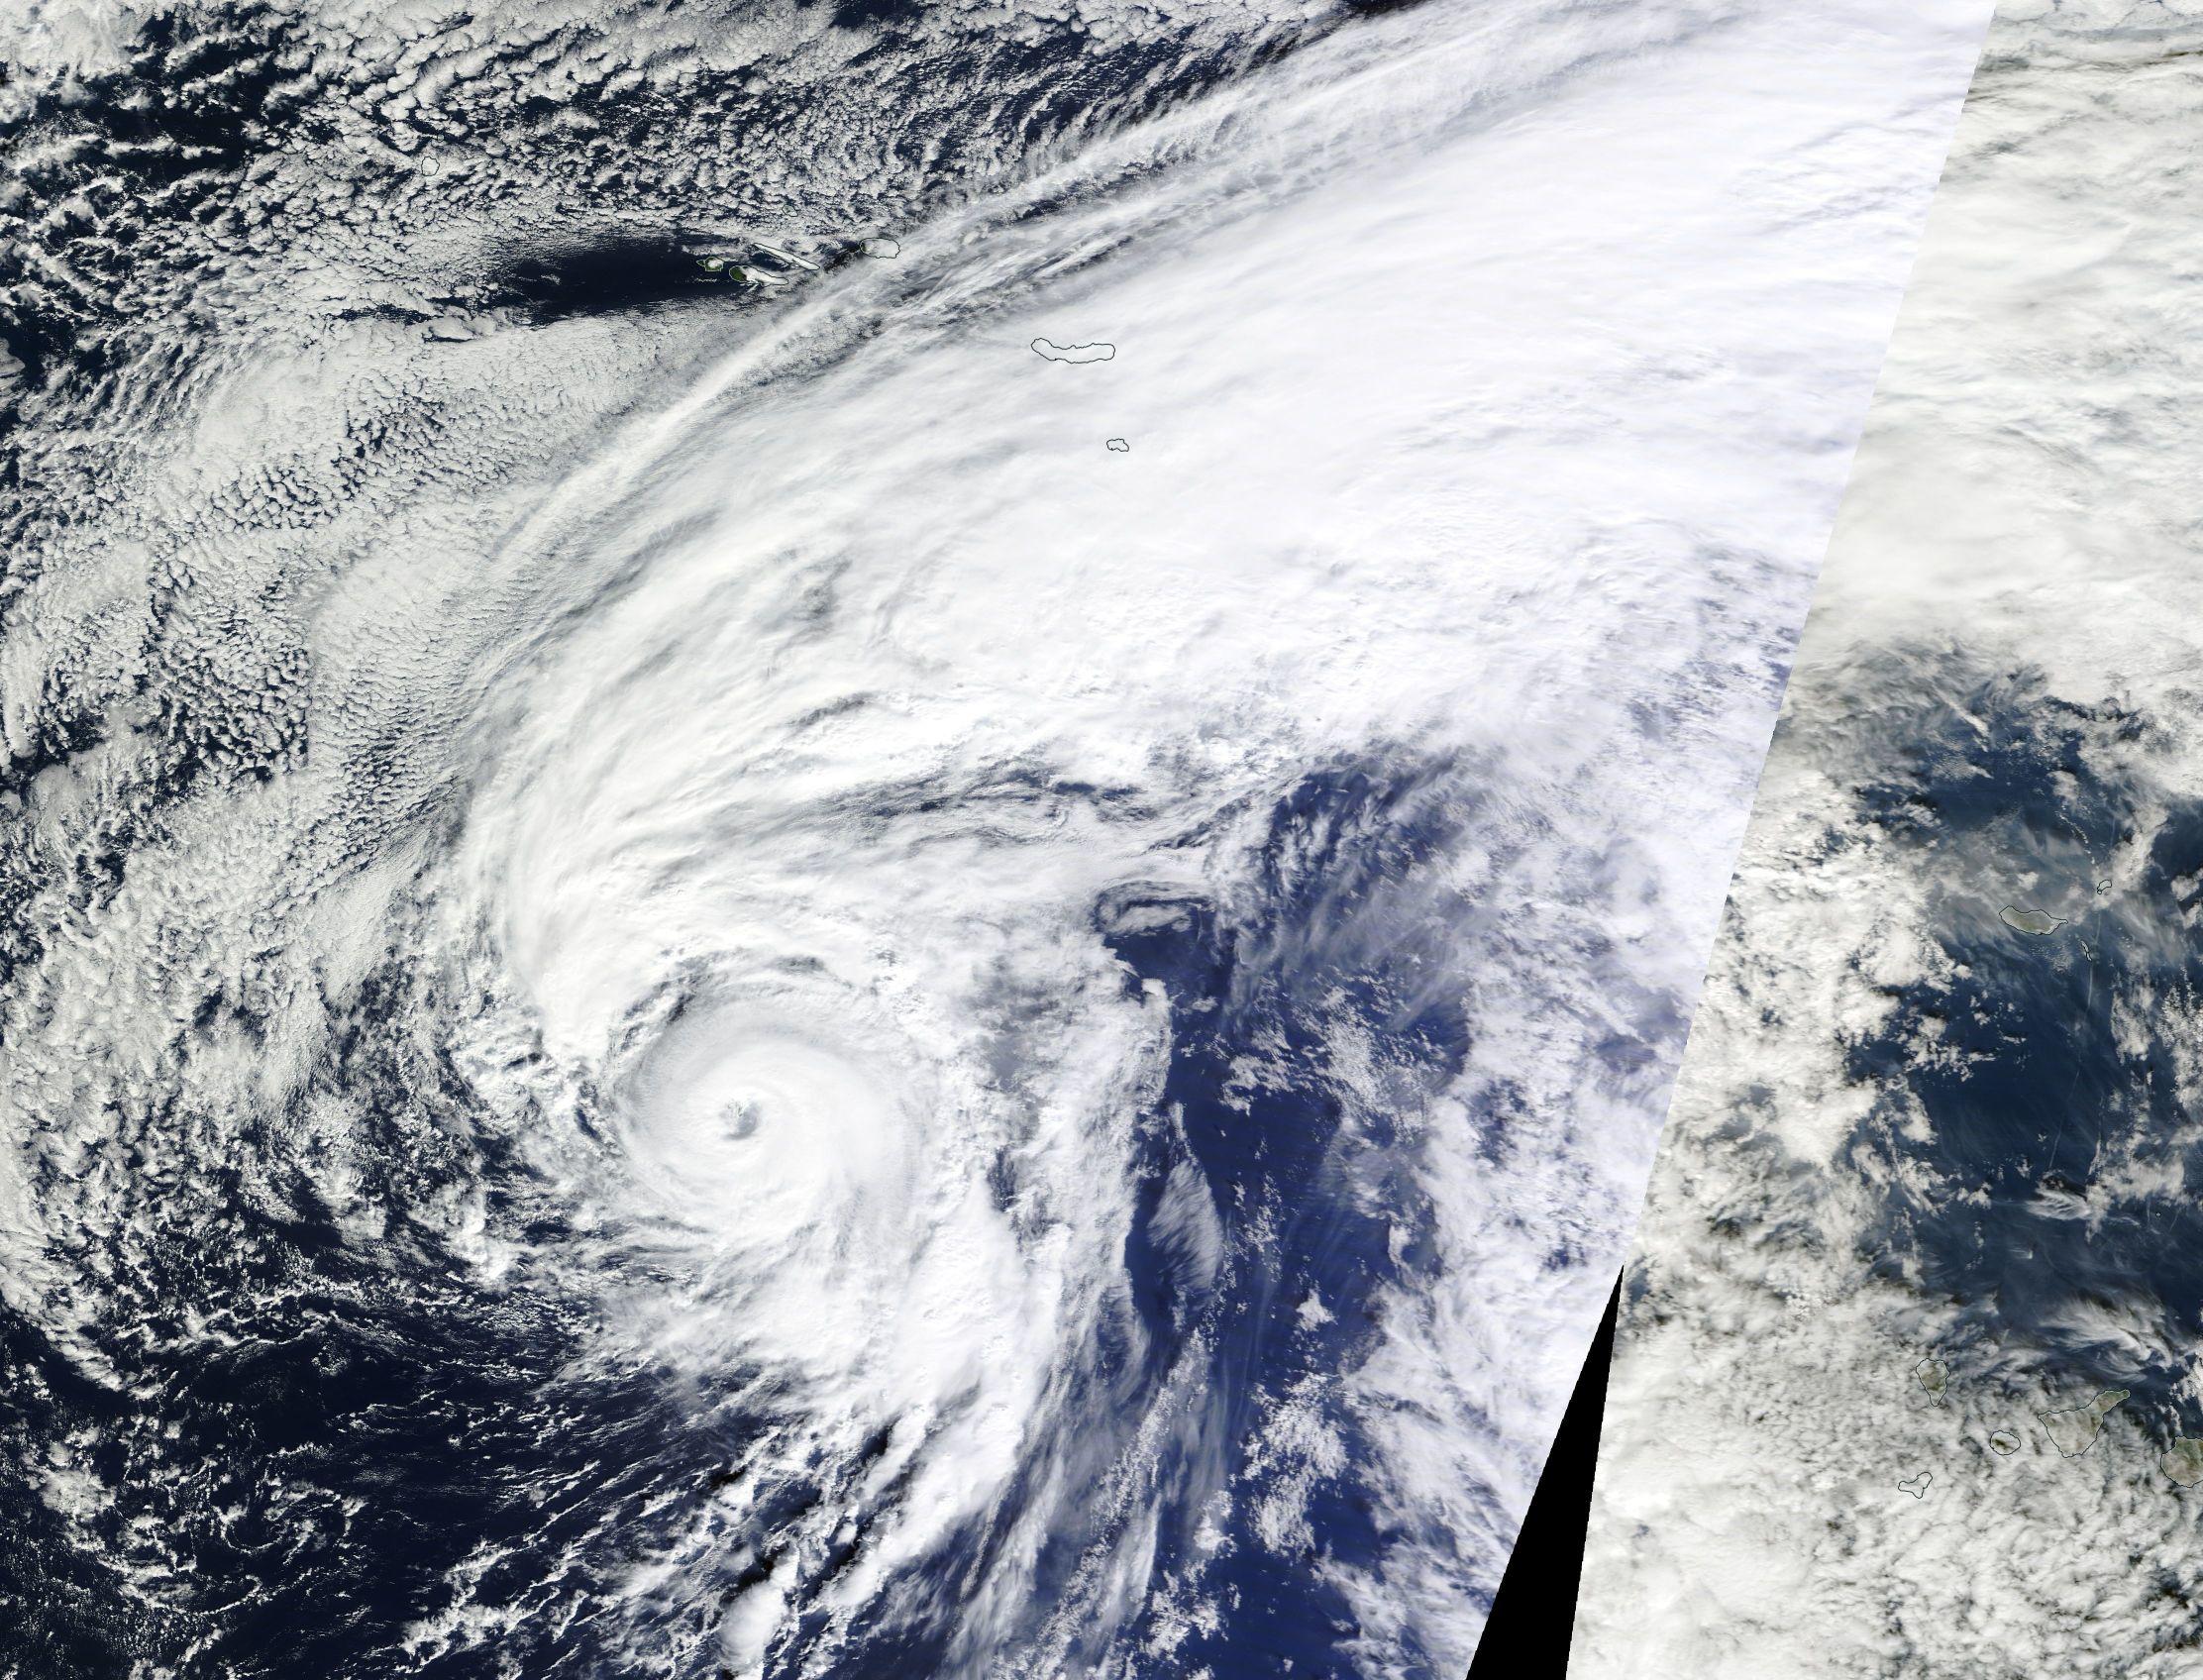
The Moderate Resolution Imaging Spectroradiometer or MODIS instrument that flies aboard NASA’s Aqua satellite captured a visible image of Hurricane Alex on Jan. 14 at 15:30 UTC (10:30 a.m. EST) in the central Atlantic Ocean. The image revealed an eye and showed bands of thunderstorms spiraling into the low level center of circulation.
According to the National Hurricane Center, Alex is the first hurricane to form in the month of January since 1938. Alex is also the first North Atlantic hurricane thriving in January since Alice of 1955, which formed on Dec. 30, 1954. Alice developed on December 30, 1954 from a trough of low pressure in the central Atlantic Ocean in an area of unusually favorable conditions.
The Azores Meteorological Service has issued a Hurricane Warning for the islands of Faial, Pico, Sao Jorge, Graciosa, and Terceira in the central Azores, and a Tropical Storm Warning for the islands of Sao Miguel and Santa Maria in the eastern Azores. A Hurricane Warning is in effect for Faial, Pico, Sao Jorge, Graciosa, and Terceira in the central Azores and a Tropical Storm Warning is in effect for Sao Miguel and Santa Maria in the eastern Azores.
At 10 a.m. EST (1500 UTC), the National Hurricane Center said that the center of Hurricane Alex was located near latitude 31.5 North, longitude 28.4 West. Alex was moving toward the north-northeast near 20 mph (31 kph) and a turn toward the north with an increase in forward speed is expected over the next day or two. On the forecast track, the center of Alex will move near or over portions of the Azores Friday morning, Jan. 15.
Maximum sustained winds are near 85 mph (140 kph) with higher gusts. Little change in strength is forecast through Friday. The estimated minimum central pressure is 981 millibars.
NHC’s Forecaster Pasch said “Remarkably, Alex has undergone the transformation into a hurricane. A distinct eye is present, embedded within a fairly symmetric mass of deep convection. It is very unusual to have a hurricane over waters that are near 20 degrees Celsius, but the upper-tropospheric temperatures are estimated to be around -60 degrees Celsius, which is significantly colder than the tropical mean. The resulting instability is likely the main factor contributing to the tropical transition and intensification of Alex.”
Alex is expected to maintain hurricane status on Friday, Jan. 15 and transition into an extra-tropical storm by Jan. 16 as it continues to move north toward Greenland.
For updates on Alex, visit NOAA’s NHC website: www.nhc.noaa.gov .
Rob Gutro
NASA’s Goddard Space Flight Center
Jan. 13, 2016 – NASA Analyzes Winds and Rainfall in Unusual Atlantic System 90L
NASA’s RapidScat instrument and Global Precipitation Measurement or GPM core satellite analyzed the surface winds and rainfall rates occurring System 90L, an unusual storm in the Northern Atlantic Ocean, which may become subtropical.
For the past few days System 90L, a low pressure center far south-southwest of the Azores, has been monitored by the National Hurricane Center (NHC) for possible development into a subtropical or tropical storm.
This low pressure area was producing winds of over 52 knots (60 mph). The Atlantic hurricane season runs from June through November so a tropical storm developing this early in the year would be unusual but not unprecedented.
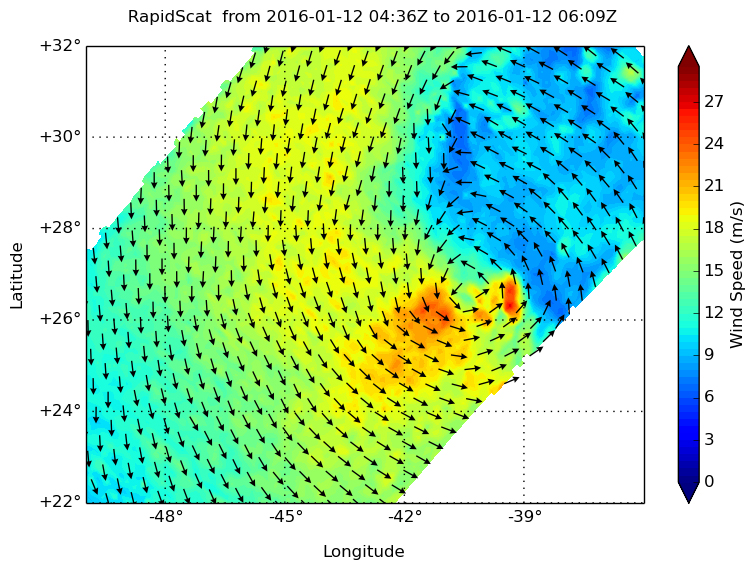
On Jan. 12 at 12 a.m. EST RapidScat saw System 90L’s strongest winds southwest and southeast of the low pressure center at 24 meters per second (53.6 mph/86.4 kph). Maximum sustained winds are not always equally distributed in a tropical cyclone and the RapidScat instrument helps forecasters find the strongest quadrants of a storm. RapidScat is an instrument that flies aboard the International Space Station.
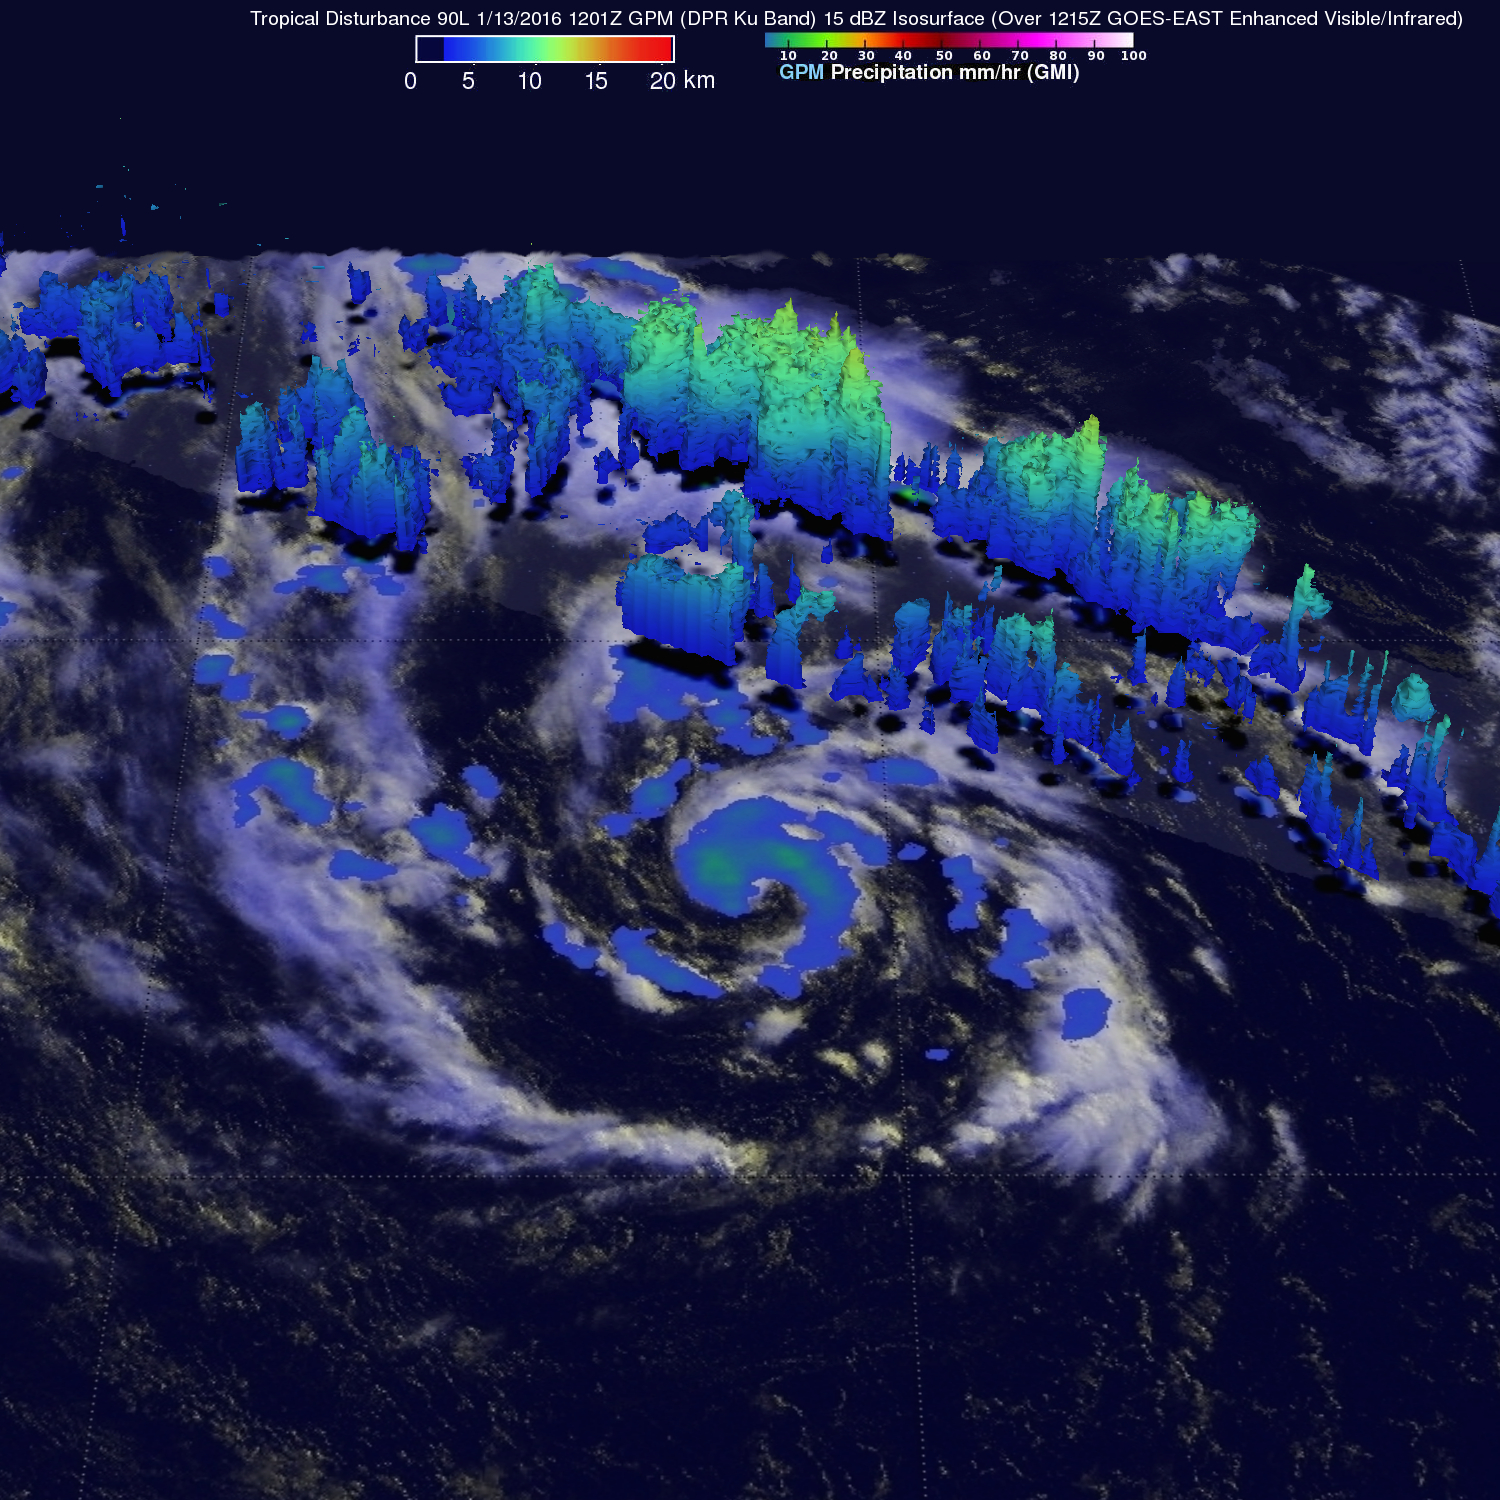
The GPM core observatory satellite is a joint effort between NASA and the Japan Aerospace Exploration Agency. GPM had an excellent daytime look at System 90L on January 13, 2016 at 1201 UTC (7:01 a.m. EST). GPM’s Microwave Imager (GMI) and Dual-Frequency Precipitation Radar (DPR) unveiled the rainfall pattern around this low pressure center. Precipitation derived from DPR showed that rain was heaviest in an intense band of storms east of the low’s center of circulation. Rain in a few powerful storms was measured falling at a rate of over 94 mm (3.7 inches) per hour. A 3-D examination of the precipitation within this band by GPM’s radar (DPR Ku band) found that some storm tops were reaching heights of almost 12.5 km (7.8 miles).
At 1:05 p.m. EST on Jan. 13, the National Hurricane Center noted that “Cloudiness and thunderstorms have become a little better organized since yesterday near the center of a low pressure system centered about 850 miles south-southwest of the Azores. If this organizing trend continues, advisories will be initiated on the system later today. The low is producing winds to near 50 mph over the southern portion of its circulation [as RapidScat also observed on Jan. 12], and is expected to move northeastward and northward over the eastern Atlantic over the next few days.”
NHC noted that interests in the Azores should monitor the progress of this system and strong gusty winds could begin to affect portions of those islands by late Thursday or early Friday, Jan. 15. The NHC gives this low pressure area a high chance to develop into a depression over the next two days.
For updates on System 90L, visit the NHC website: www.nhc.noaa.gov and Meteo France: http://www.meteofrance.com/accueil.
Harold F. Pierce / Rob Gutro
NASA’s Goddard Space Flight Center
Jan. 12, 2016 – NASA and NOAA Satellite Data See North Atlantic System More Concentrated
NASA and NOAA satellites continue to monitor the North Atlantic Ocean’s non-tropical low pressure system for hints of development into a subtropical storm. NASA’s Aqua satellite provided cloud top temperatures that show where strongest storms are within the larger system, and the storm appeared more consolidated on NOAA’s GOES-East satellite imagery.
NOAA’s National Hurricane Center (NHC) noted the development of the extra-tropical low pressure area on Sunday, January 10 at 1:50 p.m. EST.
The Atmospheric Infrared Sounder known as the AIRS instrument aboard NASA’s Aqua satellite measured temperatures in the system’s cloud tops on Jan. 11 at 0435 (Jan. 10 at 11:35 p.m. EST) and later at 1541 UTC (10:41 a.m. EST). AIRS provides valuable temperature data such as cloud top and sea surface temperatures. AIRS saw the coldest cloud top temperatures near -63F/-53C and strongest storms expanded from east of center to around the center of this out-of-season extra-tropical low pressure area.
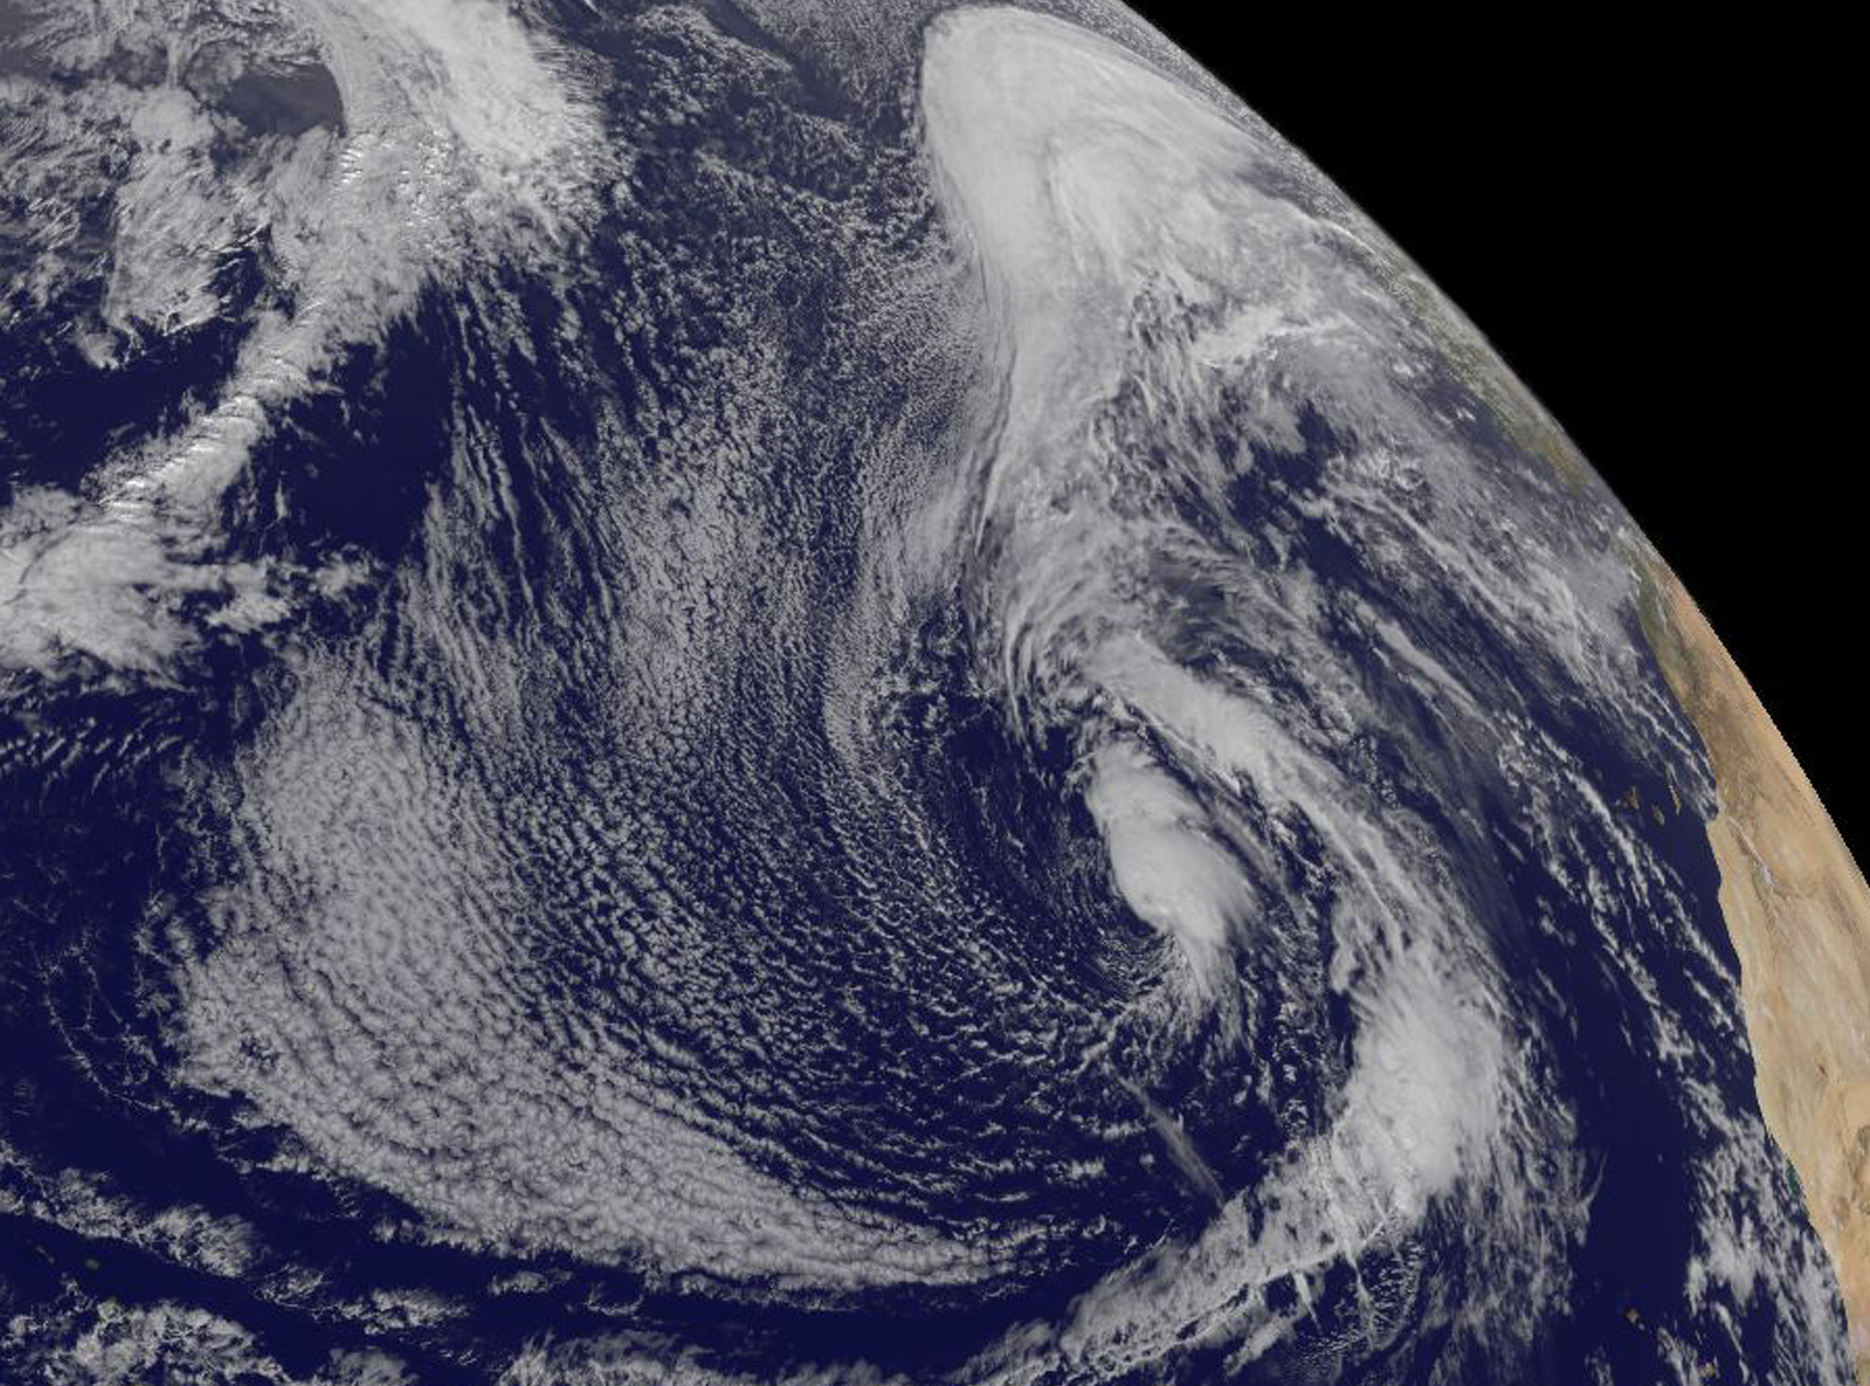
NOAA’s GOES-East satellite captured a visible image of the low pressure area on Jan. 12 at 1445 UTC (9:45 a.m.) EST. Clouds and storms surrounded the center of circulation and in a band east of the center. The low pressure area has been designated “System 90L.”
On Jan. 12 at 2 p.m. EST, the low was centered 1,100 miles southwest of the Azores, an archipelago in the mid-Atlantic. The National Hurricane Center noted that cloudiness and thunderstorms have become a little more concentrated and organized near the center of the storm’s circulation. The low was producing winds to near 60 mph over the southern and eastern quadrants of its circulation. The cyclone is expected to move eastward to northeastward over the eastern subtropical Atlantic over the next couple of days.
NHC said “Although environmental conditions are only marginally conducive for development, this system could become a subtropical or tropical storm within the next day or so. Regardless of subtropical or tropical cyclone formation, this system is expected to produce hazardous marine conditions over portions of the eastern Atlantic for the next few days.”
The National Hurricane Center gives this system a medium chance to develop into a depression over the next five days.
For updated forecasts, visit NHC at www.nhc.noaa.gov or the National Weather Service High Seas Forecast at http://www.opc.ncep.noaa.gov/shtml/NFDHSFAT1.shtml.
Rob Gutro
NASA’s Goddard Space Flight Center
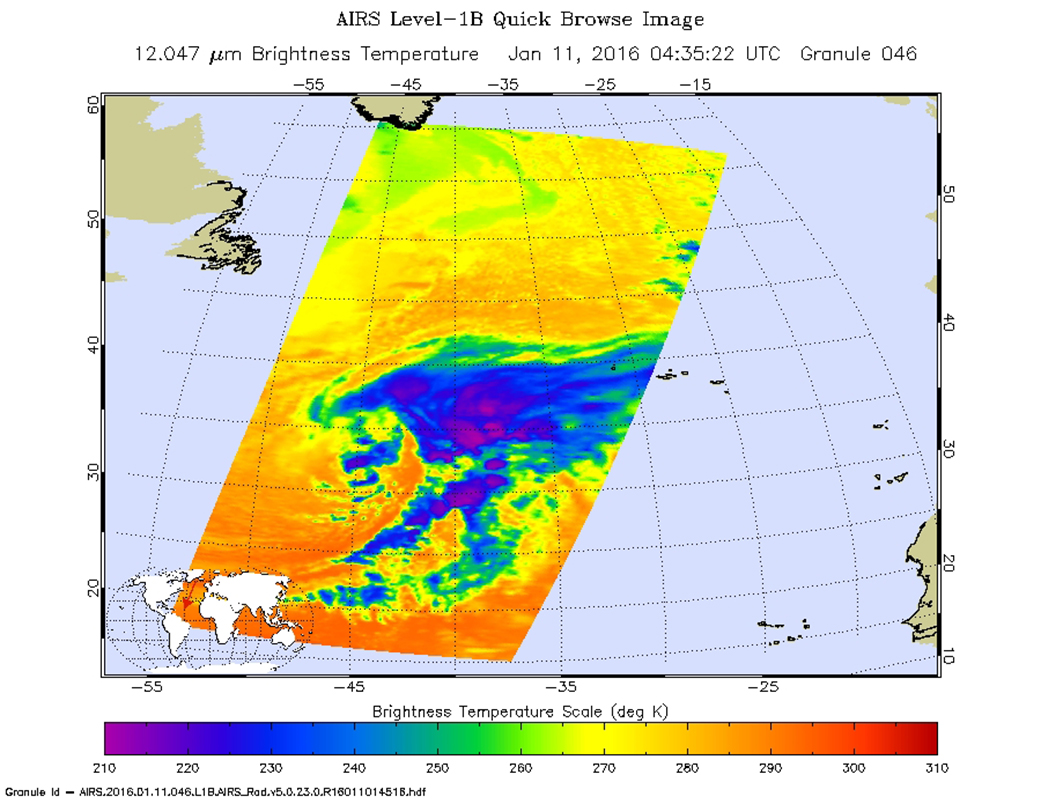
Jan. 11, 2016 – NASA Eyeing an Interesting Weather System in Northern Atlantic
A non-tropical low pressure system that has a possibility of developing subtropical characteristics has developed in the Northern Hemisphere tropics. During the week of January 4, Tropical Storm Pali developed in the Northern Central Pacific Ocean. On January 10 an area of low pressure developed in the Northern Atlantic Ocean, far to the east of Bermuda and NASA’s Aqua satellite captured a look at the system in infrared light.
NOAA’s National Hurricane Center (NHC) noted the development of the extra-tropical low pressure area on Sunday, January 10 at 1:50 p.m. EST. The system was about 900 miles east of Bermuda and is producing a large area of gale-force winds and maximum winds of hurricane force.
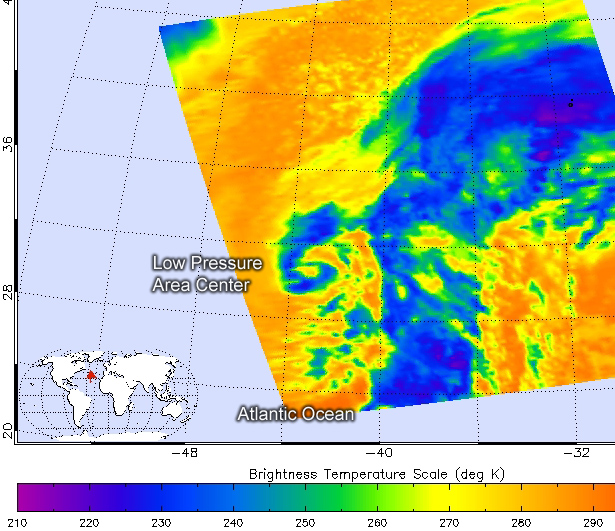
On Jan. 11 at 0435 UTC (Jan. 10 at 11:35 p.m. EST) the Atmospheric Infrared Sounder aboard NASA’s Aqua satellite captured infrared data on the system. AIRS provides valuable temperature data such as cloud top and sea surface temperatures. AIRS showed strongest storms with coldest cloud top temperatures near minus 63 degrees Fahrenheit (minus 53 degrees Celsius) east of the center of circulation.
By 1200 UTC (7 a.m. EST) the National Weather Service (NWS) High Seas Forecast (HSF) stated that there is an Atlantic Gale Warning in the area of the low pressure system. At that time, the low pressure area was centered just north of 31.5 degrees north latitude and 44 degrees west longitude, about 900 miles southwest of the Azores. Minimum central pressure was near 985 millibars. The NWS HSF said that cold front associated with the system extends from 31 degrees north latitude and 39 west longitude to 25 degrees north latitude and 40 west longitude to 19 degrees north and 50 degrees west to 19 degrees north and 57 degrees west. The clouds along that front are visible in the AIRS infrared image and look like a long tail that extends from the east of the low to the south of the low pressure center.
The National Hurricane Center (NHC) noted at 1400 UTC (2 p.m. EST) that the non-tropical low was producing a large area of gale-force winds with maximum winds near 60 mph. Shower activity was limited near the center, but NHC noted that the low could gradually acquire some subtropical or tropical characteristics during the next couple of days while it moves southeastward and then eastward into the eastern subtropical Atlantic. NHC said over the next 5 days this system has a 40 percent chance of becoming a depression.
NHC said “regardless of subtropical or tropical cyclone formation, this system is expected to produce hazardous marine conditions over portions of the central and eastern Atlantic for the next few days.”
For additional information, see at http://www.opc.ncep.noaa.gov/shtml/NFDHSFAT1.shtml.