


|
|
|
Related Links |
For more information contact: Krishna Ramanujan NASA Goddard Space Flight Center Greenbelt, Md. (Phone: 607/273-2561) Rani Chohan NASA Goddard Space Flight Center Greenbelt, MD (Phone: 301/286-2483) |
|
Viewable Images |
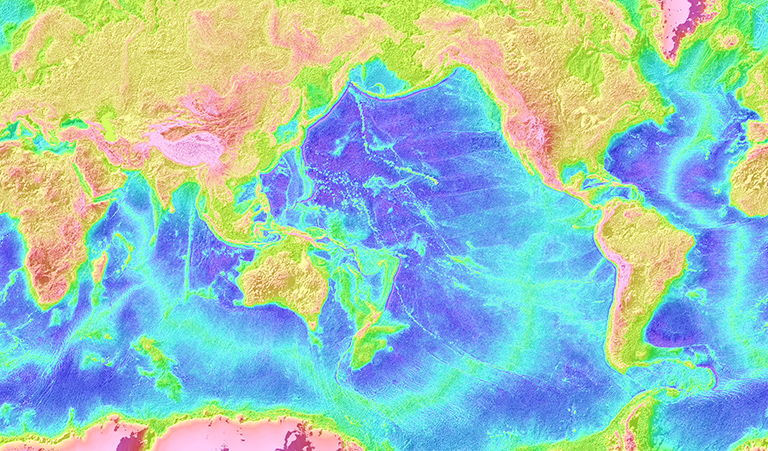
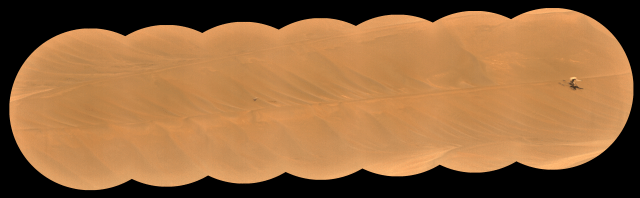
High Resolution images Item 1: Dust storm Item 2: NASA Model Simulations Item 3: Where Did the Rain Go? (Image 1, Image 2) Item 4: Precipitation Maps (Image 1, Image 2) Item 2: NASA Model Simulation Abnormal sea surface temperatures (SST) in the Pacific and the Atlantic Ocean played a strong role in the 1930s dust bowl drought. Scientists used SST data acquired from old ship records to create starting conditions for the computer models. They let the model run on its own, driven only by the observed monthly global sea surface temperatures. The model was able to reconstruct the Dust Bowl drought quite closely, providing strong evidence that the Great Plains dry spell originated with abnormal sea surface temperatures. This sequence shows the warmer than normal SST (red-orange) in that the Atlantic Ocean and colder than normal SST (blues) in the Pacific Ocean, followed by a low level jet stream that shifted and weakened reducing the normal supply of moisture to the Great Plains. Item 3: Where Did the Rain Go? This illustration shows how cooler than normal tropical Pacific Ocean temperatures (blues) and warmer than normal tropical Atlantic Ocean temperatures (red and orange) contributed to a weakened low level jet stream and changed its course. The jet stream normally flows westward over the Gulf of Mexico and then turns northward pulling up moisture and dumping rain onto the Great Plains. During the 1930s, this low level jet stream weakened, carrying less moisture, and shifted further south. The Great Plains land dried up and dust storms blew across the U.S. Item 4: Comparing Model Data to Actual These illustrations compare model and actual rainfall results. The first (top) image, model data, shows extensive drying throughout the Great Plains. The dark red represents the driest areas, followed by light red, then orange, and yellow, which is the least dry. The second (bottom) image shows observed rainfall maps. The observed results are quite similar to the model results. |
||||||||||||||||||||||||||||||||||||||||||||||||||||||||
|
|
|
Related Links |
For more information contact: Krishna Ramanujan NASA Goddard Space Flight Center Greenbelt, Md. (Phone: 607/273-2561) Rani Chohan NASA Goddard Space Flight Center Greenbelt, MD (Phone: 301/286-2483) |
|
Viewable Images |
High Resolution images Item 1: Dust storm Item 2: NASA Model Simulations Item 3: Where Did the Rain Go? (Image 1, Image 2) Item 4: Precipitation Maps (Image 1, Image 2) Item 2: NASA Model Simulation Abnormal sea surface temperatures (SST) in the Pacific and the Atlantic Ocean played a strong role in the 1930s dust bowl drought. Scientists used SST data acquired from old ship records to create starting conditions for the computer models. They let the model run on its own, driven only by the observed monthly global sea surface temperatures. The model was able to reconstruct the Dust Bowl drought quite closely, providing strong evidence that the Great Plains dry spell originated with abnormal sea surface temperatures. This sequence shows the warmer than normal SST (red-orange) in that the Atlantic Ocean and colder than normal SST (blues) in the Pacific Ocean, followed by a low level jet stream that shifted and weakened reducing the normal supply of moisture to the Great Plains. Item 3: Where Did the Rain Go? This illustration shows how cooler than normal tropical Pacific Ocean temperatures (blues) and warmer than normal tropical Atlantic Ocean temperatures (red and orange) contributed to a weakened low level jet stream and changed its course. The jet stream normally flows westward over the Gulf of Mexico and then turns northward pulling up moisture and dumping rain onto the Great Plains. During the 1930s, this low level jet stream weakened, carrying less moisture, and shifted further south. The Great Plains land dried up and dust storms blew across the U.S. Item 4: Comparing Model Data to Actual These illustrations compare model and actual rainfall results. The first (top) image, model data, shows extensive drying throughout the Great Plains. The dark red represents the driest areas, followed by light red, then orange, and yellow, which is the least dry. The second (bottom) image shows observed rainfall maps. The observed results are quite similar to the model results. |
|||||||||||||||||||||||||||||||||||||||||||||||||||||||||
| Related Links | |||||||||||||||||||||||||||||||||||||||||||||||||||||||||||||||
|
For more information contact: Krishna Ramanujan NASA Goddard Space Flight Center Greenbelt, Md. (Phone: 607/273-2561) Rani Chohan NASA Goddard Space Flight Center Greenbelt, MD (Phone: 301/286-2483) |
|||||||||||||||||||||||||||||||||||||||||||||||||||||||||||||||
|
Viewable Images | ||||||||||||||||||||||||||||||||||||||||||||||||||||||||||||||
| Viewable Images | |||||||||||||||||||||||||||||||||||||||||||||||||||||||||||||||
|
High Resolution images Item 1: Dust storm Item 2: NASA Model Simulations Item 3: Where Did the Rain Go? (Image 1, Image 2) Item 4: Precipitation Maps (Image 1, Image 2) Item 2: NASA Model Simulation Abnormal sea surface temperatures (SST) in the Pacific and the Atlantic Ocean played a strong role in the 1930s dust bowl drought. Scientists used SST data acquired from old ship records to create starting conditions for the computer models. They let the model run on its own, driven only by the observed monthly global sea surface temperatures. The model was able to reconstruct the Dust Bowl drought quite closely, providing strong evidence that the Great Plains dry spell originated with abnormal sea surface temperatures. This sequence shows the warmer than normal SST (red-orange) in that the Atlantic Ocean and colder than normal SST (blues) in the Pacific Ocean, followed by a low level jet stream that shifted and weakened reducing the normal supply of moisture to the Great Plains. Item 3: Where Did the Rain Go? This illustration shows how cooler than normal tropical Pacific Ocean temperatures (blues) and warmer than normal tropical Atlantic Ocean temperatures (red and orange) contributed to a weakened low level jet stream and changed its course. The jet stream normally flows westward over the Gulf of Mexico and then turns northward pulling up moisture and dumping rain onto the Great Plains. During the 1930s, this low level jet stream weakened, carrying less moisture, and shifted further south. The Great Plains land dried up and dust storms blew across the U.S. Item 4: Comparing Model Data to Actual These illustrations compare model and actual rainfall results. The first (top) image, model data, shows extensive drying throughout the Great Plains. The dark red represents the driest areas, followed by light red, then orange, and yellow, which is the least dry. The second (bottom) image shows observed rainfall maps. The observed results are quite similar to the model results. |
11 min read