


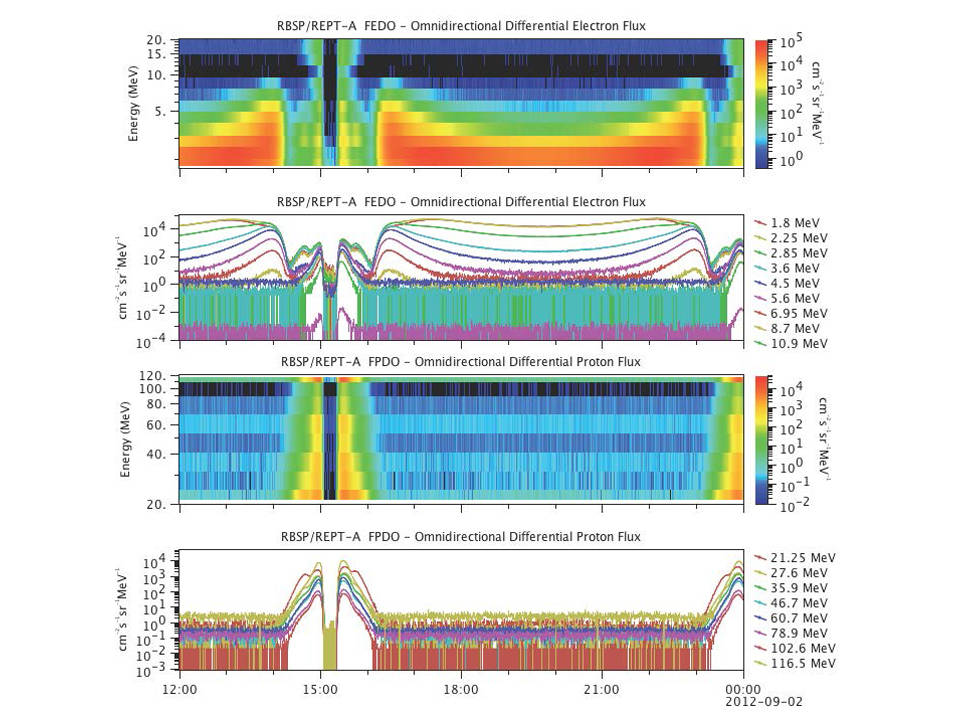
Data from REPT-A, powered up on Sept. 1, clearly shows the outer belt's high electron count (top two graphs) and the inner belt's high proton population (lower two graphs).
Data from REPT-A, powered up on Sept. 1, clearly shows the outer belt’s high electron count (top two graphs) and the inner belt’s high proton population (lower two graphs). The graphs provide an almost 3-D view of the belts’ particle populations, with the outer belt displaying as the two high electron peaks, and the inner belt as the high proton peaks; the area close to and including Earth is at the rough center point of the graphs. “These are textbook measurements of the outer belt, the slot between the belts, and the inner belt,” says LASP’s Daniel Baker. Credit: LASP/LANL/UNH› Link to associated news item