


If you’re fascinated by the idea of humans traveling through space and curious about how that all works, you’ve come to the right place.
“Houston We Have a Podcast” is the official podcast of the NASA Johnson Space Center from Houston, Texas, home for NASA’s astronauts and Mission Control Center. Listen to the brightest minds of America’s space agency – astronauts, engineers, scientists and program leaders – discuss exciting topics in engineering, science and technology, sharing their personal stories and expertise on every aspect of human spaceflight. Learn more about how the work being done will help send humans forward to the Moon and on to Mars in the Artemis program.
On Episode 216, Annmarie Eldering describes an experiment on the International Space Station that is gathering data on carbon dioxide around the globe. This episode was recorded on August 26, 2021.
![]()
Transcript
Gary Jordan (Host): Houston, we have a podcast! Welcome to the official podcast of the NASA Johnson Space Center, Episode 216, “The Breath of the Earth.” I’m Gary Jordan, and I’ll be your host today. On this podcast, we bring in the experts, scientists, engineers, and astronauts all to let you know what’s going on in the world of human spaceflight. The International Space Station allows us a great vantage point to look down at our home planet. A few episodes ago, we talked about the ECOSTRESS (ECOsystem Spaceborne Thermal Radiometer Experiment on Space Station) experiment with Dr. Kerry Cawse-Nicholson, which is looking at the temperature of the Earth in plants, urban areas, and more. She also brought up how data from other experiments feeds into our overall understanding of Earth science and mentioned one that is measuring carbon dioxide. Enter the Orbiting Carbon Observatory-3, or OCO-3, which is doing just that on a daily basis. It launched in 2019 and continues gathering data on atmospheric carbon from the OCO-2 experiment, that began in July 2014 in a polar orbit and is still there collecting data today. OCO-3 provides data from the space station’s orbit, which is 52 degrees north and 52 degrees south latitudes. On this episode, we get the scoop on what this is and why it’s important to help the planet from project scientist Dr. Annmarie Eldering at NASA’s Jet Propulsion Laboratory in California. So, let’s explore an experiment on the space station that’s watching the Earth breathe. Enjoy!
[ Music]
Host: Annmarie, thanks so much for coming on Houston We Have A Podcast today.
Annmarie Eldering: Thank you. I’m very excited to share a little bit about what we’re doing with OCO-3.
Host: Wonderful. First, I want to know a little bit more about you because OCO-3, you know, you have an interesting path to start working on this particular project, and you have a background in environmental engineering science — I hope I’m saying it right — which sounds very interesting. So please, let’s, tell me about yourself. What led you to start working on OCO-3 like you are today?
Annmarie Eldering: Yeah. So, I came out to Los Angeles back in 1988, and it was a great time if you like smoggy, dirty, bad air. So that was what I studied in my Ph.D., was what is it that makes up the air pollution and reduces visibility in L.A.? And then we tried to understand how you could engineer a solution to it. So that was kind of my training and background, and thinking about the world we live in, the world around us, the environmental problems we have, and then how we might try to address them. And that’s kind of fed into what I did once I got up to JPL. I went from working in a very local L.A. problem to starting to think about the global picture and global air pollution. And JPL was getting new instruments ready to go into space and study air pollution from space, and that was a great opportunity for me back in 1999.
Host: Hmm.
Annmarie Eldering: So, the first project I joined was called the Tropospheric Emissions Spectrometer. The name doesn’t really give away much, but the point was to try to look through Earth’s atmosphere and learn about the air pollution, but not just the total amount, but we actually were trying to differentiate air pollution near the surface from air pollution higher up, because it’s the stuff near the solution that impacts the humans, so, you want to try to see that separately. And it was a brand-new measurement technique that went up on an EOS (Earth Observing System) mission, and we had a lot of success. And, well, challenges and success with that project. But I learned about doing science from space and working in a NASA team. And then an opportunity arrived back in 2010 to join Orbiting Carbon Observatory-2, and that built nicely on what I had done with TES, so that’s the opportunity I had to get involved with the carbon crews, and everything unfolded from there.
Host: The carbon crews, that’s a pretty cool name. What is OCO-2?
Annmarie Eldering: So OCO-2, Orbiting Carbon Observatory-2, is a follow-on to OCO. The original instrument was a spectrometer built to measure carbon dioxide, but it didn’t launch successfully back in 2009. And so, OCO-2 was a rebuild of that instrument, so a spectrometer that they rebuilt, and then they set it up on its own satellite. So OCO-2’s actually still out there today, flying over your head and measuring carbon dioxide in Earth’s atmosphere from a satellite.
Host: Very interesting. And before we go into OCO-3, which is going to be our primary discussion here, I want to understand more about exactly what it’s studying. Because to lead into what exactly the OCO-3 is doing, I think we need to better understand just carbon dioxide, what’s happening in the Earth, why is this a field that we actually need to study? So, so let’s start there. What is, what is it that OCO-3 is studying? What’s happening on Earth?
Annmarie Eldering: Yeah, I mean, those are great, great questions. And OCO-2 and OCO-3 are, you know, sisters, we kind of, sister instruments using the same technique, measuring the same gases. And carbon dioxide, so a little bit about carbon dioxide: it’s this molecule that’s in our atmosphere, and it has a particular effect called, we call it the greenhouse gas effect, or it can trap heat and energy. You know what a greenhouse is, maybe you don’t know what a greenhouse is, so a greenhouse is where you use glass, you put up a glass building, and sunlight can get in but heat, the longer wavelengths of light, don’t get out very well. So even if the air outside the greenhouse is cold, the air inside could be quite warm because the glass is trapping, trapping energy. And so, carbon dioxide molecules do a similar thing. Energy can come into Earth through sunshine, but when it’s trying to get back out as heat and longer wavelength radiation, carbon dioxide holds on to some of that. So, it’s a little blanket for Earth. And that’s kind of a good thing. If that carbon dioxide wasn’t there acting as a blanket, we would be way colder, we would not be comfortable here. But if you think about the blanketing effect, you also don’t want too much of the blanket on you. The more and more carbon dioxide that gets into our Earth’s atmosphere, the more and more it’s trapping heat, so it’s one of the critical gases to the climate change and the warming of Earth. And in particular, what we want to understand is more about how our human emissions, how much do they stay in Earth’s atmosphere, how much do they get taken out by plants that are growing, how much do they absorb in the ocean? Because just for a few little numbers, if we think about how much carbon dioxide humans put into the atmosphere by burning coal and oil and gas, about half of that stays in the atmosphere, typically, and about half of that has been taken out by the oceans and the plants each year. That’s over the last decades; as we have measurements, that’s what we’ve seen. But every year’s a little bit different. There’s these years where the plants and the ocean seem to take out 80% of the carbon dioxide we put in. And then there’s other years where they only take out 20%, so it’s really variable. And we want to know, how is this going to unfold, what’s going to happen in 2050, in 2070? Can the ocean just take up more and more and more and more? Is there going to be some limit? What about the plants? As the plants get warm or it’s getting drier, is that going to limit how much carbon dioxide they can take out? So OCO-2 and OCO-3 want to measure carbon dioxide around the whole globe, over oceans, over plants areas, over urban areas — measure it everywhere and try to put together a more detailed picture of this uptake and release of carbon dioxide from plants and oceans and the atmospheric state. So that was kind of a long story, but that’s why we care about carbon dioxide.
Host: Yeah, no, but that’s, it’s super-interesting. I think this is, what you just described is, you know, where is this carbon dioxide coming from? What is producing it? Where is it being absorbed? Is this the idea of, when I was reading about OCO-3 and what it’s measuring, there’s these things called carbon dioxide sources and sinks? Is that essentially what you’re talking about?
Annmarie Eldering: Yes, it is. That’s exactly what I was talking about.
Host: OK.
Annmarie Eldering: The sources and the sinks of carbon dioxide. And also, we use the phrase sometimes about how the Earth breathes because —
Host: Hmm.
Annmarie Eldering: — when plants get going in the spring, especially you think, if you just imagine a picture of the Earth in your mind and you think the northern hemisphere, North America, Europe, Asia, we have a lot of land in the northern hemisphere. Much more so than down in the southern hemisphere. And when spring arrives in the northern hemisphere, and those plants start growing, you can really see carbon dioxide amounts go down because the plants take it all out of the atmosphere. Or not all, they take a bunch out of the atmosphere. And then when those plants die off in the fall and the winter, that’s released back up into the atmosphere. So, you see these swings and sways each year because of plant activity, ups and downs in carbon dioxide concentrations. So that kind of looks like the Earth breathing each spring and fall. But on top of that, we have an overall increase from year to year because we keep putting more carbon dioxide in than the plants and ocean can take out.
Host: Aha.
Annmarie Eldering: And that sources and sinks is this idea of, is, you know, what are the trees and the plants of North America doing? What are they doing in Europe? What are doing in Asia? It’s, not every tree and plant is the same, so we want to think about sources and sinks, or uptake and removal, in different regions of the world to understand what exactly they’re doing and how they might change in the future.
Host: OK, wonderful. Now, in terms of sources, you mentioned some, some human-made, or I think the term is, I’m probably going to butcher it, but anthropogenic emissions; so you got some human-made ones, and then there might be some natural sources of carbon dioxide. What are those?
Annmarie Eldering: Yeah, so the human sources are the dominant sources, but we still have to think about, we can think about land and ocean as a source, particularly when you say, for example, in November, when the plants are, leaves are falling off and starting to decay, there’s regions of the world where there’s more carbon dioxide going out into the atmosphere than was being taken up so that acts as a net source. So, the natural system can be a source of carbon dioxide in certain periods. And other phenomena, like fires, wildfires are more and more in the news these days, and when you’re thinking about carbon dioxide, they, in the net, they’re putting carbon dioxide out of the plants that are burning and up into the atmosphere. So, they’re a net source to the atmosphere.
Host: Interesting. I didn’t realize that wildfires can be a natural source, interesting. OK, and then you said the sinks. And I think you already mentioned them, but the ones that I heard were plants, which can vary, and then the other one was oceans. How do they work as absorbing the carbon dioxide?
Annmarie Eldering: Yeah, oceans are really interesting because you, you know, I guess, for me, I’m not an oceanographer, I hadn’t been thinking about these things, but you actually have very different wave action, there’s different temperatures, there’s parts of the ocean where the water tends to be rising up from below and coming towards the surface, and other parts of the ocean where water is kind of sinking on down. And so, depending on the temperatures of the water and the atmosphere around it, carbon dioxide can get out of the ocean and up into the atmosphere, just as it can also be taken and absorbed into the oceans. And then in regions where there’s downwelling, that gets taken down into the deep ocean. So, they are exchanging carbon dioxide. They don’t vary wildly, right, like the plants vary a lot from year to year, the ocean’s much more of a kind of a steady interaction to the atmosphere.
Host: Hmm, interesting. Now, in terms of, what I’m trying to do is build the foundational knowledge to catapult us into discussing of OCO-3. Some of the things it’s studying are these sources and sinks, all of these different areas. We’re talking global here, right? When we’re talking about plants and oceans and these sources of emissions from all these, you know, they’re burning coal, and oil, and everything, this is, that’s a lot of data. I think the other, some of the other stuff it’s, oh, is absorbing is radiation from plants, and something called solar-induced fluorescence. Now, what is that?
Annmarie Eldering: Yeah, let me tell you about the solar-induced fluorescence, and then we can talk more about the sampling and stuff.
Host: OK.
Annmarie Eldering: So, the solar-induced fluorescence is something we hadn’t planned the mission around, but scientists started understanding that this was something they could learn about from space, ’round about 2009, 2010, in that time frame. A couple different scientists in different labs were coming to this insight around the same time. And what, what they realized was that when photosynthesis happens in plants and trees, there’s a little bit of, like, the sunlight comes in, the plant does photosynthesis, it generates some heat while it’s doing that, and it also releases some light at very particular wavelengths. And when you make a measurement like ours from space and you’re measuring light, you try to model and understand that light in great detail, and those scientists realized there was a little bit of light in this spectrum that they couldn’t make sense of unless they said, wow, when plants are doing photosynthesis, they send off this energy, and I’m picking it up in my detector. So, we see a little bit of light that gets emitted when plants do photosynthesis, and it’s giving us some insight into how much plant activity is happening. So that’s what we call solar-induced fluorescence. It’s the kind of the technical name of the light that comes out of plants when they do photosynthesis. So, we, we map that out and can take a picture of what’s happening. And you see these really interesting seasonal cycles of, as the plants get rolling, this solar-induced fluorescence gets larger and larger, the tropics are almost always showing a big signal because those plants always have plenty of light and water and warmth, so they’re pretty active all the time, whereas something like Canada will have a brief period of the summer where you get a lot of fluorescence from plant activity, and then other times of the year it’s much lower signal levels. But it’s great because if we’re thinking about this question of carbon dioxide uptake, plant activities, interactions, if you know about the photosynthesis through this SIF signal, it helps you put together more of that puzzle about the plants and their uptake of carbon dioxide.
Host: There’s the connection. OK, perfect. Now, that’s perfect, Annmarie, that sets the, I think a nice foundation for what’s happening. Let’s go to the Orbiting Carbon Observatory-3. Now, what is this facility that’s onboard the International Space Station?
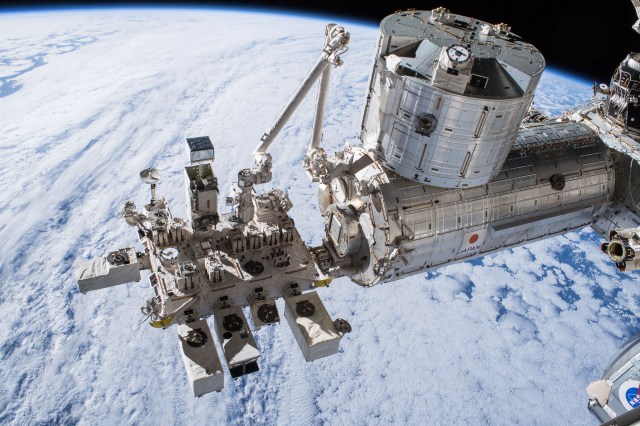
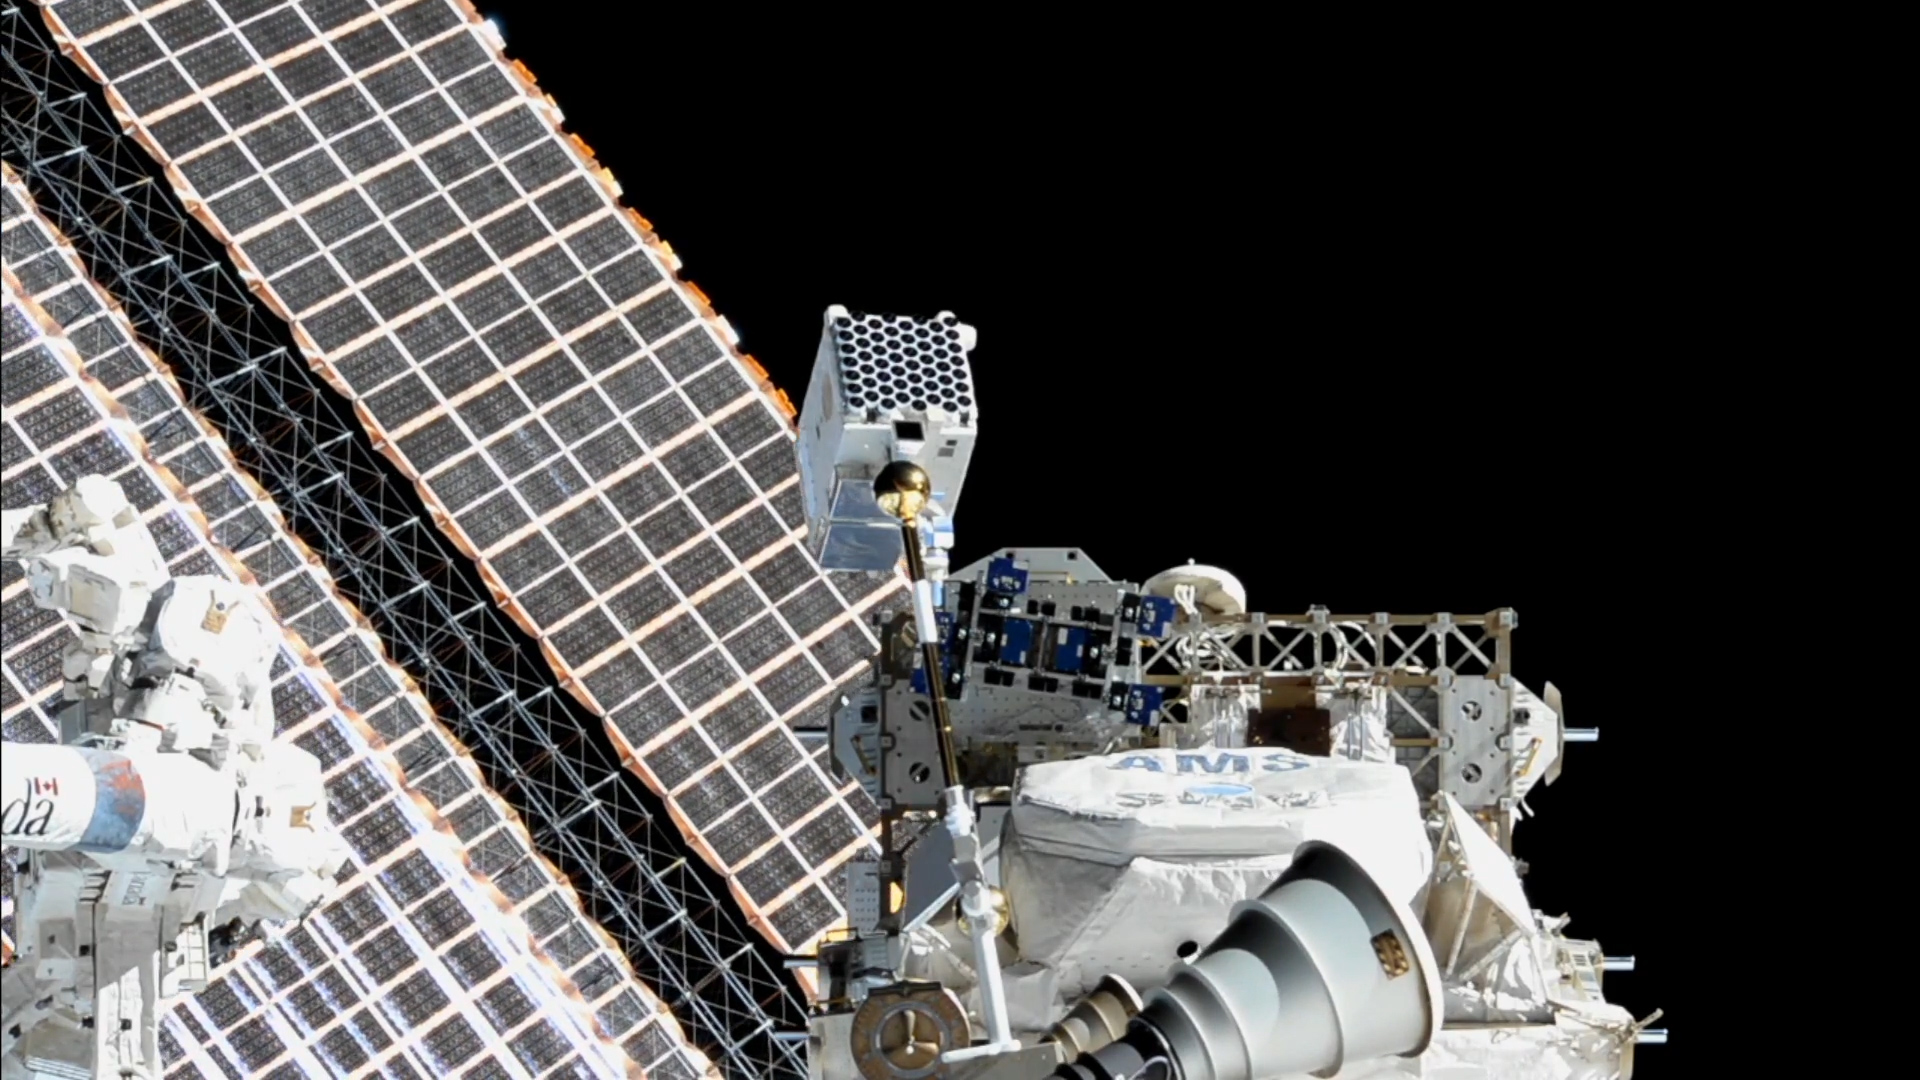
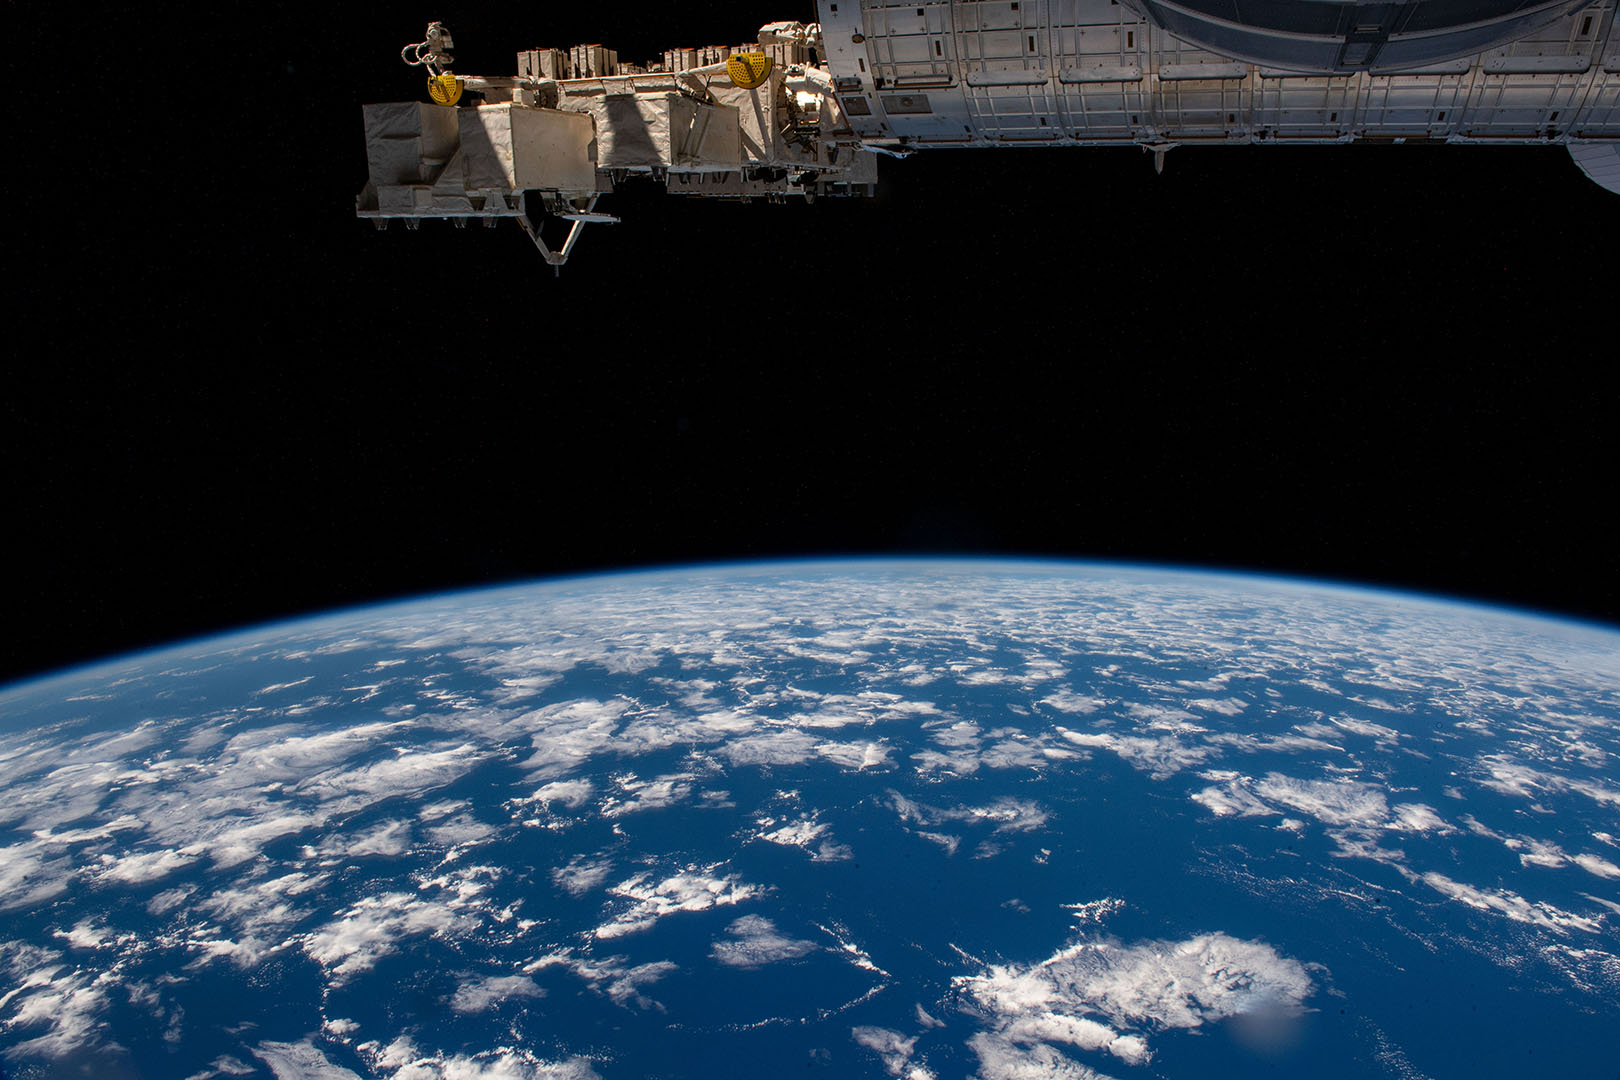
Annmarie Eldering: Yeah, so the Orbiting Carbon Observatory-3 on the space station was a great opportunity that presented itself because, as I mentioned, we built OCO-2 as a rebuild of a failed launch. When that work was proposed, we decided we should make two at once. It’s much cheaper to build two things at once than it is to build one and then build another. Just in case something happened and the next time we launched it, we wanted to have this spare instrument available. So, when OCO-2 was safely up in space and started working, we realized the opportunity to repurpose that spare and make it into this OCO-3 payload. And the International Space Station, I’m sure a lot of your listeners have that tracking tool, and see that it’s going overhead, and people love to see the astronauts being brought up, and all the human activity. But there’s also this really exciting science happening on the outside of the space station, and specifically, there’s this module, the Japanese exposed module experimental facility, or JEM-EF. And if you build a payload with a very specific interface, you can get it launched and attached and it can start doing science. So, I think there’s about eight or nine spots up there where people have instruments being used to do science from the space station. And so that’s, OCO-3 went up into space and got installed on that JEM-EF facility back in May 2019.
Host: OK. And so that’s, it’s nice perspective, right? What’s nice about, so, it seems like you have a lot of instruments that are similar on the OCO-2, which is its own satellite. I think that one’s in a polar orbit, right? And this one has the International Space Station orbit. What’s nice about having these two perspectives?
Annmarie Eldering: Yeah, it’s very typical, as you mentioned, that a lot of science instruments in space are launched into these polar orbiting orbits, where they go over your head at the same time every day. And so that gives them some consistency in the time of day, which helps with some of the data interpretation. But on the other hand, you’re missing out on anything that’s happening that changes over time of day. So being on the International Space Station gives us this really neat opportunity to make measurements at variable times a day. Sometimes the data we collect is at eight in the morning, sometimes it’s noon, sometimes it’s four in the afternoon. And when you’re thinking about plants and activities that vary through the day, it’s great to have that new kind of information. And the folks who are working particularly with the plant data have all started to make assessments and show us they actually do see differences in measurements that happen in the morning versus the afternoon, and starting to learn that, for example, if plants are doing photosynthesis but then they get really hot and start to get overheated in the afternoon, that photosynthesis sort of shuts down due to the overheating, and they can start to see some signals of that in the data we’re collecting. But I got a little bit sidebarred. So yeah, being on the space station, number one, it lets you see things at different times of day. Number two, it’s, ISS is huge, it is like the size of a football field, so when you’re building an instrument to go onto the space station, if you’re a little bit heavy it doesn’t really matter, and that made it really easy for us to build our OCO-3 payload because we weren’t too constrained by weight, and so we could go ahead and just do good engineering and get the thing built up. And then the third thing about our OCO-3 payload is we have this amazing pointing system that we have had to add on to be able to look at our validation sites and look at the glint spot on the ocean, and so on. OCO-2 does all its pointing by moving the whole satellite. We couldn’t get the ISS operators to agree to that for us, so we had to put our pointing system on OCO-3, and that’s turned out to just be a really valuable new mechanism to have on our instrument.
Host: Hmm. Well, what’s, what’s a validation site?
Annmarie Eldering: So, if you’re measuring carbon dioxide and you want to talk to the science world, it’s really important than you can connect the data you collect to the recognized standard for carbon dioxide. Everybody thinking about carbon dioxide ties back to this one measurement and measurement technique. So, we want to do the same thing, and the way we do this is kind of, there’s three or four steps to it. We have some sites on the ground where we’ve installed instruments that look up at the Sun and make a measurement a lot like the OCO-3 measurement, so measure the light spectrum and then interpret that to find out the amount of carbon dioxide. But once in a while, an airplane or a balloon is launched over those ground sites, and it measures carbon dioxide by drawing air into a collection cylinder, just like they do where the references are made at the NOAA (National Oceanic and Atmospheric Administration) sites. And so those ground sites are measured over by an aircraft, and we measure over the ground sites so we can tie everything together. So we’ve got a whole network of these validation sites known as the Total Carbon Column Observing Network, or TCCON.
Host: Makes the data reliable when you end up looking at it because you know you have all these checks and balances.
Annmarie Eldering: Yeah, and it helps the scientists use our remote sensing data along with the ground-based in situ measurements, so we start to be able to really exploit all the data together.
Host: Very cool. All right, now OCO-3, it’s in space, right, so, it’s orbiting pretty high up; now, what are some of the instruments on board that help you to measure the things that you want to measure?
Annmarie Eldering: Yeah, so, so I’ll tell you a little bit about what’s the guts of OCO-3. We’ve just been talking in generality. But how do you figure out how much carbon dioxide is there when you’re flying around on the ISS? And the way we do that is we look at light. So, we have, sunlight gets, shines down on Earth, reflects off Earth, and we collect some in our instrument. And we’ve designed this with three particular bands of light to be measured. And one of those is at a wavelength that’s kind of like the wavelength of light your eye sees, or visible light. And that one’s important because if there’s a cloud in the way, it’s really obvious at those wavelengths of light, so we can tell that we saw a cloud and that data’s not going to be good. And then the other two bands that we measure in are where carbon dioxide molecules absorb light. So every molecule in the world, because they’re made up of atoms that are interacting, there’s the physics result in there being a very specific and known way that each molecule interacts with light. So, we design to collect specifically where carbon dioxide molecules are interacting with the light, one of those where there’s a lot of light absorption by the carbon dioxide, and one where there’s kind of a moderate amount. And so, by looking at that light and seeing how it changes, we can find out how much the carbon dioxide was interacting with the light. And we do that with what’s known as a spectrometer. So if you’re familiar with a prism, where you can make a little rainbow by spreading out the light wavelengths —
Host: Yeah.
Annmarie Eldering: — it’s a similar idea over a very narrow band-pass of light, band-pass of light, and very finely resolved. So, we collect very detailed measurement of light in these three little bands, and that’s basically what we need to use to extract insight into how much carbon dioxide there is.
Host: So is it, I guess, it’s some of these spectrometers that allowed you to have the happy accident of measuring solar-induced fluorescence in the plants as well. You’re measuring light wavelengths, it sounds like, and you’re like, “hey, look at that!”
Annmarie Eldering: That’s exactly it, right. And the one I mentioned that we worried about the clouds, and so we used that visible wavelength…
Host: Right.
Annmarie Eldering:…if you go to the very shortest wavelength of light, that’s where these light emissions from the plants show up. So, it’s actually in, in OCO-2, we thought those wavelengths were just so far at the edge of the detector we weren’t going to do anything with them. And that’s where the plant light showed up, yeah.
Host: Very cool. Now, it sounds like those are the key instruments, right? You got the spectrometers on OCO-3. I think you said there was a pointing system on board. What other cool technologies are on OCO-3?
Annmarie Eldering: Let’s see. We’ve got a, well, cool to me, I don’t know if you’ll find these cool. But you know, one of the other things we have to do is [laughs] these light measurements are the heart of the data, so you’ve got to make sure you really understand how much light there is. So we actually have to have a little calibration system built in, and we, what we do is there’s little lamps that we’ve brought up with us, and we take our instrument and point into the calibration system and look at that lamp light periodically. Like every few orbits we do that. And some lamps get turned on once a week, and some get turned on every couple of hours. But we have to get those light measurements as a way to keep the instrument calibration running, or well understood, throughout the whole time period. So yeah, the pointing system, the spectrometers with these really sensitive, high-speed detectors at the back end, calibration system, and then being on the space station we don’t have to have a fancy way to down, beam down the data, but we actually just send it over Ethernet connection, and then the space station takes care of everything with getting our data down to the ground.
Host: I see. So that’s pretty nice, right? That’s one less thing you had to worry about. Awesome. And you thought I wouldn’t find that interesting; that’s spectacular. So that’s cool, the calibration technology. Now, in terms of how they work, right, in terms of the operation of them, you got the space station flying over the Earth, what is it, 16 times a day, or something like that; when are you collecting, what’s the sampling technique that you’re using to gather the data? How are all of the instruments working?
Annmarie Eldering: Yeah, so the, so as I mentioned we need sunlight to do this measurement, so our ops (operations) team will only send up instructions for data collection to happen during those daylight hours. But the kind of concept of the measurement is that we have these detectors, and we use them so that we have a footprint — we call a footprint is like one little measurement of data that’s occurring over about two by three kilometers on the ground — and with our detector we can get eight of those footprints at once, where once is a third of a second. So, we kind of think of it like with your camera. You open up the shutter for a third of a second, get light on your detector, close the shutter, and read out the data. So, we do that. Every third of a second, we’re getting eight footprints on the ground. So for about 14 kilometer from side to side for those eight footprints; get that data, reset your shutter, get another one. So, there’s a continual swipe of data 14 kilometers wide being collected any time the Sun is shining on the Earth’s surface. And we do have two, two modes that we primarily use. One of those is just looking straight down, or called the nadir mode, which is what we do over land. And over the water, the water surface is not that bright at the wavelengths of light I’m talking about, so we have to think about, where’s the Sun shining onto the water? And if you’ve ever hung out at a side of a lake during kind of a sunrise or sunset, you know that where the sun reflects off the water can be super bright even if areas away from that are dark. So, we don’t look right at that glint spot, but we look pretty close to it where we get bright reflections off of the water’s surface. So that’s another reason that pointing system was so important. If you’ve got to go find that shinier spot on the water, you need to point over to it with the pointing system.
Host: Yeah, you got to get just that right angle because that, it seems like the angle is very important to your data collection.
Annmarie Eldering: Absolutely.
Host: Yeah, yeah. And in terms of the scope, right, space station covers a lot of the Earth; are you gathering data from as much of the Earth as possible? Are you focusing on select areas, and just gathering data on these select areas over time? What’s the, what’s the scope of what you’re covering?
Annmarie Eldering: Yeah, that, so it’s a couple numbers that are good to know about the space station is basically the orbit that it flies in, you can’t see, you can see everything from about London to Patagonia, or 52 degrees northern latitude to 52 degrees southern latitude. So, with OCO-3 we can’t look up at the Arctic, we don’t see any of Antarctica, but we do see all those latitudes 52 to 52. And we, we work pretty closely with OCO-2. And since OCO-2 is healthy and happy and getting global measurements on a regular daily basis, what we’ve decided to do with OCO-3 is we take that nadir and glint data for a lot of the day, but we weave in a whole bunch of other special measurements. So, let me take a little moment, and I’ll explain this other thing we do —
Host: Yeah.
Annmarie Eldering: — called a SAM, or a snapshot area map. So that cool pointing system lets us, for example, when we want to look at one of those validation sites, what we do is we, we can point the system, pointing system a little bit ahead of where we’re flying and sweep over the validation site, and then repoint and sweep it again. And you basically repoint as you’re flying by, and you can overlap about five or six stretches of data. You’ll measure about 50, 60 kilometers, and then repoint and sweep that again, and so on. So, we can use the pointing system to get that overlapped validation data. And then our engineers also designed a mode where you use that same pointing capability, but your goal is to map out an area that’s about 50 kilometers by 50 kilometers, and just get one footprint on each location. So you think about that 2-by-3-kilometer footprint, if you collect the swath of data and then get one next to it, and one next to that, you can basically map out an area. And so, we schedule, some days we don’t schedule any because the interesting places aren’t going to be visible. And other days we’ll get 30 or 35 of these maps collected. And we’ve selected, we have a whole database of places we want to try to look at. Those include cities, volcanos, forests where there’s special studies going on; if somebody’s out in the, what we call out in the field, for example, there’s been scientists flying airplanes over Los Angeles and California to study carbon dioxide, we’ll coordinate with them and collect maps of data with where they are. So, we’ve been a fraction of our time with OCO-3 doing those special snapshot area maps over these different focus areas. Again, cities, volcanos, forests, validation sites. So that’s kind of a something that OCO-2 wasn’t able to do, and a really interesting new data set we’re getting with OCO-3.
Host: Fantastic. Very, very cool technology. It seems like because you were working on OCO-2, and you came to JPL just before the, I think, 2000, right, you said 1999, so I wonder, you mentioned that OCO-3 was a happy result of building a spare for OCO-2 and realizing, hey, you know, maybe we can actually turn this into something that can, you know, collect additional data, and where better of a place than the International Space Station; I wonder if you were there for the genesis of that idea and working towards the process of putting it on the International Space Station. Were you a part of that?
Annmarie Eldering: Yeah, I was. I totally had the opportunity to be there from the beginning and —
Host: Awesome.
Annmarie Eldering: — I remember working with, you know, we had a lot of great engineers at JPL, and I can remember the discussions of, you know, where the possible places we could use this spare instrument; what are the upsides and what are the downsides, what are we going to do? And coming to the conclusion that the space station was the best option we could see, and then doing the work to make that into a reality. It was, it’s super fun. [laughs]
Host: [laughs] That’s awesome! So, when you realized that you were going to go to the space station, there are a couple things you mentioned that you needed to add because it was going to go into the space station, right, you got this pointing capability and stuff like that. And I wonder what it took to say, all right, let’s get it on the space station. All the work that needed to get it tested and verified and ready to go up on a SpaceX Dragon to go to the space station.
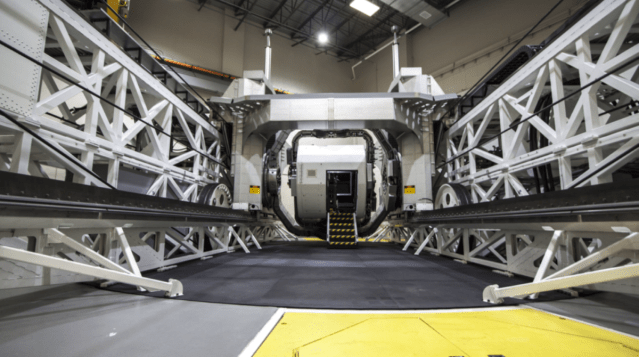
Annmarie Eldering: Wow, we could do a whole another hour just on that. But I mean, a couple of things that stand out in my mind from that work. One of those was kind of like, you know, understanding what the environment of the space station was going to be like. And there’s that, some of things you think about when you’re in space is your temperature and how you’re going to control your temperature because you’re in the Sun for part of the orbit, and then you’re out of the Sun. And you can get super cold and warm very quickly with that change. But the space station and the JEM-EF actually provide a cooling fluid that we could run through our instrument systems. So, the thermal engineers had to do a lot of work to figure out, could we stay at a good stable temperature. And temperature stability turns out to be really, really important for our instruments and our spectrometers because if the instrument warms up a little bit, the alignment can change a little bit, and then that’s really not good for the spectrometer that we want to use. So, temperatures, planning out, and figuring out if we’re going to be able to keep our temperature control was one thing, I remember a lot of discussions about. And then also, vibration. So, when you get launched up into space, that’s like the hardest thing on your instrument is that launch process, right? Once you’re attached to the space station, you’re flying around up there, it’s a pretty calm place. But you think about the process of being strapped to a rocket and launched off of Earth is a lot of vibration. And the OCO-2 instrument was launched on what’s called an Atlas rocket that’s been used for NASA for a very long time, and there was well understood what the vibrations were going to be. The move to going with SpaceX was a big benefit from a cost perspective, but it’s not as gentle of a ride. So, if we were, had visuals rather than just an oral I would show you this picture of this insane-looking additional engineering stuff we had to do to dampen the vibrations during the launch. We have this whole little set of rails on the bottom of our instrument that were there just as part of a vibration isolation system, so we didn’t shake and rock and roll too hard when we went up on a SpaceX rocket. And building that pointing system, you know, it sounds cool when it’s in operation but you could imagine just to engineer something that can move as many times as we’re going to make it move and that can also, you got to have cables inside of this pointing system, right, it’s got to be powered, it’s got to know where it is, so it’s got cables that are wound inside. And so, designing it so that it could all be moving and move smoothly and function for a long time was a, it’s a good engineering challenge for the team. So those are a few things I remember long discussions of. And of course, any time you build something for space, you do a lot of testing, and there’s usually a couple of surprises that happen during testing. And it’s expensive to get things in this cold, cold vacuum environment that you need to simulate space. So when we test our instruments we run that whole operation around the clock, 24 hours a day. So, it’s a big pushup for the team to do that work and to be efficient in doing it and respond to any surprises quickly while they’re doing these round-the-clock testing efforts.
Host: Fantastic. Annmarie, it sounds like there was a lot of, a lot of work that went into making this instrument a possibility, getting it ready to go up to the International Space Station. And you know, there was work specifically to get it ready for a launch on the Falcon 9. I wonder if you had an opportunity to go out to Florida and watch it head to space, and what that was like.
Annmarie Eldering: So, this, yeah, working with SpaceX, and then the Falcon 9 was, we were really excited to do that, and to be part of, part of one of their payloads going up. So we, I’m trying to remember…I can remember some of the pictures. Part of the engineering team went down with the payload and was at the facility to see it loaded up into the Dragon. So, you, so a Dragon, if you take, look at any of the pictures of the Dragon capsule, there’s a couple of big, kind of I-beam rails, and then your payload basically has feet that grab on to those rails. So our team went down there with the payload in a truck — I can remember the afternoon when we had the payload put up into this truck that was going to drive to Florida, all the team came out to see it happen, we were so excited to be at that stage. Some of the engineers went on down to Florida and saw it integrated up into the Dragon capsule. And then a lot of us went down to try to be there for the launch. And I’m sure you and your listeners in the space business know that launch is always a window, right? You think, OK, we’re going to go on Tuesday, but then anything could happen. And so unfortunately, we had weather delays and other interruptions, and I wasn’t able to see the launch in person.
Host: Oh, no.
Annmarie Eldering: We only, I think we had about four or five folks who did it. But the good thing was we, our crew and the team were so enthusiastic, we basically went down to a local bar one night to see the launch, and there was a delay, so we went back the next night, and still had a good crew of people show up and watched everything on TV. And NASA, the NASA show, and then as you know, when you work with SpaceX, they’ve just got cameras everywhere. So, it was super cool to see the launch itself, but then also see the camera images as the separation of the Dragon capsule from the launch vehicle, and you can even see our payload in the back of the Dragon up in space. So, there was a lot that we got to see even though we weren’t physically there in Florida for the, the event.
Host: Still probably a good feeling though, especially that last view, where you can actually see your payload in space for the very first time. That had to be pretty exciting. Like, wow, there it is. It’s in space.
Annmarie Eldering: Yeah. No, I, and I was getting all jazzed when the rocket went on up, and then the engineers around me were like, be quiet, be quiet, we’re not there yet, we’re not there yet. And so, they wouldn’t celebrate till you saw the separation —
Host: Right.
Annmarie Eldering: — and you could actually see the Dragon capsule floating on out. And then there was even more fun. Like, so, you know, you get launched, but then it takes some time to get synced up to the ISS. And I can also remember where I was when we went through the process where the Dragon capsule arrived to the space station. A robot arm attaches and holds on to the capsule. So that’s exciting. And then I think it was a day later that the robot arm took our payload and pulled it out of the back of the capsule, handed it off to a second robot arm, and then that brought it around and actually attached us in the JEM-EF slot. And the engineers got the ISS folks to use one of the cameras on a robot arm and watch as we started testing that our pointing system was moving properly. So, there was a lot that happened up there that we were able to see happening, with all the camera and all the data feed down from the space station. So that was actually all, like, just amazing to, to see that happen.
Host: Wonderful. And then, from there, you got like, I’m assuming, you kick into gear, and it’s like, OK, now it’s time to start the data collection. So, we’ve talked about the facility itself on board, some of the instruments, what it’s doing, and what it’s capturing. Now let’s go to the ground. When, when the instrument is doing all this stuff around the world, what is happening to send that data to you? Where, where is your team? Give us a perspective on what it’s like to, to be a part of the OCO-3 team?
Annmarie Eldering: Yeah, so it’s really exciting to work with OCO-3 and be involved with everything, from operations to data processing to the science data product. So, to go from where we need to be, we sit on the ground and say, hey, what are we going to measure this week? What’s available? What’s happening on the ISS? Our mission operations team are a group of experts who have a set of tools that let us plan out a week in advance. Each week we make a plan, review it for the science, and then they actually talk directly up to our payload. They go through the mission operations center and send a set of instructions on up to the payload. And those get executed and collect our data. So we get the data collection, and then every six hours through the ISS system data gets sent down to the ground, and our data operations team gets a pile of 1s and 0s, which is what the raw data looks like. And they use their tools and their data processing to turn that into light levels, and then eventually into the science data products we’re interested in. And their challenge is to keep their data flowing through the pipes so that they can keep up with the continual flow of data collection that we have. And then finally we have a group of scientists who work on everything, the calibration of the instrument, the validation of that data, and then the science and the use of the data that we’ve collected. So we’ve got three groups of people who do their magic every week and every day and make it all happen and create the data products.
Host: [Laughs] That’s right. And you’ve been doing that continuously, right? You got a lot of work been done since it launched in 2019. You have a lot of data. And you’re already starting to put some of that out. One of the things that I found interesting was some data that was published on concentrations of carbon dioxide in the Los Angeles area. So, what was that all about?
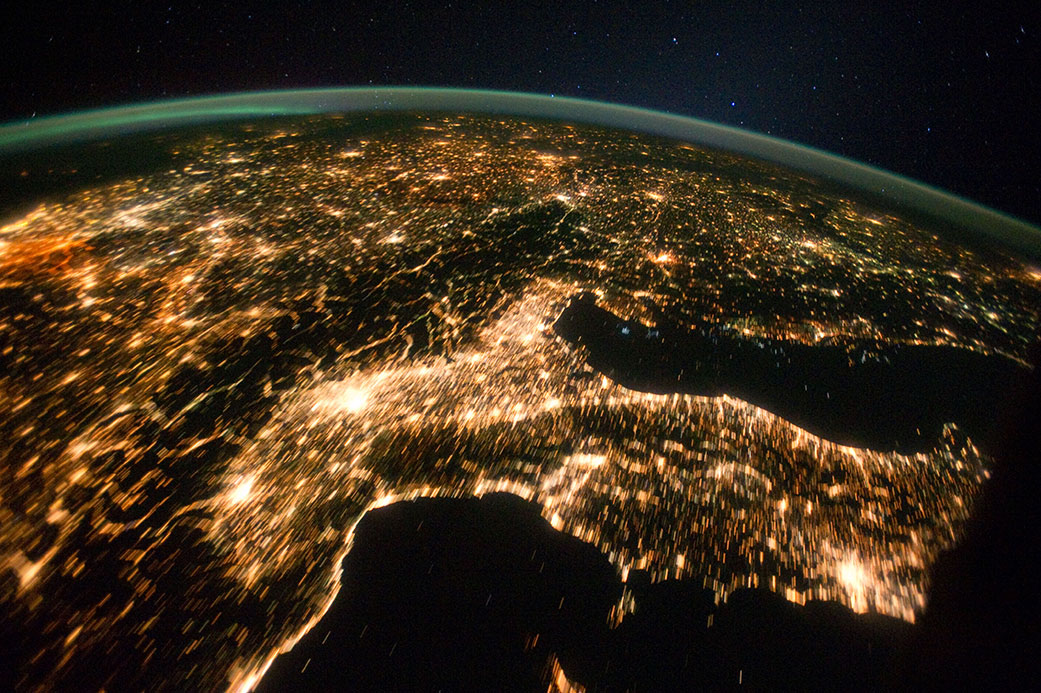
Annmarie Eldering: Yeah. I mean, Los Angeles is great. We’ve got millions of people living there, emitting carbon dioxide like crazy, clear skies, mountains trapping the air. So, it’s a great place to study. And what this first piece of work showed was that if you can make observations like ours from space and see the whole L.A. region, you definitely pick up extra carbon dioxide that’s coming from the emissions. But it can look very different, and that’s basically driven by the winds, primarily. So, we showed that if you account for the emissions and you accounted for the winds, you could, for the most part, explain what OCO-3’s been observing in the basin. So that was a good check on the technique, and it also helps us know that to try to apply those techniques to other cities, we’ve got to have a pretty good estimate of emissions as well as winds to be able to interpret our data.
Host: Very good. And you’re going to continue to collect the data. And there’s a lot more to do. I wonder, you know, there’s a lot of good information about how, the way you described as, how the Earth is breathing, right? And so, I wonder, wonder what we can expect down the road in terms of publishing some of the data so that maybe, maybe we have a better understanding of our planet and better understanding of how to help our planet. I think that’s one of the best things that could probably come from this investigation. And I wonder what some of the plans are for the OCO-3 team.
Annmarie Eldering: Yeah, so the OCO-3 team is in a unique position because when you get on the ISS and the JEM-EF, you don’t get to stay forever. A lot of people want to do experiments like our experiment, and so we actually had a commitment for three years. And it looks like, in about the three years and four months or so, we actually have to say goodbye. And we’ll be collecting data as long as we can, but there is another instrument being built, and when they’re ready to come up we get taken off of the space station. And the other surprising thing for many people is that we’re not going to be able to bring that instrument home and look at it and take it apart, because the Dragon capsule can carry, I think the number is about 6,000 pounds up to the station, but it cannot bring that much home. So, we get put in a capsule, but we’ll burn up in the atmosphere at the very end of our mission and turn into a bunch of dust. So, there’s a real end to this thing.
Host: Yeah. [laughs] So that’s good. But then, you know, we have to look forward to when the mission is over, you get a chance to sit down, you don’t have to worry about all these teams with the data collection and the operations, right, you get to sit down and look at the data and find out maybe some new and interesting things about our planet.
Annmarie Eldering: Yeah. Yeah, no, and we’ve, we’re already getting some insights, and we can see, just like you say, when we have more time to dig in, where we can go with this. And just to give you a couple of teasers, so we did that work in L.A., and now we’re looking at a lot of other cities. And when you look at our data as well as other gases that are measured by other instruments, for example, nitrogen dioxide, we’re really starting to be able to put together a detailed picture of emissions from city from the data set. And also, as I mentioned, the folks looking at plants are using the different time of day data, and using some data from our neighbors, like ECOSTRESS is on the ISS, there’s a Japanese payload and some others looking at plant, type of plants. There’s GEDI (Global Ecosystem Dynamics Investigation), which is looking at how much plant material there is. So, scientists are using all those different types of ways of measuring plants together to get more insight into their activity, what limits their carbon dioxide removal, how they respond to stress and drought, and things like that. So, a lot of interesting science coming down the road.
Host: Annmarie, I think that’s the perfect place to end right there is a teaser for, you know, getting folks excited for what’s to come as you’re nearing, I guess, the end of the OCO-3 mission with just a little bit of time left. But Annmarie, this was a wonderful discussion. I learned so much. From the last time we talked, we had a brief conversation as part of the SpaceX Crew-2 broadcast when you came over to SpaceX headquarters and we got to chat just briefly. This was just fascinating to dive so much deeper. So, I really appreciate your time. Thanks for coming on today.
Annmarie Eldering: Yeah, and really appreciate the interest, and I’m glad we got to share some of the information about the science and the cool thing we’re doing with NASA and OCO-3.
[ Music]
Host: Hey, thanks for sticking around! What a fascinating conversation with Dr. Annmarie Eldering today about the OCO-3. I definitely learned a lot, and I hope you did, too. Check out NASA.gov/ISS for the latest on all the experiments that are happening on board. Annmarie also mentioned a website called Spot the Station. She said there was an app that will literally text you whenever the space station is flying overhead so you can go outside, and you can see it. It’ll tell you where it’s flying in your local area. That’s spotthestation.nasa.gov. We’re one of many NASA podcasts across the entire agency. You can check us all out at NASA.gov/podcasts, and you can find our full collection of episodes there. We’re on the NASA Johnson Space Center pages of Facebook, Twitter, and Instagram, and you can use the hashtag #AskNASA on your favorite platform to submit an idea for the show or maybe ask a question. Just make sure to mention it’s for us at Houston, We Have A Podcast. This episode was recorded on August 26, 2021. Thanks to Alex Perryman, Pat Ryan, Norah Moran, Belinda Pulido, Rachel Barry, and Erin Anthony. And of course, thanks again to Dr. Annmarie Eldering for taking the time to come on the show. Give us a rating and feedback on whatever platform you’re listening to us on and tell us what you think of our podcast. We’ll be back next week!