
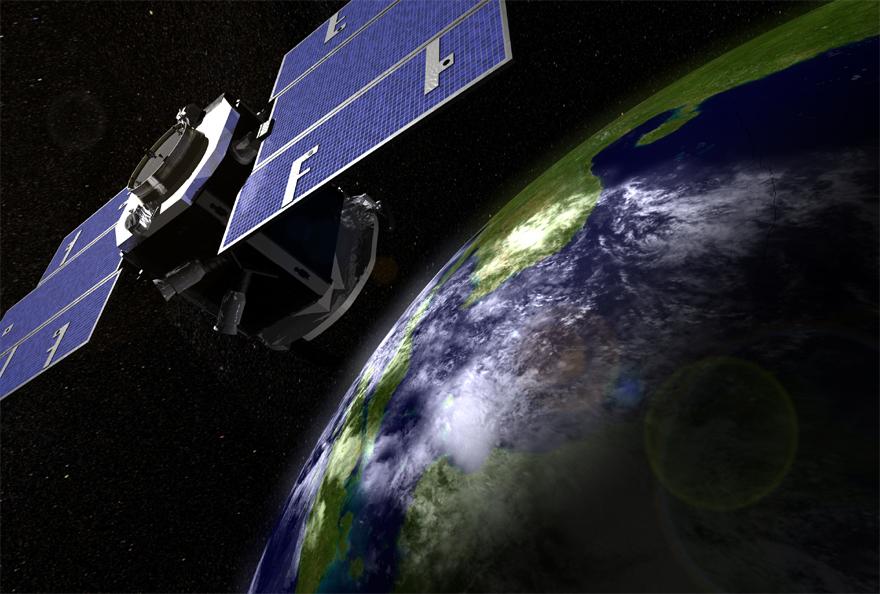


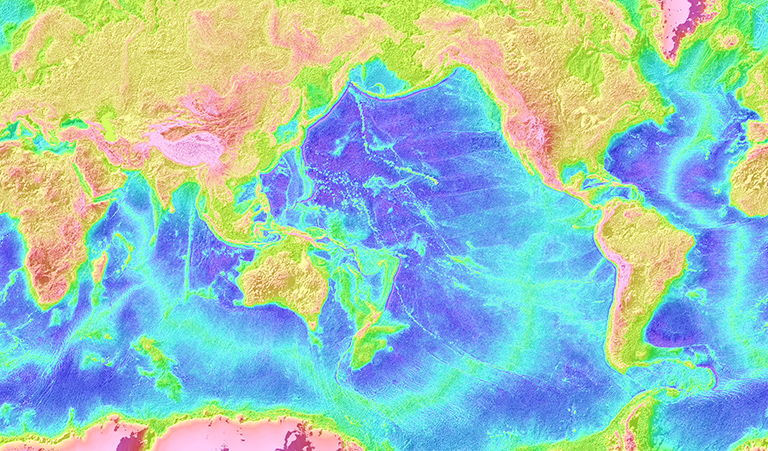


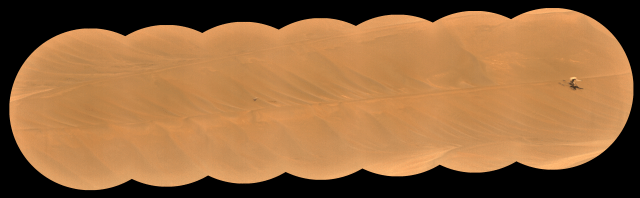


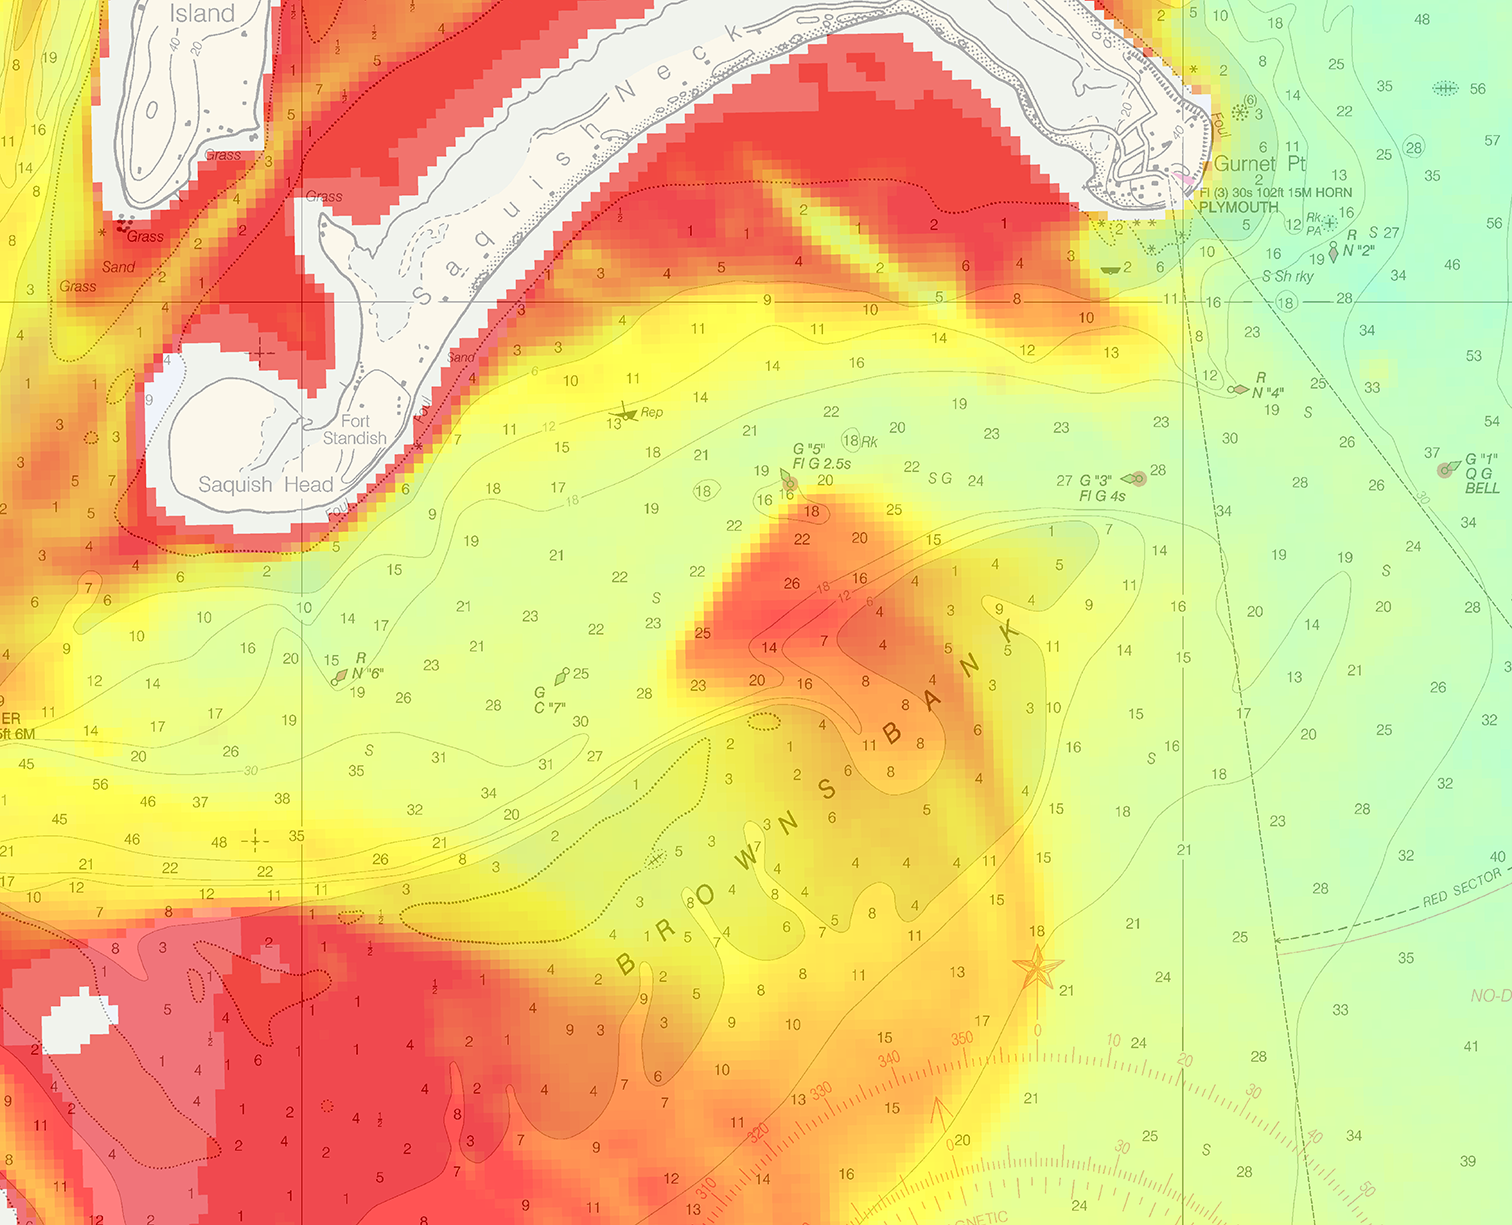
On the most recent nautical chart of the Beaufort Sea where the long narrow Tapkaluk Islands of Alaska’s North Slope separate the sea from the shallow Elson Lagoon (Nautical Chart 16081), a massive shoal is immediately noticeable just west of the entrance to the lagoon. On the chart, it looks like a massive blue thumb jutting out into the sea. The National Oceanographic and Atmospheric Administration (NOAA) identified this prodigious, 6-nautical mile-long, 2-nm-wide shoal using Landsat satellite data. NASA’s and the United States Geological Survey’s Landsat Program is the longest space-based continuous global record of Earth’s surface. The satellite imagery provides valuable information for agriculture, forestry, regional planning, mapping, and global change research.

In NOAA’s Office of Coast Survey, the Marine Chart Division is responsible for updating the suite of over 1000 nautical charts that keep mariners in U.S. waters safe. Their mandate covers all U.S. territorial waters in the U.S. Exclusive Economic Zone (EEZ), a combined area of 3.4 million square nautical miles that extends 200 nautical miles offshore from the nation’s coastline—the largest EEZ of all nations.
The field of Satellite Derived Bathymetry (SDB), has been around for nearly a half-century now, but it took the advent of free Landsat data in 2008, the 2013 launch of the more-advanced Landsat 8 satellite, and a shift in thinking about SDB products, to reinvigorate the use of satellite data in NOAA’s Marine Chart Division.
Keeping waterways safe is a massive undertaking
“There’s been a shift in the way we think,” Lieutenant Anthony Klemm, a NOAA Corps Officer in the Office of Coast Survey’s Marine Chart Division, explains, “In the past, if a measurement wasn’t made by the Army Corps or a NOAA survey ship, we didn’t want to use it, but now we are opening up to other technologies to evaluate the health of our current chart suite.”
Because of this sea change in thinking and faced with the daunting job of deciding which charts were most in need of updating, NOAA hydrographers revisited the use of SDB using freely available Landsat data as a viable tool to help them do their jobs.
“NOAA has now been using Landsat imagery for chart adequacy assessment and mission planning,” Shachak Pe’eri, a Research Professor at the Joint Hydrographic Center at the University of New Hampshire, says.
The Joint Hydrographic Center, a think-tank of researchers investigating technology and mapping challenges in NOAA’s Office of Coast Survey, realized that Landsat SDB could be an important reconnaissance tool. A single Landsat image is about 100 nautical miles across and affords a wide overview of a coastal area. Maps of SDB can be compared with existing nautical charts. In places where depth patterns do not match the seafloor may have changed, so those areas are more closely examined. If an area looks shallower than what is presented in the chart and if there is a reasonable amount of vessel traffic or corroborating mariners’ reports in the area, the chart location is tagged as a higher-priority candidate for hydrographic mapping—i.e. sending out a hydrographic ship to make depth measurements using sonar (multi-beam or single-beam).
NOAA: thinking big about SDB
Water clarity has been a limiting factor when it comes to SDB. If waters are too turbid (full of sediments that obscure light reflectance from the seafloor), then bathymetric measurements cannot be made.
Pe’eri, in a collaborative study with NOAA and the U.S. Coast Guard, has pioneered turbidity mapping as a proxy for bathymetric measurements. In enclosed waterbodies with strong currents, such as bays and sounds, turbid channels show up on Landsat imagery—and these turbid channels illuminate where currents are carving deeper channels that are safe for boat passage.
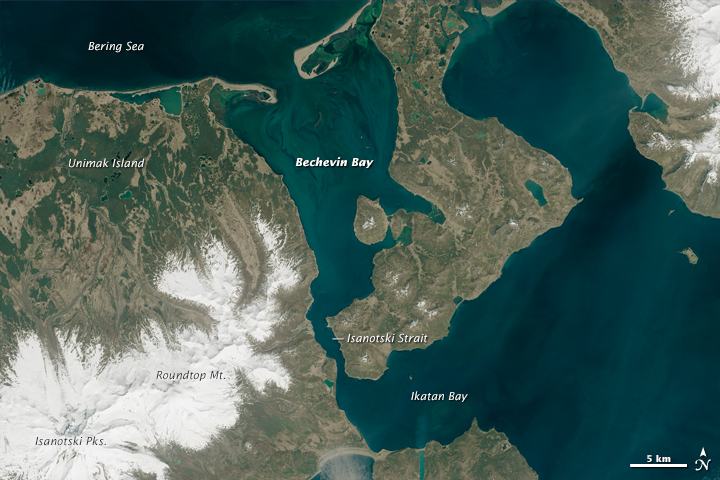
In the arctic, where near-shore changes occur rapidly because of seasonal sedimentation and erosion, new SDB techniques like turbidity mapping are preventing maritime mishaps. Bechevin Bay, the easternmost passageway between the Gulf of Alaska and the Bering Sea, provides fisherman with a shortcut for three ice-free months a year, but the location of sand bars can shift significantly here because of melting ice and shifting sediments. With the help of Landsat SDB turbidity maps, the new locations of these sandbars can be estimated. Recently this has led to the discovery of a new, straighter, and more geologically stable channel.
Pe’eri’s team has also developed a multi-image method to help separate clear and turbid waters using Landsat data. Techniques such as turbidity mapping will grow increasingly important for navigation planning as warming waters enable more industrial development of the Arctic and set the stage for international shipping routes.
NOAA’s Marine Chart Division has made Landsat a prominent tool in their charting toolbox—especially Landsat 8.
“Landsat 8 is overwhelmingly better,” Pe’eri says citing the new satellite’s additional cirrus band which helps him better account for atmospheric noise that can counter accurate SDB and Landsat 8’s better radiometric resolution (which means more signal, less noise, and more measurement fidelity). But it’s not just SDB that this innovative office is utilizing. They are also watching traffic patterns using the Automatic Identification System (AIS) and even light communication from recreational boaters, fishermen, tugboats, and larger vessels, and together with bathymetry measurements are prioritizing which charts are in perilous need of revision.
“We’re making charts safer up there,” Klemm says talking about the recent Beaufort Sea chart revisions, “and that’s so exciting.”
This text is abridged. Read the full article here.
For more information on the NASA/USGS Landsat program, click here.