


High in the atmosphere, above weather systems, is a layer of ozone gas. Ozone is Earth’s natural sunscreen, absorbing the Sun’s most harmful ultraviolet radiation and protecting living things below. But ozone is vulnerable to certain gases made by humans that reach the upper atmosphere. Once there, they react in the presence of sunlight to destroy ozone molecules.
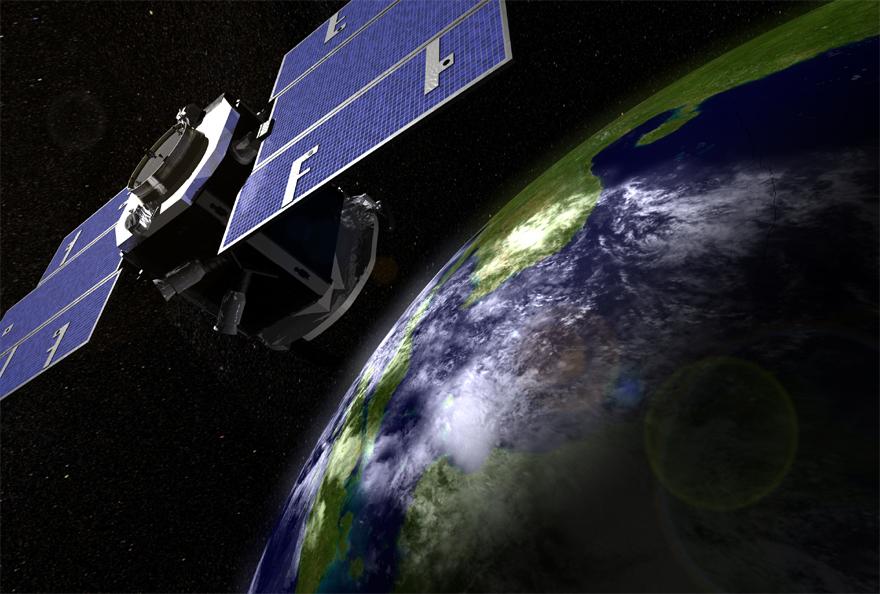
Currently, several NASA and National Oceanic and Atmospheric Administration (NOAA) satellites track the amount of ozone in the upper atmosphere and the solar energy that drives the photochemistry that creates and destroys ozone. NASA is now ready to launch a new instrument to the International Space Station that will provide the most accurate measurements ever made of sunlight as seen from above Earth’s atmosphere — an important component for evaluating the long-term effects of ozone-destroying chemistry. The Total and Spectral solar Irradiance Sensor (TSIS-1) will measure the total amount of sunlight that reaches the top of Earth’s atmosphere and how that light is distributed between different wavelengths, including ultraviolet wavelengths that we cannot sense with our eyes, but are felt by our skin and harmful to our DNA.
This is not the first time NASA has measured the total light energy from the Sun. TSIS-1 succeeds previous and current NASA missions to monitor incoming sunlight with technological upgrades that should improve stability, provide three times better accuracy and lower interference from other sources of light, according to Candace Carlisle, TSIS-1 project manager at NASA’s Goddard Space Flight Center in Greenbelt, Maryland.
“We need to measure the full spectrum of sunlight and the individual wavelengths to evaluate how the Sun affects Earth’s atmosphere,” said Dong Wu, TSIS-1 project scientist at Goddard.
TSIS-will see more than 1,000 wavelength bands from 200 to 2400 nanometers. The visible part of the spectrum our eyes see goes from about 390 nanometers (blue) to 700 nanometers (red). A nanometer is one billionth of a meter.
“Each color or wavelength of light affects Earth’s atmosphere differently,” Wu said.
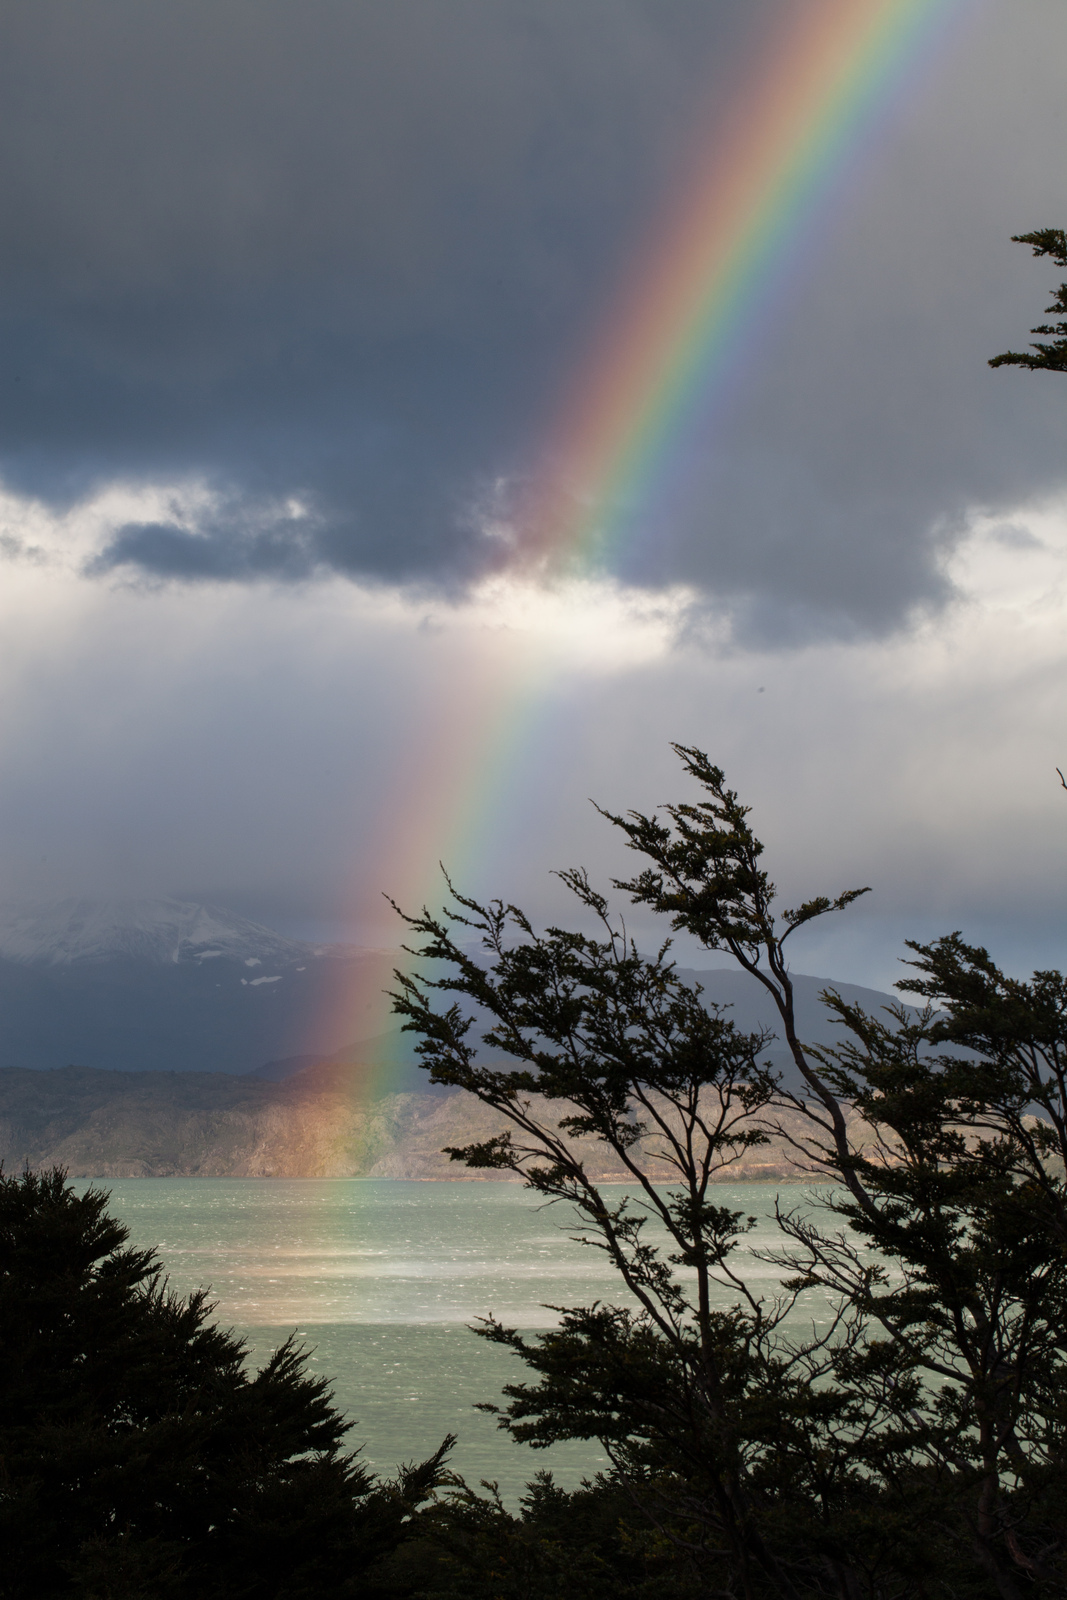
CC BY-NC 2.0
TSIS-1 will see different types of ultraviolet (UV) light, including UV-B and UV-C. Each plays a different role in the ozone layer. UV-C rays are essential in creating ozone. UV-B rays and some naturally occurring chemicals regulate the abundance of ozone in the upper atmosphere. The amount of ozone is a balance between these natural production and loss processes. In the course of these processes, UV-C and UV-B rays are absorbed, preventing them from reaching Earth’s surface and harming living organisms. Thinning of the ozone layer has allowed some UV-B rays to reach the ground.
In the 1970s, scientists theorized that certain human-made chemicals found in spray cans, air conditioners and refrigerators could throw off the natural balance of ozone creation and depletion and cause an unnatural depletion of the protective ozone. In the 1980s, scientists observed ozone loss consistent with the concentrations of these chemicals and confirmed this theory.
Ozone loss was far more severe than expected over the South Pole during the Antarctic spring (fall in the United States), a phenomenon that was named “the Antarctic ozone hole.” The discovery that human-made chemicals could have such a large effect on Earth’s atmosphere brought world leaders together. They created an international commitment to phase out ozone-depleting chemicals called the Montreal Protocol, which was universally ratified in 1987 by all countries that participate in the United Nations, and has been updated to tighten constraints and account for additional ozone depleting chemicals.
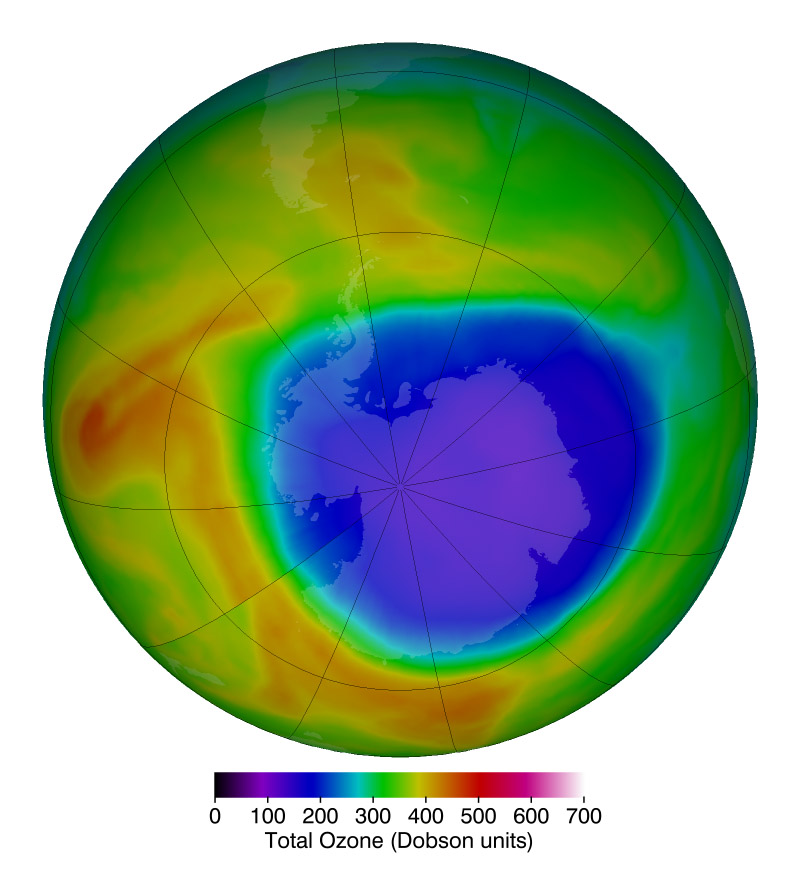
A decade after the ratification of the Montreal Protocol, the amount of human-made ozone-destroying chemicals in the atmosphere peaked and began a slow decline. However, it takes decades for these chemicals to completely cycle out of the upper atmosphere, and the concentrations of these industrially produced molecules are not all decreasing as expected, while additional, new compounds are being created and released.
More than three decades after ratification, NASA satellites have verified that ozone losses have stabilized and, in some specific locations, have even begun to recover due to reductions in the ozone-destroying chemicals regulated under the Montreal Protocol.
As part of their work in monitoring the recovery of the ozone hole, scientists use computer models of the atmosphere that simulate the physical, chemical and weather processes in the atmosphere. These atmospheric models can then take input from ground and satellite observations of various atmospheric gases, both natural and human-produced, to help predict ozone layer recovery. They test the models by simulating past changes and then compare the results with satellite measurements to see if the simulations match past outcomes. To run the best possible simulation, the models also need accurate measurements of sunlight across the spectrum.
“Atmospheric models need accurate measurements of sunlight across the ultraviolet spectrum to model the ozone layer correctly,” said Peter Pilewskie, TSIS-1 lead scientist at the Laboratory for Atmospheric and Space Physics in Boulder, Colorado. Scientists have learned that variations in UV radiance produce significant changes in the results of the computer simulations.
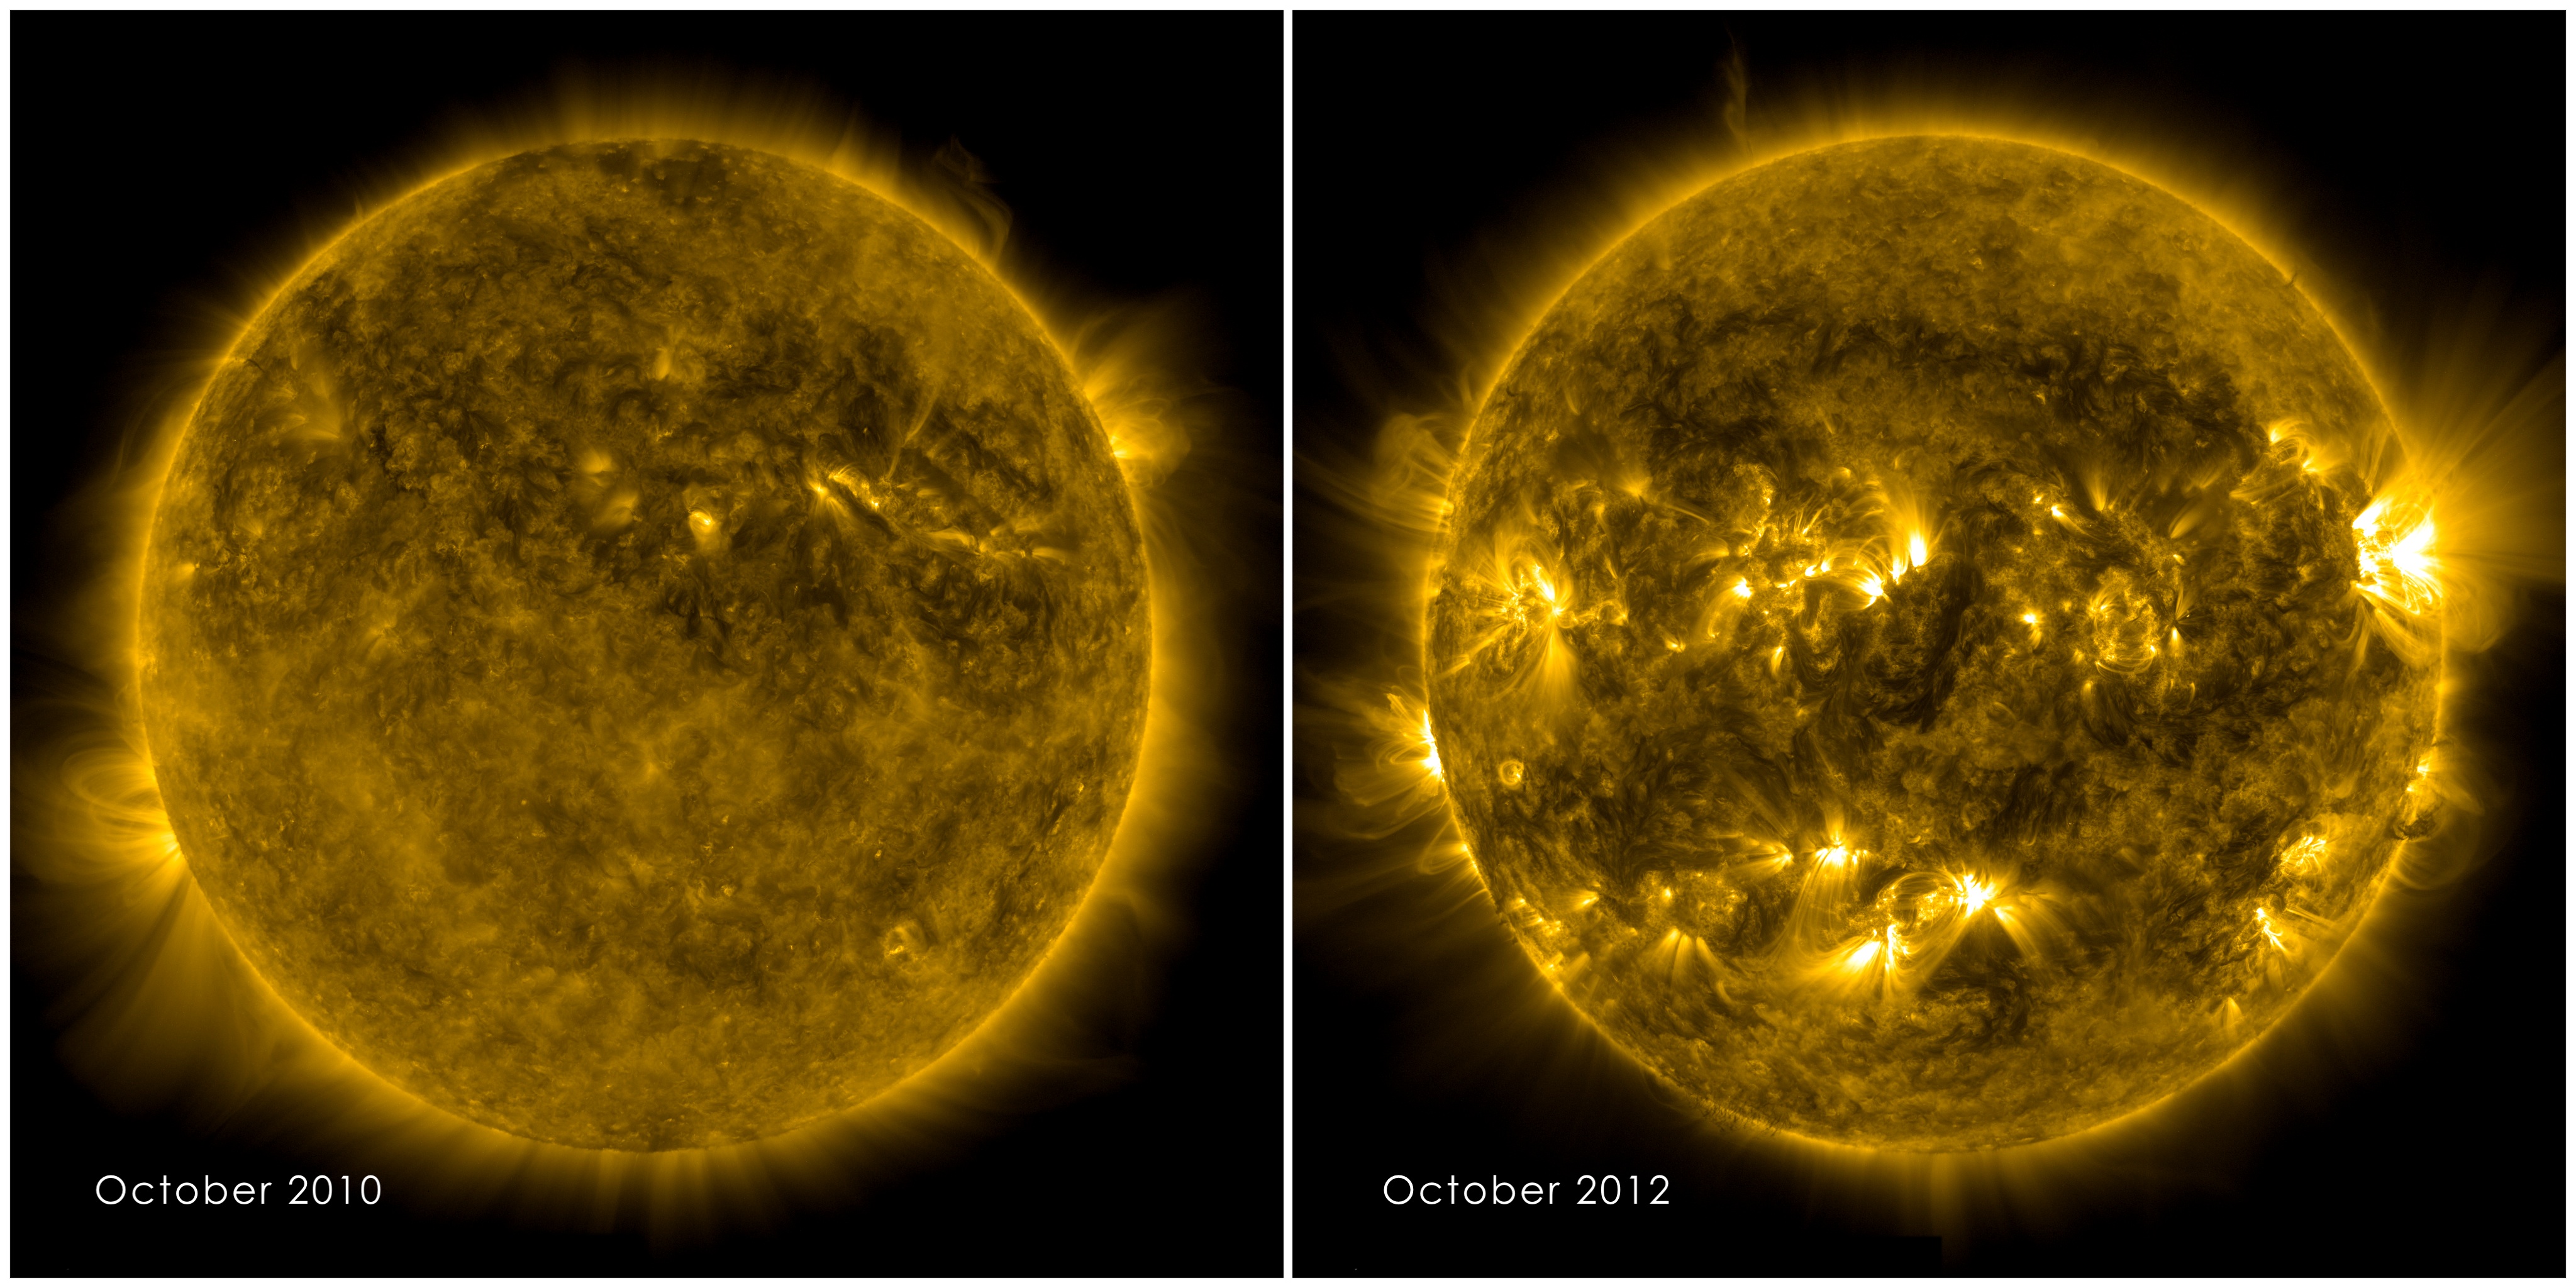
Overall, solar energy output varies by approximately 0.1 percent — or about 1 watt per square meter between the most and least active part of an 11-year solar cycle. The solar cycle is marked by the alternating high and low activity periods of sunspots, dark regions of complex magnetic activity on the Sun’s surface. While UV light represents a tiny fraction of the total sunlight that reaches the top of Earth’s atmosphere, it fluctuates much more, anywhere from 3 to 10 percent, a change that in turn causes small changes in the chemical composition and thermal structure of the upper atmosphere.
That’s where TSIS-1 comes in. “[TSIS] measurements of the solar spectrum are three times more accurate than previous instruments,” said Pilewskie. Its high quality measurements will allow scientists to fine tune their computer models and produce better simulations of the ozone layer’s behavior — as well as other atmospheric processes influenced by sunlight, such as the movement of winds and weather that are.
TSIS-1 joins a fleet of NASA’s Earth-observing missions that monitor nearly every aspect of the Earth system, watching for any changes in our environment that could harm life.
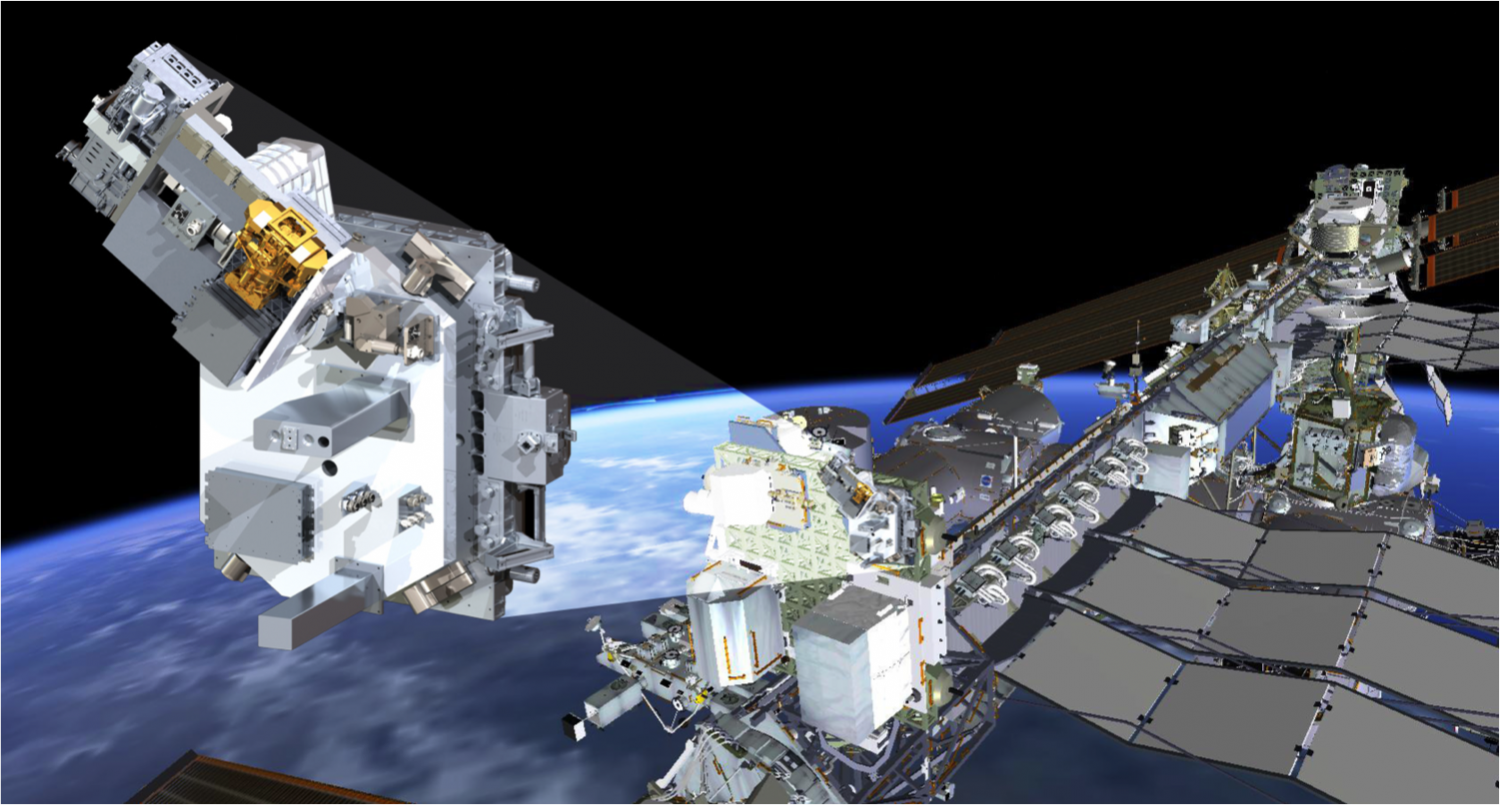
For more than five decades, NASA has used the vantage point of space to understand and explore our home planet, improve lives and safeguard our future by deploying space based sensors like TSIS-1. NASA’s Goddard Space Flight Center has overall responsibility for the development and operation of TSIS-1 on International Space Station as part of the Earth Systematic Missions program. The Laboratory for Atmospheric and Space Physics at the University of Colorado Boulder, under contract with NASA, is responsible for providing the TSIS-1 measurements and ensuring their availability to the scientific community.
By Rani Gran
NASA’s Goddard Space Flight Center, Greenbelt, Md.