


NASA Gets a Final Look at Hurricane Gert’s Rainfall
Before Hurricane Gert became a post-tropical cyclone, NASA got a look at the rainfall occurring within the storm. After Gert became post-tropical NOAA’s GOES-East satellite captured an image as Gert was merging with another system.
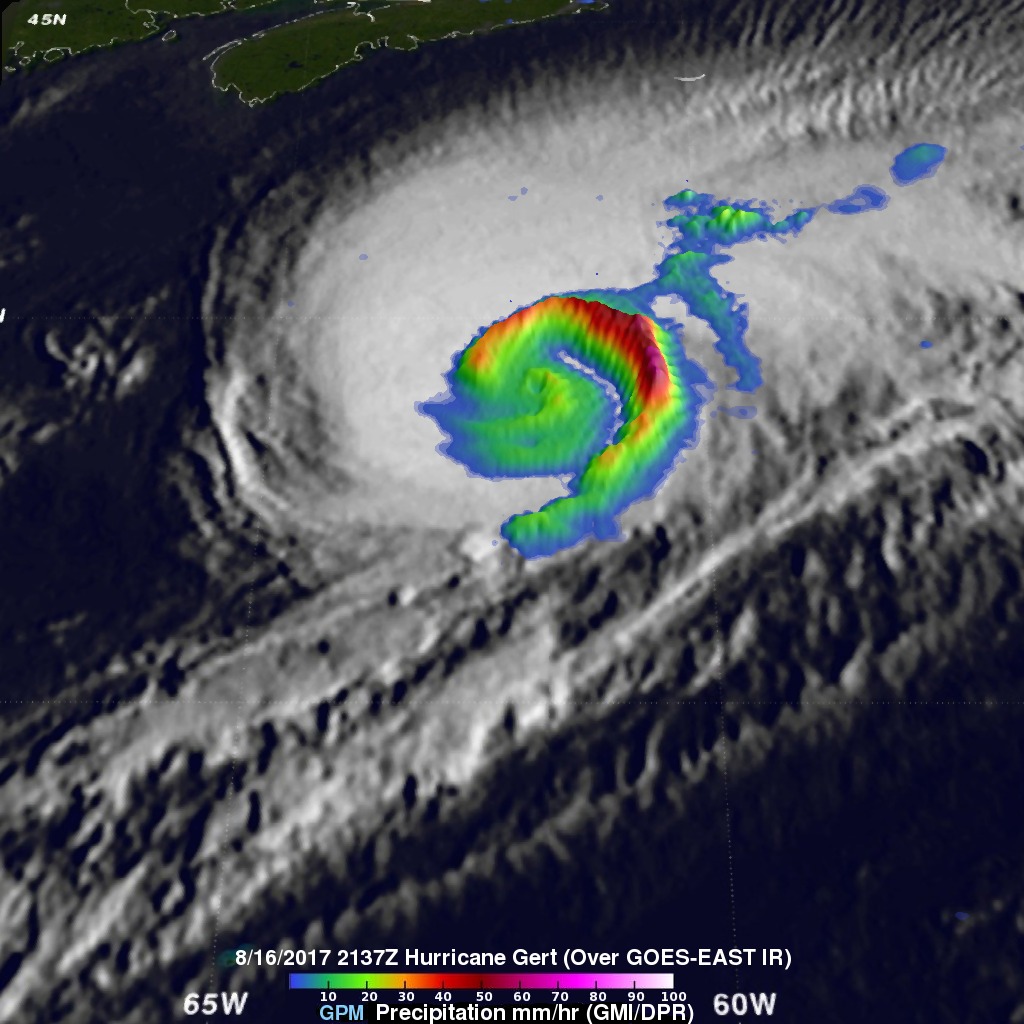
The Global Precipitation Measurement mission or GPM core observatory satellite provided rainfall information on Hurricane Gert on August 16, 2017 at 5:37 p.m. EDT (2137 UTC). At that time, Gert was a strong category two hurricane with maximum sustained winds of about 93.5 mph (85 knots).
Data from GPM’s Microwave Imager (GMI) instrument showed that rain was still falling at a rate of more than 2.94 inches (74.7 mm) per hour in a powerful band of storms spiraling around Gert’s eastern side. With that pass GPM’s Dual-Frequency Precipitation Radar (DPR) had a limited encounter with hurricane Gert. DPR did find that rain in storms on the extreme northeastern edge of the hurricane was falling at a rate of up to 2.8 inches (70.3 mm) per hour. In that area storm tops were found by GPM’s radar (DPR Ku band) to reach up to 7.5 miles (12.1 km).
At 5 p.m. EDT on Thursday, August 17, the National Hurricane Center (NHC) issued their final advisory on the system and indicated that Gert was post-tropical. Gert was located about 860 miles (1,390 km) east of Halifax, Nova Scotia, Canada. Maximum sustained winds had decreased to near 65 mph (100 kph) and were steadily weakening as Gert moved over the cool waters of the North Atlantic Ocean.
NHC Forecaster Zelinsky noted that “the circulation has become quite elongated, and the remaining deep convection appears to be primarily associated with frontal boundaries.”
Today, Aug. 18, Gert is forecast to merge with or be absorbed by another extratropical low pressure area.
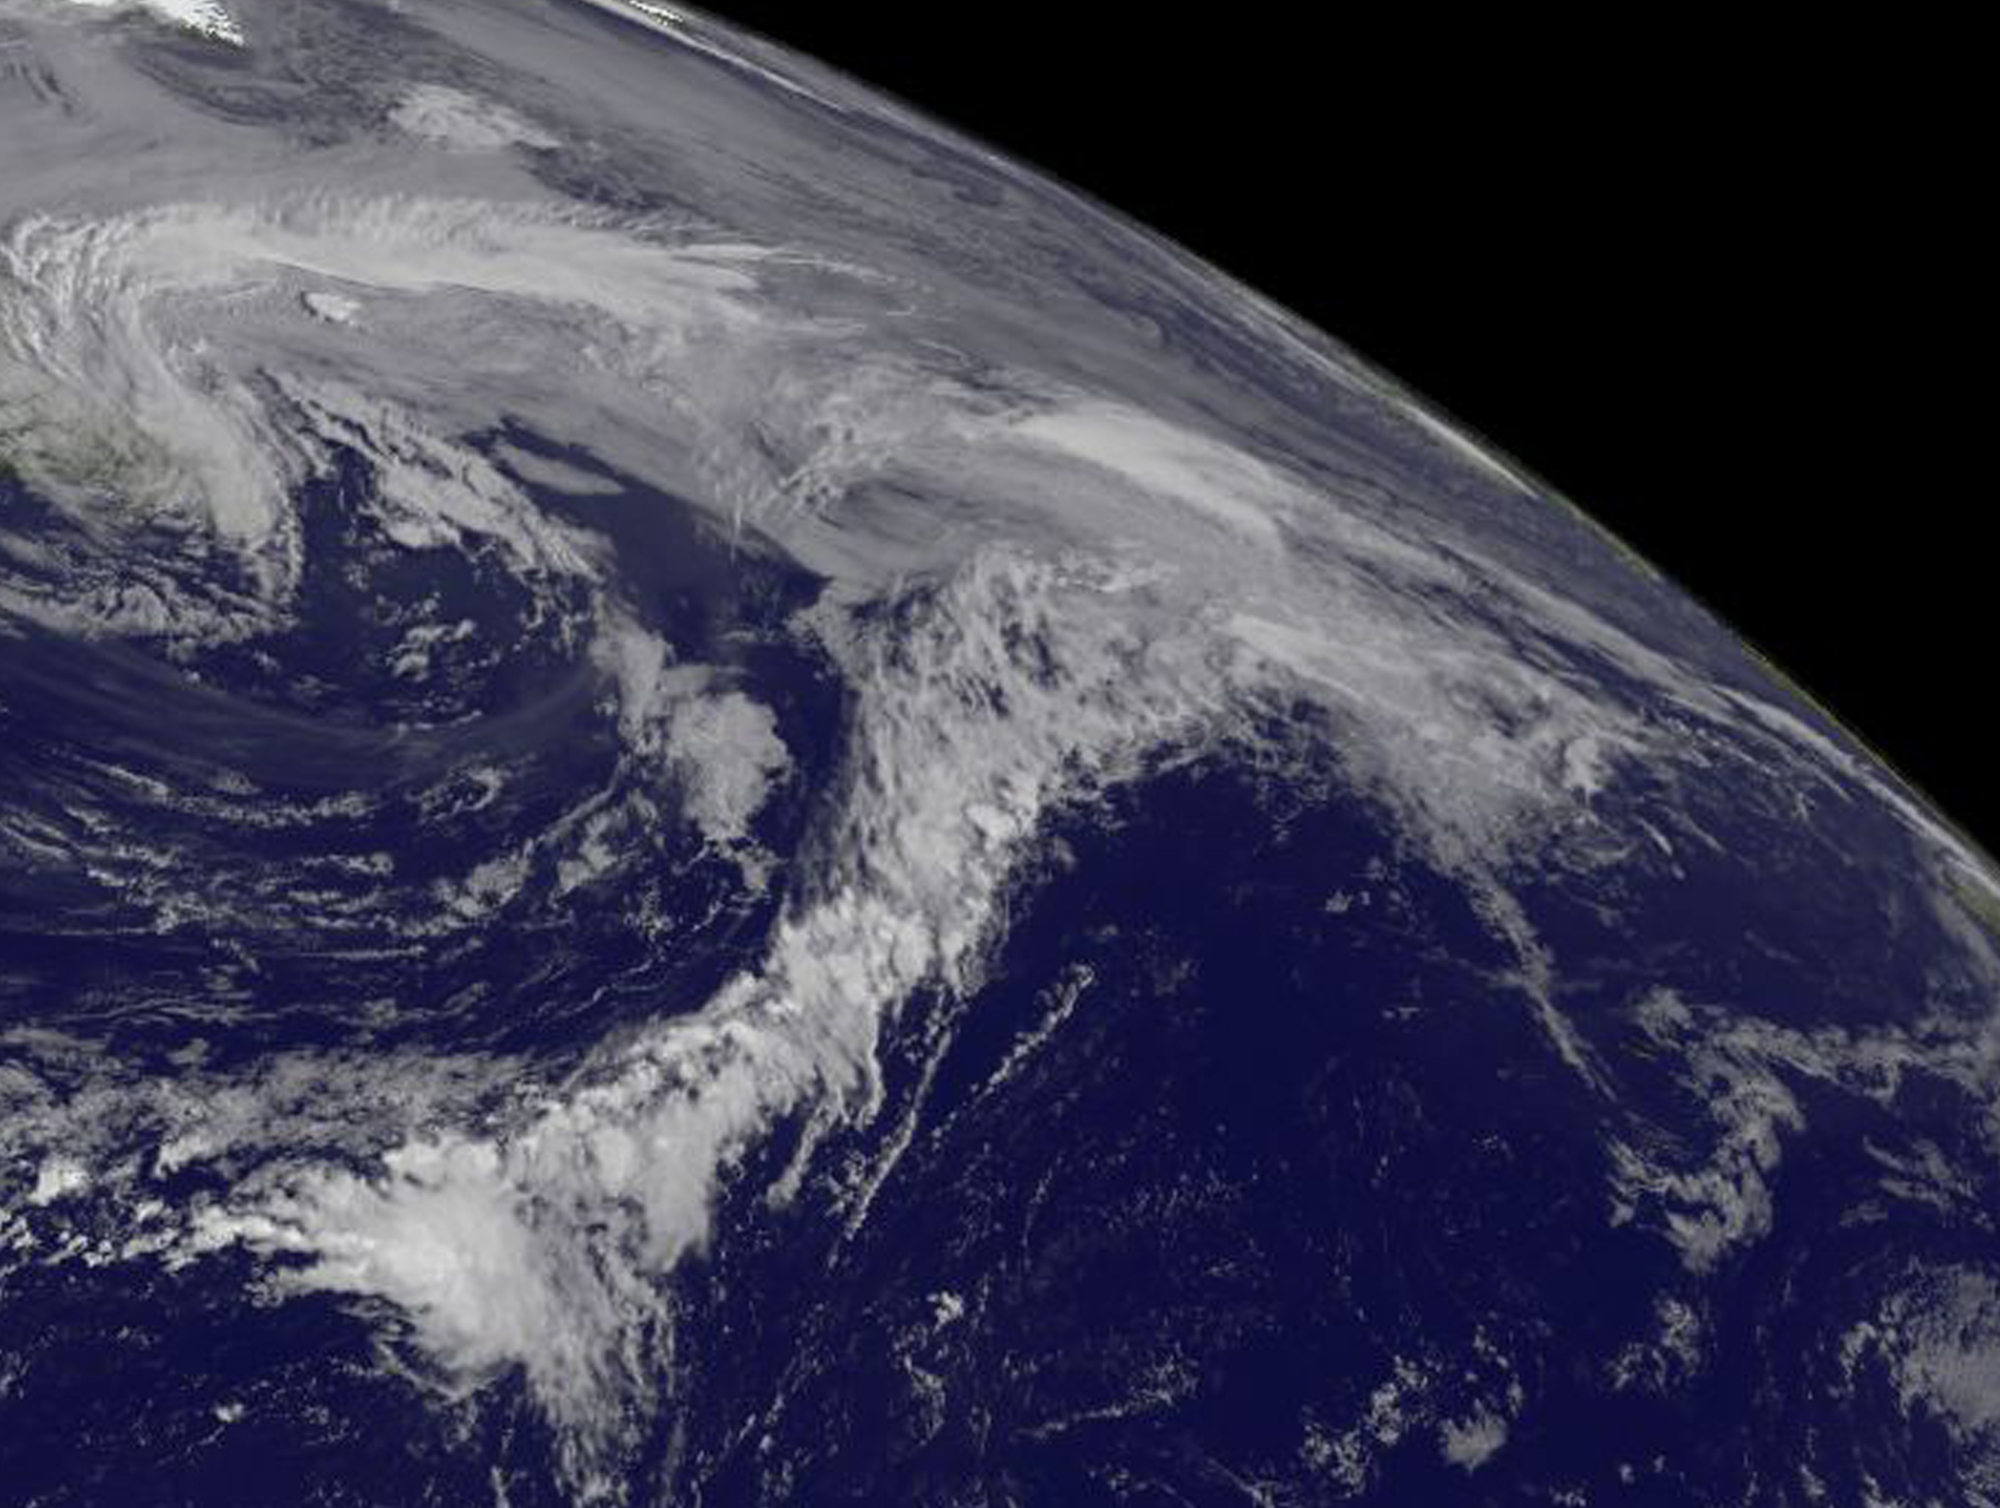
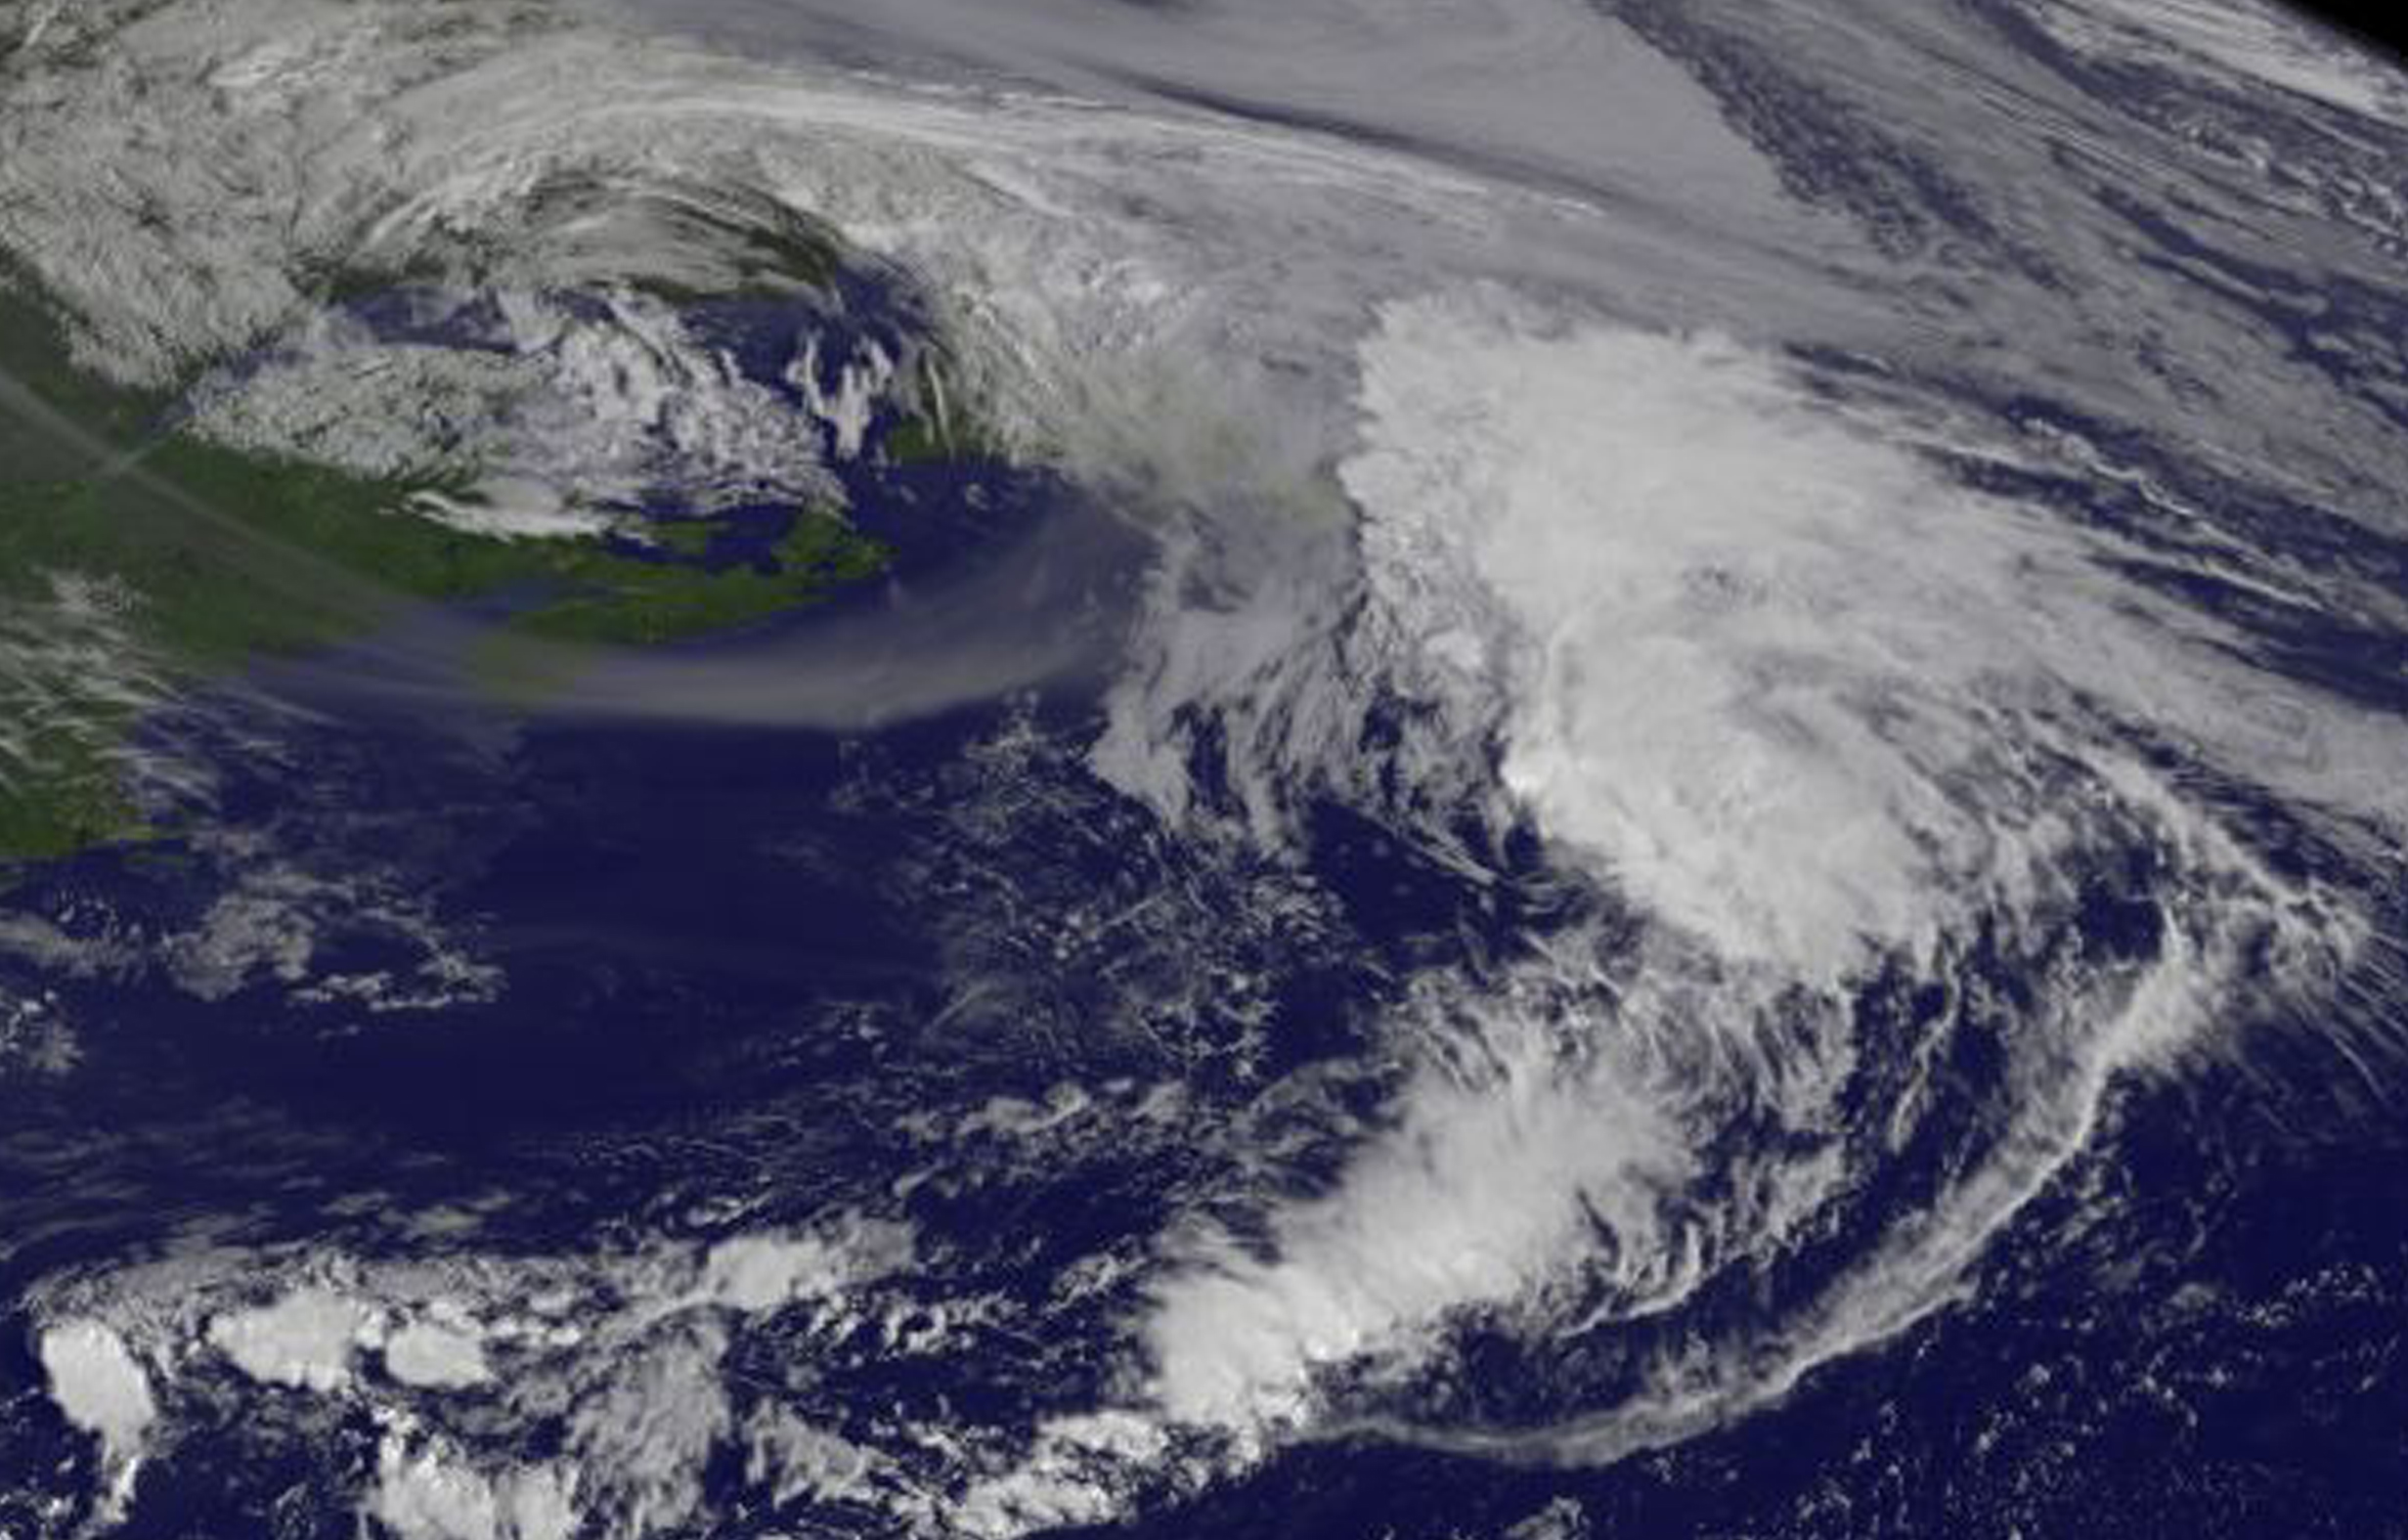
NOAA’s GOES-East satellite provided a visible-light image of Post-Tropical Cyclone Gert at 7:45 a.m. EDT (1145 UTC) as it continued to race across the North Atlantic Ocean and merge with another system. The merging system appeared to have a long “tail” of clouds along a boundary that stretched into the north central Atlantic Ocean.
The NASA/NOAA GOES Project at NASA’s Goddard Space Flight Center in Greenbelt, Maryland created an image. NOAA manages the GOES series of satellites and the NASA/NOAA GOES Project creates images and animations from the data.
The system is expected to continue to move east toward Europe.
By Rob Gutro / Hal Pierce
NASA’s Goddard Space Flight Center
Aug. 17, 2017 – Satellites Show Hurricane Gert Being Affected by Wind Shear
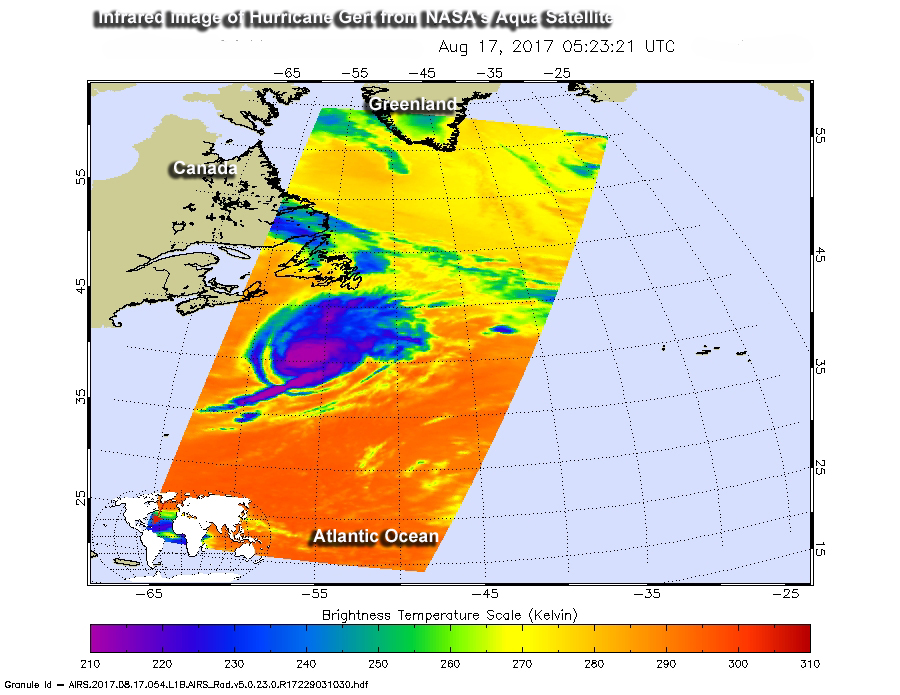
NASA’s Aqua satellite and NOAA’s GOES-East satellite provided an infrared and visible look at Atlantic Hurricane Gert. Both images showed the storm was being affected by wind shear and had become elongated.
The Atmospheric Infrared Sounder or AIRS instrument that flies aboard NASA’s Aqua satellite analyzed Gert in infrared light on Aug. 17 at 8:45 a.m. EDT (1145 UTC). AIRS data showed Gert coldest cloud top temperatures exceeded minus 63 degrees Fahrenheit (minus 53 degrees Celsius) and were being pushed northeast of the center. Storms with temperatures that cold are high in the troposphere and NASA research has shown they have the ability to generate heavy rain.
On Aug. 17 at 8:45 a.m. EDT (1145 UTC) NOAA’s GOES-East satellite provided a visible image of Gert. The National Hurricane Center said that the convective structure of Gert had rapidly deteriorated during the morning hours due to very cold sea surface temperatures and increasing strong vertical wind shear. The GOES-East image showed that Gert still had some strong thunderstorm development in the northeast quadrant, but it appeared elongated from south-southwest to north-northeast.
At 11 a.m. EDT (1500 UTC), the center of Hurricane Gert was located near 43.2 degrees north latitude and 50.0 degrees west longitude. It is centered about 685 miles (1,100 km) east of Halifax, Nova Scotia, Canada, and about 285 miles (460 km) south-southeast of Cape Race, Newfoundland.
Gert is moving toward the east-northeast near 40 mph (65 kph), and this general motion is expected to continue for the next day or so. Maximum sustained winds have decreased to near 80 mph (130 kph) with higher gusts. Additional weakening is forecast during the next 48 hours. Gert is forecast to become a post-tropical cyclone later today.
For updates on Gert, visit the NHC website: www.nhc.noaa.gov.
By Rob Gutro
NASA’s Goddard Space Flight Center, Greenbelt, Md.
Aug. 16, 2017 – NASA’s Infrared Look at Hurricane Gert
NASA’s Aqua satellite provided an infrared look at the power within Atlantic Hurricane Gert and saw the hurricane had very cold cloud top temperatures.
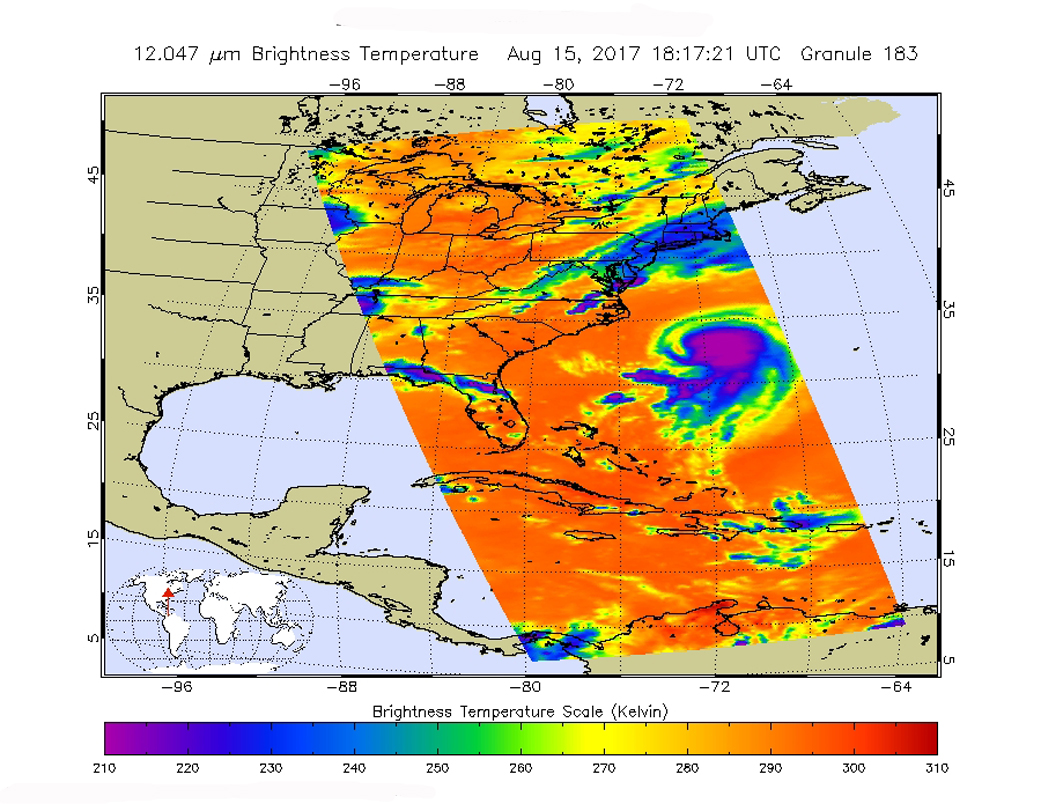
The Atmospheric Infrared Sounder or AIRS instrument that flies aboard NASA’s Aqua satellite analyzed Gert in infrared light on Aug. 15 at 2:17 p.m. EDT (1817 UTC). AIRS data showed Gert’s cloud pattern had become better organized than it was earlier in the day, and Gert had a well-defined convective band of thunderstorms around the center.
Some of the coldest cloud top temperatures exceeded minus 63 degrees Fahrenheit (minus 53 degrees Celsius). Storms with temperatures that cold are high in the troposphere and NASA research has shown they have the ability to generate heavy rain.
Earlier in the day, Gert had exhibited hints of an eye in visible satellite imagery, but the AIRS infrared imagery didn’t show an eye when NASA’s Aqua satellite analyzed the storm.
At 11 a.m. EDT (15900 UTC) on Wednesday, Aug. 16, 2017, the center of Hurricane Gert was located near 36 degrees north latitude and 68.4 degrees west longitude. That’s about 355 miles (575 km) northwest of Bermuda and 510 miles (820 km) south-southwest of Halifax, Nova Scotia, Canada.
Gert was moving toward the northeast near 25 mph (41 kph). The National Hurricane Center (NHC) expects an even faster motion toward the northeast or east-northeast through early Friday, Aug. 18. The estimated minimum central pressure is 975 millibars. Maximum sustained winds increased to near 95 mph (150 kph) with higher gusts. Some additional strengthening is possible through Aug. 16 and then Gert is expected to weaken.
Gert is forecast to become an extratropical low pressure system by Thursday night, Aug. 17.
Although Gert is not close to the coast, the hurricane is stirring up rough seas that are affecting U.S. East coastal areas. The National Hurricane Center said “swells generated by Gert will spread northward along the east coast of the United States from Virginia northward to New England and Atlantic Canada during the next couple of days. Swells are also expected to continue to affect Bermuda through tonight. These swells are likely to cause life-threatening surf and rip current conditions.”
For updates on Gert, visit the National Hurricane Center webpage:
By Rob Gutro
NASA’s Goddard Space Flight Center, Greenbelt, Md.
Aug. 15, 2017 – NASA’s GPM Found Gert Strengthening into a Hurricane
NASA looked at the rainfall rates within Tropical Storm Gert as it continued to strengthen and found the most intense rainfall on the tropical cyclone’s eastern side. Just over 12 hours later, Gert would strengthen into a hurricane. As Gert has strengthened, the storm began generating dangerous surf along the U.S. East coast.
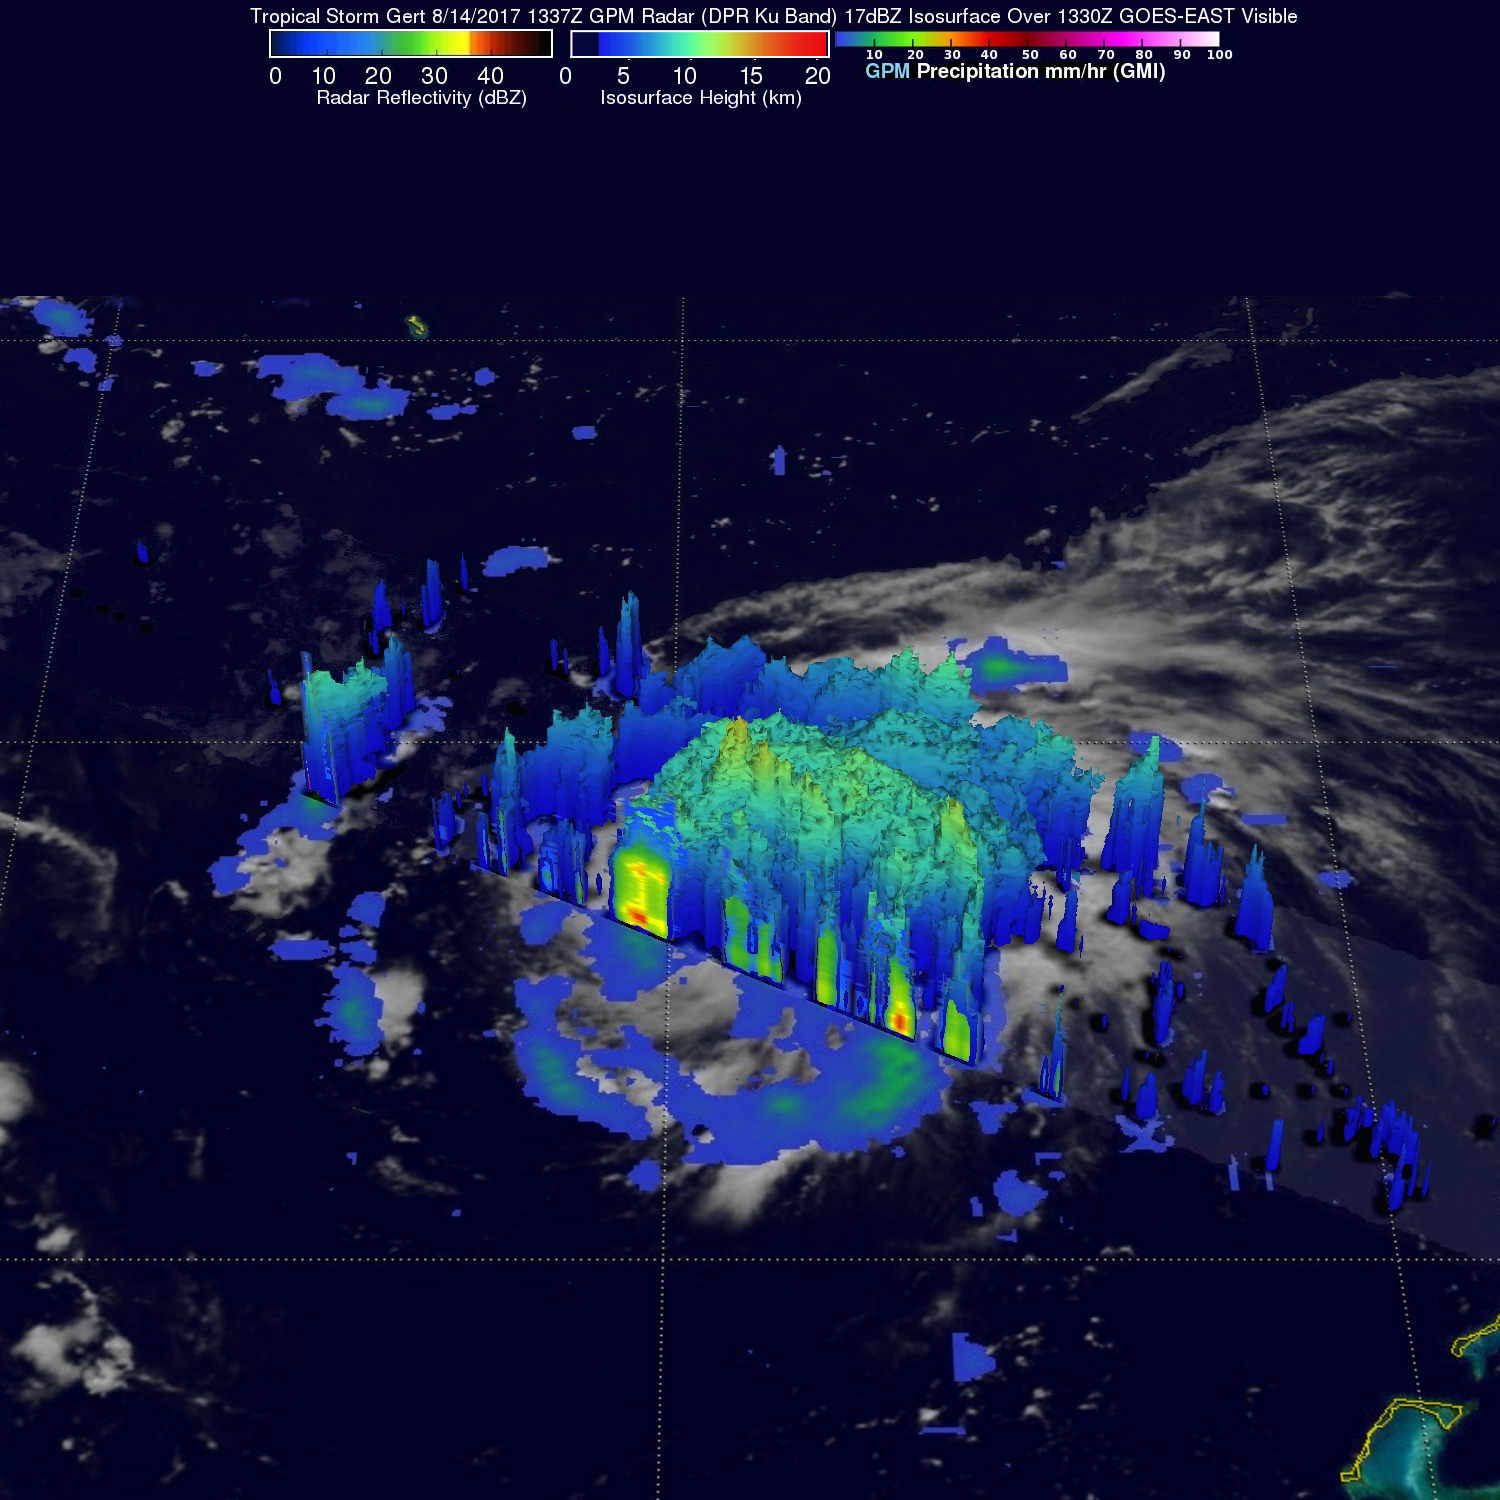
The Global Precipitation Measurement mission or GPM core observatory satellite passed above tropical storm Gert on August 14, 2017 at 9:36 a.m. EDT (1336 UTC) when winds had reached about 57.5 mph (50 knots). Data collected by GPM’s Microwave Imager (GMI) and Dual-Frequency Precipitation Radar (DPR) instruments were used to show the coverage and the intensity of rainfall around Tropical Storm Gert. The area covered by GPM’s radar swath revealed that the most intense rainfall, measuring greater 3.5 inches (90 mm) per hour, was located in bands of rain on the eastern side of the storm.
That GPM pass was mentioned in a National Hurricane Center (NHC) Tropical Storm Gert Discussion that noted, “A recent 1336 UTC (9:36 a.m. EDT) GMI overpass shows a large band of convection wrapping around the circulation …”
At NASA’s Goddard Space Flight Center in Greenbelt, Maryland, GPM’s Radar (DPR Ku Band) data was used to create a 3-D cross-section view through Gert. This examination of the storm’s 3-D precipitation structure showed that the tallest thunderstorms were located in an intense band of rain east of Gert’s center. The tall thunderstorms in that band were shown by DPR to reach altitudes above 9.4 miles (15.2 km). GPM is a joint mission between NASA and the Japan Aerospace Exploration Agency, JAXA.
On Aug. 14 at 1:18 p.m. EDT (17:18 UTC) NASA-NOAA’s Suomi NPP satellite captured a visible image of Tropical Storm Gert, located off the coast of the southeastern U.S. The image showed that the bulk of clouds were still on the eastern side of the storm, but powerful thunderstorms surrounded the low-level center of circulation. A thick band of thunderstorms also wrapped into the center from the south.

On August 14 at 11 p.m. EDT Gert become the second hurricane of the 2017 season.
At 5 a.m. EDT (0900 UTC), the center of Hurricane Gert was located near 31.8 degrees north latitude and 72.5 degrees west longitude. That’s about 450 miles (725 km) west of Bermuda.
Gert was moving toward the north near 12 mph (19 km/h). A turn toward the northeast with an increase in forward speed is expected later today. Maximum sustained winds remained near 75 mph (120 kph) with higher gusts. Gert has the opportunity to gather some strength later today or Wednesday. The estimated minimum central pressure is 986 millibars.
Credits: NASA/JAXA, Hal Pierce
The National Hurricane Center noted that as Gert has increased in strength, ocean swells generated by Gert will spread northward along the east coast of the United States from North Carolina northward to Long Island during the next couple of days. Swells are also expected to affect Bermuda during the next couple of days. These swells are likely to cause life-threatening surf and rip current conditions.
Gert is expected to travel toward the northeast over the open waters of the northern Atlantic Ocean and dissipate by Saturday August 19, 2017.
For updated forecasts on Gert, visit the NHC website: www.nhc.noaa.gov.
By Rob Gutro / Hal Pierce
NASA’s Goddard Space Flight Center
Aug. 14, 2017 – NASA Sees Strengthening Tropical Storm Gert West of Bermuda
Tropical Depression Eight (TD8) formed around 11 p.m. EDT on Saturday, August 12 about 260 miles northeast of the southeastern Bahamas. By 5 p.m. the depression strengthened into a tropical storm and was named Gert.

At 1 p.m. EDT (1700 UTC) on Sunday, August 13, NOAA’s GOES-East satellite captured a visible image of Tropical Depression 8 that showed the storm had become better organized. Bands of thunderstorms were spiraling into the center of circulation from the east and the southern quadrants of the storm. NOAA manages the GOES series of satellites. NASA/NOAA’s GOES Project at NASA’s Goddard Space Flight Center in Greenbelt, Maryland uses the satellite data to create imagery.
By 1:36 p.m. EDT (1736 UTC) on August 13, The Visible Infrared Imaging Radiometer Suite (VIIRS) instrument aboard NASA-NOAA’s Suomi NPP satellite provided a visible look at Gert. Bands of thunderstorms wrapped around the storm from southeast to northeast.

The National Hurricane Center (NHC) noted that imagery showed that between the morning and 5 p.m. EDT “the banding features have become better established during the last several hours, and the system has become less vertically tilted.”
On August 14 at 5 a.m. EDT (0900 UTC) the center of Tropical Storm Gert was located near 29.7 degrees north latitude and 72.2 degrees west longitude. That’s about 475 miles (760 km) west-southwest of Bermuda. The estimated minimum central pressure is 1009 millibars. Maximum sustained winds are near 45 mph (75 kph) with higher gusts.
Gert was moving toward the north-northwest near 9 mph (15 kph) and the NHC forecasts a turn toward the north then to north-northeast. On the forecast track, Gert is expected to pass about midway between the United States east coast and Bermuda on Tuesday
The NHC said that some strengthening is forecast during the next 48 hours, and Gert could become a hurricane by Wednesday, August 16.
For forecast updates on Gert, visit: www.nhc.noaa.gov.
By Rob Gutro
NASA’s Goddard Space Flight Center